So my name is Mikhail and I am CTO at Exerica. One of the problems we are solving is making it easier for financial analysts to work with numerical data. They usually work both with the original documents of financial and statistical reporting, and some kind of tool for creating and maintaining analytical models. It so happened that 99% of analysts work in Microsoft Excel and do quite complex things there. Therefore, transferring them from Excel to other solutions is not efficient and practically impossible. Objectively, the "cloud" services of spreadsheets do not yet reach the functionality of Excel. But in the modern world, tools should be convenient and meet the expectations of users: open by mouse click, have a convenient search. And implementation in the form of various unrelated applications will be quite far from the user's expectations.
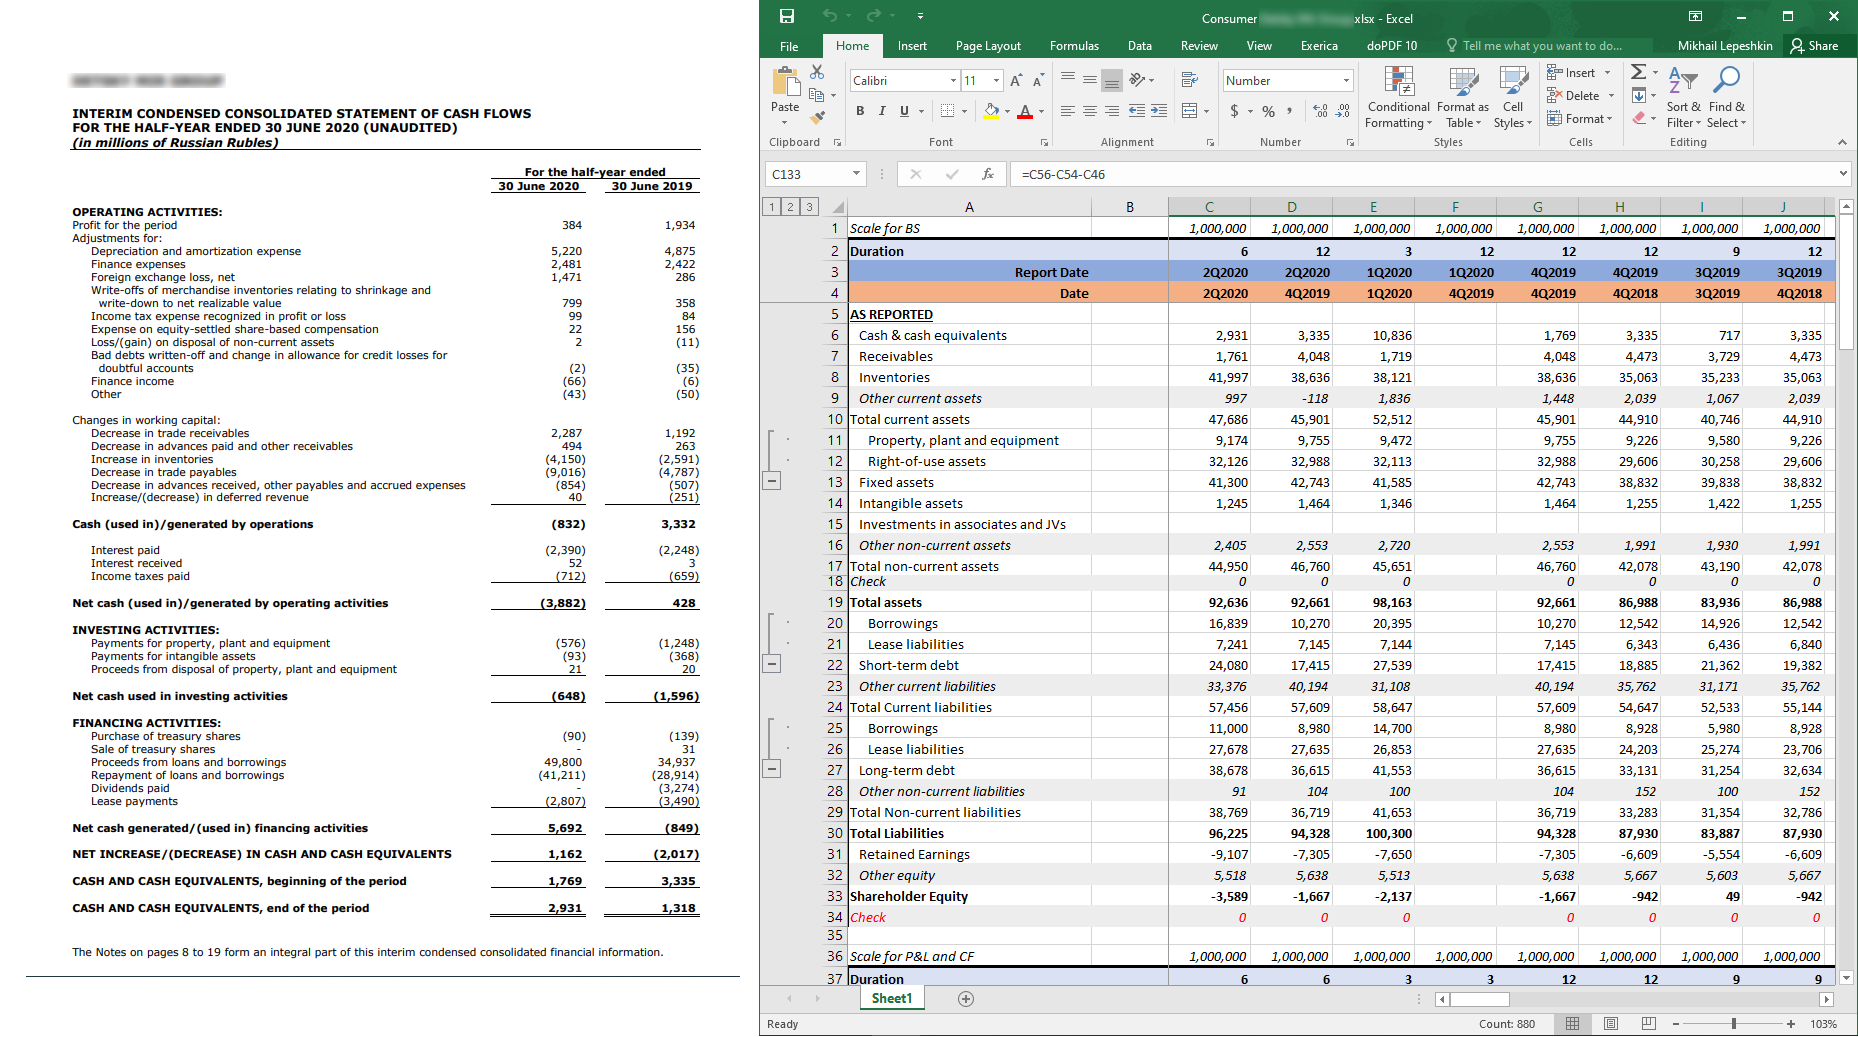
What the analyst works with looks something like this: The main data here are numerical "financial indicators", for example, income for the 1st quarter of 2020. For the sake of simplicity, I will refer to them as simply “numbers”. As you can see, there is almost no connection between the numbers in the document and in the analytical model, everything is only in the analyst's head. And working with filling and maintaining the model takes hours of searching and interrupting numbers from the document into tables, and then looking for input errors. At the same time, we would like to offer the user familiar tools: "drag and drop", insert through the clipboard, and so on, as well as a quick view of the source data.
What we already had
By the time we started implementing interactive interaction with Excel in the form described in this article, we already had a database in MongoDB, a backend in the form of a REST API in .NET Core, a front- end SPA in Angular, and some other services. At this point, we have already tried various options for integrating into spreadsheet applications, including Excel, and they all did not go beyond MVP, but this is a topic for a separate article.

Linking data
There are two common tools in Excel that can be used to solve the problem of linking data in a table with data in the system: RTD (RealTimeData) and UDF (User-Defined Functions). Pure RTD is less user-friendly in terms of syntax and limits the flexibility of the solution. Using UDF, you can create a custom function that will work in a way that is familiar to an Excel user. It can be used in other functions, it understands references like A1 or R1C1 and generally behaves as it should. At the same time, no one bothers to use the RTD mechanism to update the function value (which we did). We developed UDF in the form of Excel addin using C # and .NET Framework we are used to. We used the Excel DNA library to speed up development .
In addition to UDF, our addin implements a ribbon (toolbar) with settings and some useful functions for working with data.
Add interactivity
To transfer data to Excel and to establish interactivity, we have developed a separate service that provides a Websocket connection using the SignalR library and is actually a broker for messages about events that should be exchanged by the front-end parts of the system in real time. We call it Notification Service.

Insert data into Excel
In our SPA, we highlight all the numbers that the system has detected. The user can select them, navigate through them, etc. For data insertion, we have implemented 3 mechanisms to close various use cases:
- Drag-and-drop
- Automatic insertion on click in SPA
- Copy and paste via clipboard
When the user initiates drag'n'drop of a certain number from SPA, a link with the identifier of this number from our system (
.../unifiedId/005F5549CDD04F8000010405FF06009EB57C0D985CD001) is formed for dragging . When pasting into Excel, our addin intercepts the insert event and parses the inserted text with regexp. When a valid link is found on the fly, it replaces it with the appropriate formula =ExrcP(...).
When you click on a number in the SPA via the Notification Service, a message is sent to the addin, containing all the necessary data to insert the formula. Next, the formula is simply inserted into the currently selected cell.
These methods are good when the user needs to insert one number into his model, but if he needs to transfer the whole table or part of it, another mechanism is needed. Copying through a clipboard seems to be the most familiar to users. However, this method turned out to be more complicated than the first two. The fact is that, for convenience, the inserted data should be presented in the native Excel format - OpenXML Spreadsheet. This is most easily implemented using the Excel object model, that is, from the addin. Therefore, the process of forming a clipboard looks like this:
- User selects area with numbers in SPA
- An array of allocated numbers is passed to the Notification Service
- Notification Service passes it to addin
- Addin generates OpenXML and inserts it into the clipboard
- The user can paste data from the clipboard anywhere in any Excel spreadsheet.

Despite the fact that data goes a long way, thanks to SignalR and RTD, this happens quite quickly and abstracted from the user.
We disseminate data
After the user has selected the initial data for their model, they need to "propagate" all the periods (years, semesters and quarters) that are of interest. For these purposes, one of the parameters of our UDF is the date (period) of this date (remember: "income for the 1st quarter of 2020"). Excel has a native formula "spreading" mechanism that allows you to fill cells with the same formula, taking into account the references specified in the parameters. That is, instead of a specific date, a link to it is inserted into the formula, and then the user “extends” it to other periods, while “the same” numbers from other periods are automatically loaded into the table.
And what is that number there?
The user now has a model with several hundred rows and several dozen columns. And he may have a question, what is there for the number in cell L123? To get an answer, he just needs to click on this cell and in our SPA the same report will open, on the same page where the clicked number is written, and the number in the report will be highlighted. Like this:

And if this is not just one number from the report, but the result of some calculations on the numbers taken from the report, then we will highlight all the numbers included in the expression calculated in Excel. This does not load the entire application and load all the necessary data, as in the case of following a link.
As a conclusion
This is, in my opinion, a non-standard implementation of interaction between Excel and a web application, which turned out to be quite user-friendly. Thanks to the use of Excel, the entry threshold for users from the target audience is quite low. At the same time, we also get all the power of Excel for working with numerical data. The data itself always remains associated with the source, as well as associated in time. For target customers, there is no need to build completely new external systems into the business process of working with data. Our solution is embedded as an additional “tool” inside Excel, which is the de facto standard for financial data providers.
A similar architectural approach to integrating web applications with Microsoft Excel can be applied to other tasks that require interactivity and complex user interfaces when working with numerical and tabular data.