Purpose of the article: Demonstration of the implementation of a cheap data visualization solution that can be used in dispatching systems.
How did it start.
At one of the industries in the energy sector, about 20 units with more than 10,000 signals were automated; it was necessary to develop a dispatching system to monitor the data of the APCS.
In this regard, I was interested in implementing an IT solution for data visualization in the form of graphs and video frames (mnemonic diagrams). The solution should be scalable, cross-platform, easy-to-use, web-based. And so, the functionality is mnemonic diagrams, graphics. Go …
Mnemonic diagrams
To develop mnemonic diagrams, a graphic editor is required.
Developing your own is difficult, expensive, so Visio was chosen.
Why Visio?
1 - supports vector graphics;
2 - has a built-in vba editor;
3 - allows you to create your own library of graphic elements;
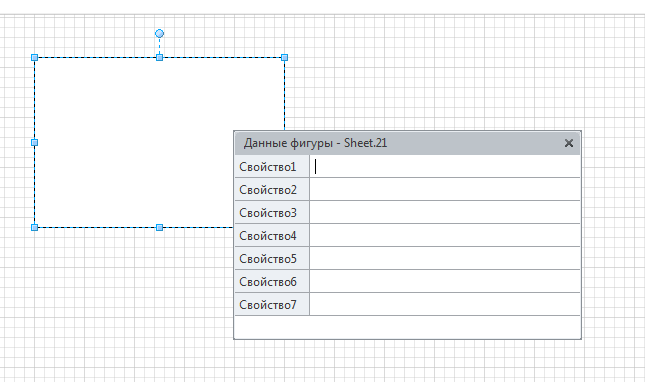
4 - has the ability to add an arbitrary set of properties to a graphical object (see Fig. 1)
5 - common editor, many users.
Therefore, Visio became the ideal editor for my purposes.

Fig. 1.
Charts
It was easier here, first we considered the highcharts library, but since it is paid, the
choice was made in favor of d3.js.
d3.js is a very cool framework, great features, a little difficult to learn, but there are many examples on the Internet.
The "Charts" web form allows you to view charts at different time ranges, coordinate planes, set scales and other features.
Application development platform
For the development of a web application, the ASP.NET web programming platform was chosen, the ASP.NET MVC framework, and later the application was transferred to ASP.NET Core MVC.
How the app works
So how does the app work?
The application receives data through the web api interface and displays it to the user in the form of graphs and mnemonic diagrams.
The application can work in two ways.
The first option:

Fig. 2.
As already mentioned, the application implements a web api interface through which it receives data, data services (program modules) are directly involved in receiving data from sources. In the first version of the work, you can see that the services are implemented inside the application, which is convenient when, for example, the application and data sources are on the same network.
Second option:

Fig . 3
In the second version, services are separate software modules that the application accesses for data. The second option can be used when the sources and the application are on different networks, the application, for example, is deployed on a hosting.
The main object in the application is Tag - a variable, a measured value of a technological process. A set of methods (for example GetTagOnline, GetTagArchive, etc.) for working with tags implements the web api interface.
So, the application takes data from the services, loads the mnemonic diagram, developed by the user in Visio, and displays this data.
Animation of graphic objects on a mnemonic diagram
Javascript is used to animate graphic elements of the mnemonic scheme. In order to make it easier for the user to develop animation functions, the application has a small library that includes, for example, the following functions: printf (Text), SetText (Object, Index, Value), SetBackColor (Object, Index, Value), SetVisible (Object, Value), GetTag (TagName), etc.
For example, the measured value display function:
Function Field (Object, Property) {
var Tag = GetTag(Property.Tag1);
SetText(Object,1,Tag.Value);
}
Administration, configuration.
For configuration, configuration files are used, where the user creates profiles, adds services, etc. This application is a console application, it can work as a win-service.
The app uses the built-in Kestrel cross-platform web server.
The article is called “Monitoring of data of the automated process control system and not only.”. The application can display, in principle, any data that can be represented in the form of a diagram, diagram, etc.
Thank you all for reading, I am interested in criticism, any feedback. Thanks.
That's all, below are a few pictures of the application.
An example of a mnemonic diagram (was made from the file eplan -> autocad -> visio.):


Graphs:

