Hidden text
- 5-10 ,
- , , ,
- , — , .
In a smaller company, being at the beginning of the journey with a real, not theoretical choice, it will be much more difficult. In practice, things are not as simple as in theory. But also not entirely scary.
The road will be mastered by the walking one: to analyze, search, think, write down.
The easiest and fastest option, take the ready-made averaged list offered by BrowserStack
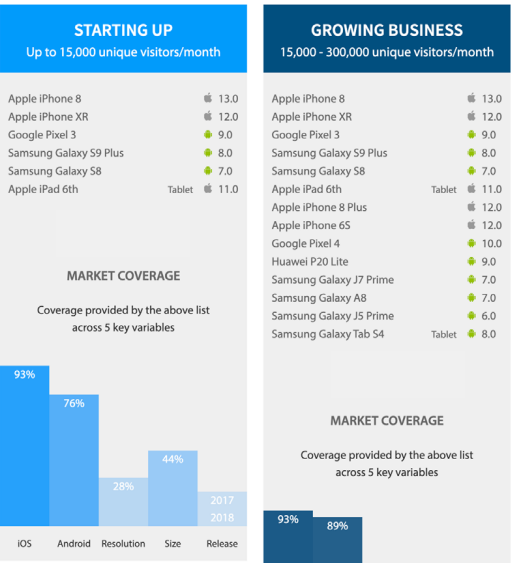
Good distribution, but do not forget that, firstly, this is far from the Russian Federation, and secondly, this is a business project and they offer the devices that they have. While scattered in 2020, the iPhone 6 to 11, variants 8 and XR are "very close", according to Android it is rather weak with Huawei, not to mention Xiaomi.
If you are not looking for easy ways - move on.
-
First of all, request statistics from the team
, — . , , , , , , , , , . , , . , . -
()
. . , ; Plus ( iOS Max, Plus). – /, Android . -
( , – ), , Pencil 2, . , . . «» (NFS, Fingerprint etc.). -
. , . :

The content of the table for example, in your specific case, it will be different.
In the course of work, highlight with color / style those parameters that are important (for example, orange), or required (red). Mark with questions the items that need to be discussed with the team.
Manufacturers . We start with them. On Android, device dependence is quite high, manufacturers are trying to attract customers with "only with us" chips, adding problems to developers, so it is important to test applications on devices from different vendors.
I remind you that the above is not a ready-made template, you will need to update the list during the selection, based on the statistics at that time (statistics not older than six months are considered relevant), ideally for your audience.
For the order, Apple recorded it, but remember that you will be testing separately for each of the platforms (iOS / Android), keep this in mind when choosing.
What Google and OnePlus is doing here will be in the second part.
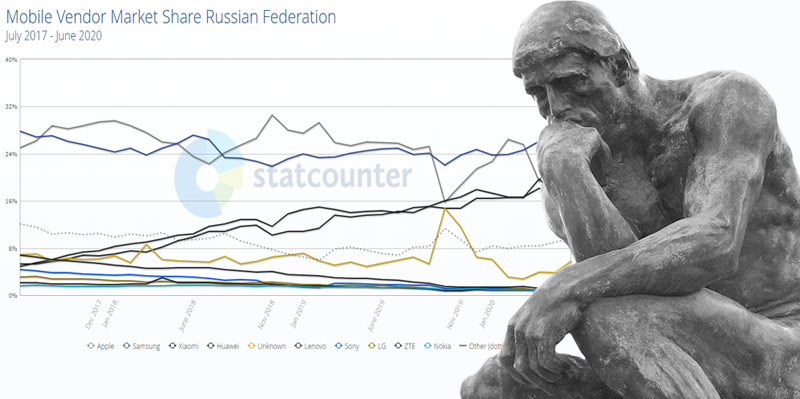
You can see the leading (by traffic) vendors on Statcounter.
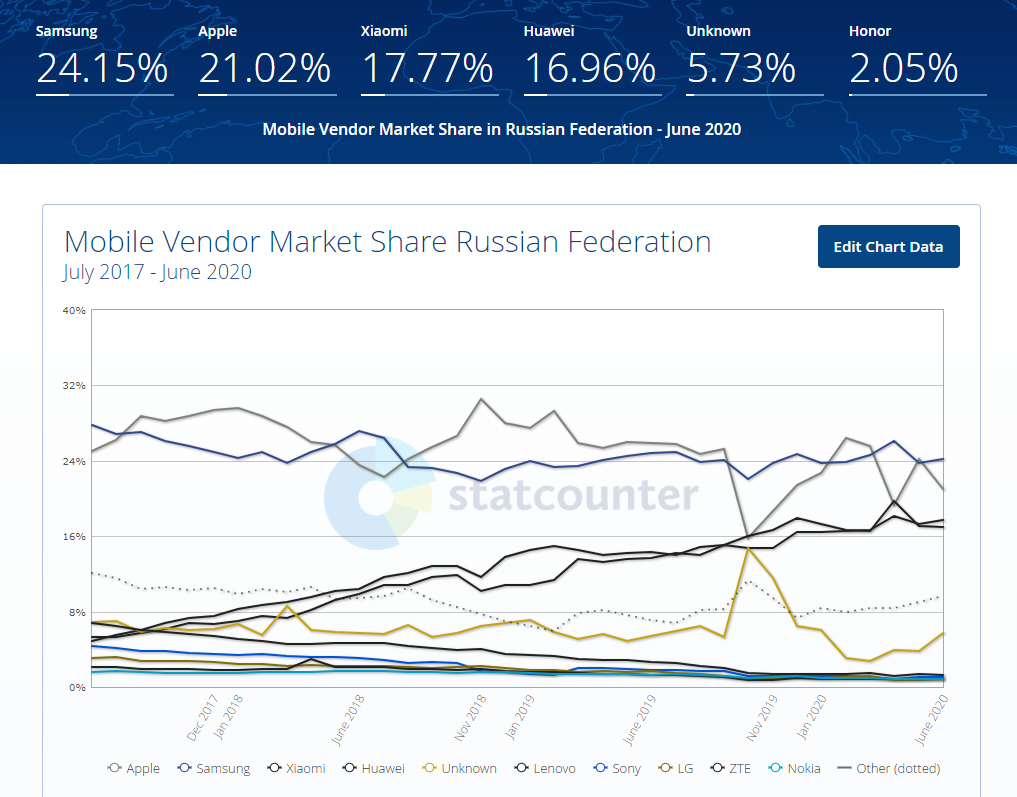
At the top, we see the actual data for the previous month for the selected region, the options are world / Europe / country. The first screenshot shows RF.
Table data can be edited. I chose a long period so that one can see the growth dynamics of some ( Xiaomi from 4 to 18%) and a decrease in the percentage of presence in others (Lenovo from 7% to 1%, LG, Sony, Nokia). Samsung has a slight decline, from 28% to 24%.
Samsung is in the lead in Russia, Xiaomi is already ahead of the neighbors.

In the US, there is a noticeable difference: a large lead over Apple, a noticeable share of Samsung, then LG, Motorola, Google, Huawei.

Obviously, geo applications are important.
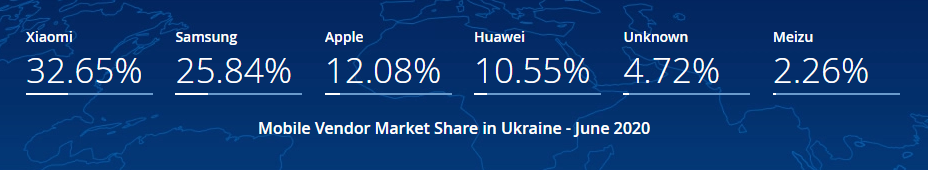
We (conditionally) choose devices for the Russian-language application for three countries: Russia (~ 2/3 of the audience), Ukraine, Belarus.
Samsung and Xiaomi are included as mandatory.
Huawei stubbornly does not give up, discuss with the team if you support (if not in the subject, google "Huawei support for Google Play"). Honor also goes here , in fact it is the same Huawei with marketing to a youth audience.
Additionally, we will fix Lenovo, LG, Sony, Nokia... They have approximately equal shares, most likely they will not get into the first sample of devices, but some of the moments described above in paragraphs 1-3 may play.
As a visual illustration, three diagrams (Yandex.Metrica) on mobile traffic for six months on three Russian-language sites with different target audience.
The main four have definitely noticeable coverage everywhere: Apply, Samsung, Xiaomi, Huawei .
But the fifth player already depends on the target audience, for all three it is different: Sony, LG, Lenovo

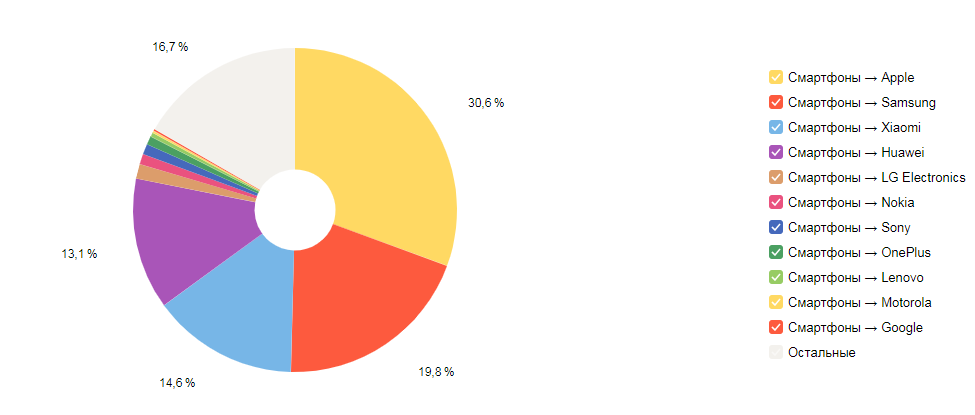
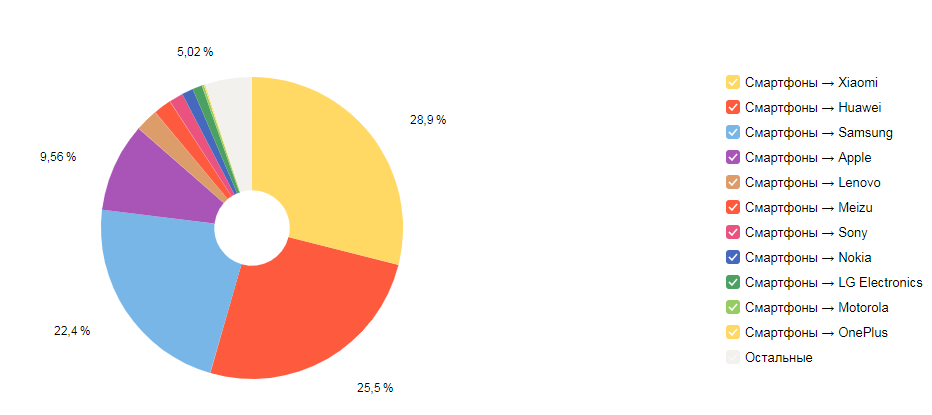
At the same time, the fifth variant of the manufacturer is so insignificant everywhere that on the "average for the ward", with a limited budget and man-hours for testing, it can be left for later.
Screen aspect ratio... An important parameter, which is sometimes forgotten, being tied by old memory, first of all, to the screen resolution, where the variety is already off scale (Android).
In this case, it is imperative to check. There are many bugs on the GUI, and it is not uncommon when a button that has become "not there" can eventually lead to a crit, blocking the ability to use the application's functionality.
Please note that in the column the first three values are for tablets, then for smartphones.
When choosing settings for a smartphone, try to capture both values closer to the edge (of the ones used) and the average. The table contains aspect ratios that are relevant for the middle of 2020.
Today, Sony is releasing new smartphones with elongated 21: 9 screens, while this is an extreme value, but there is already talk about 23: 9 ...
Size... We have three blocks in this column.
To begin with, we marked the "Tablet" here with a question (we will discuss later).
Then there are separate options for Android and iOS, tk. they have a slightly different approach and designation.
Price segment . You can write down specific numbers. The segment above $ 500 is usually considered premium, taking into account the current prices, you can already add a premium + for devices more expensive than $ 1000.
The basic segment is $ 300- $ 500, the budget segment is $ 150-300, what is cheaper is from the lower price segment.
Novelty... For +++ we take modern devices that have just entered the market, or those expected at the time of budget approval and purchase, or devices that have been released this year. Take Apple as an example. The premium iPhone 12 in all versions and the base iPhone SE (2020) will fall into this category.
++ are devices of the past (2019) year - iPhone 11 in all 3 modifications. One plus for devices of the previous three years (2016-2018) is from seven to ten. We will refer to the minus what is younger. Yes, the 6s released six years ago are still alive and fully usable. Here are usage statistics from DavidSmith .

Binding by years depends on a specific manufacturer and device support for new technologies. Not every device that entered the market this year can get +++.
The breakdown by model / year is convenient to look at DeviceSpecifications .
But we have already run a little ahead. We'll talk about specific models in the second part.
Additionally . In the example, this column will be empty, I drew it so that you do not forget what was in the third paragraph, it is quite possible that the application under test has special requests.
Features . On iOS, there may be some nuances of the native "Back" for models with a monobrow / bang, although it is physically located in the status bar area. Any application with landscape orientation and full use of the screen (for example, a player) is also advisable to look at models with an eyebrow. If the application uses a camera, be sure to check on the front one, but this item will go to the "Advanced" column.
Please note that the list includes devices both with the absence of hardware buttons on the front panel and with the presence. For iOS, this is the Home button, for Android there are three touchscreens: Back, Home, Menu.
If you have not a web, but an application that is not designed for the premium segment, and even with data recording to the device, working with an SD card sometimes raises questions, we include it in the list.
The template table can be considered ready.
Only unlike the choice of the environment for the desktop (OS, browsers), it cannot be run through pairwise .
But before moving on to choosing specific devices, let's remove the question mark from one important point.
Tablets
We discuss with the team. Perhaps you have a native application that does not support this type of device at all, then we delete all the "extra" in the table and move on.
Or your application actively supports work on a tablet, and then tablets are definitely needed.
In the average scenario, you will have to decide. If you're on a budget, it's better to take multiple smartphones than a tablet. But if your audience uses tablets, at least one tablet is highly desirable. The differences between two different smartphones and between a smartphone and a tablet are significantly greater and the likelihood of catching bugs is higher. Although, most likely, this will not be a functional, but a gone layout, which for a small startup without huge ambitions can still be closed (while remembering that the image is also important). The choice is not easy.
It’s bad that if you don’t have your own statistics, there’s nowhere to spy on tablets, especially regarding the Russian Federation. Around the
world, here are fresh beautiful numbers from Statista , the percentage of having a tablet by country. If you work for their market, you probably can't do without a tablet.

In Russia, a month ago I would confidently send you to the Top sites of Yandex.Radar. There was an unobvious, but quite informative opportunity to calculate the percentage of tablets for specific sites with similar topics (they were searched for by key ones). And the results were sometimes unexpected.
However, the project was closed in June.
If anyone knows a worthy replacement - tell me in the comments.
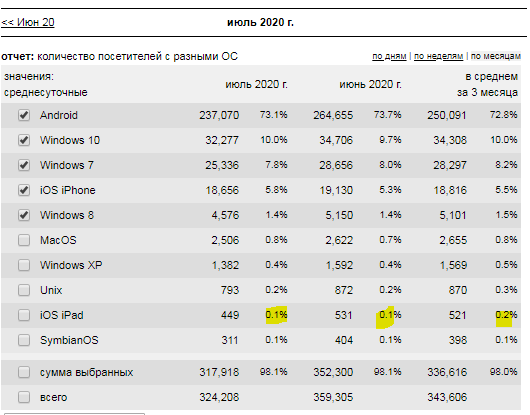
For my part, now I can only offer LiveInternet... The statistics system comes from the 2000s, there you will be greeted by such a rudiment as "statistics on the PDA", but there are still a lot of live sites that either left these statistics or preferred it for "lightness". Some information can be found, just do not forget to check whether the patient is alive if you look at the site statistics, not the group. Well, take into account that abandoned projects introduce some distortions in group statistics, but rather in the direction of reducing mobile traffic and using tablets.
No, unlike Radar, there is no specific choice of "tablets". But there is an OS and this makes it possible to see the percentage of using the iOS iPad.
At the same time, we know that iPad is the clear leader among tablets.
According to StatcounterApple has 58% in the world, 50 in Russia, 40 in Ukraine and Belarus.
According to Statista, for the first half of 2020, 29.8% of all tablets are used globally.

Those. we need to multiply the figure from the statistics by either 2 or 3 in order to estimate all tablet traffic.
Let's first look at the mp3 group - only 0.1%. As expected, there is nothing to do with the tablet.
Now let's look at Home and Family - already 1.1%.
Let's go to the section Literature - expected growth, 1.6%.
Let's check on live sites, for example, the statistics of "Lib.ru: Classic" is open - an average of 2.2% on weekends is more than 3, and these are not all tablets, but only the iPad.

Analyze your topic.
Just don't forget that we are looking at site statistics, it is far from always possible to project it onto an application. Let 's say here we see only 0.1%. Going to the site, firstly, we notice the buttons for installing applications, and secondly, copyright 2015. Application on the Play Store - more than 5 million installations, on the App Store- 38th in category, supports iPad and was once popular. And according to the statistics of one of this site, one could make the verdict "the tablet is not needed."
Please note that it is important not to look at today, but to choose a period of a month, a quarter, six months, because with small numbers, the sample is not representative.
I write in detail in order to emphasize once again: if you do not have either your own statistics or the amount of data sufficient for analysis, you should always look, think, analyze, using external statistics only as a hint.
This is the end of the first part. In the second, we will prepare another table, this time directly with applicants for the purchase and a few links: what else to read.
Svetlana Skrebneva
upd:
Choosing Mobile Devices: A Step-by-Step Guide for QA Beginners. Part II