Characteristics of the considered class of data analysis problems
It is necessary to investigate a multidimensional time series under the following conditions:
- The complexity of the registered process and (or) the uniqueness of the research tasks do not allow to reduce the work to the use of a ready-made algorithm. It becomes necessary to divide the process into stages and to analyze the complex dynamics within each of them. The criteria for delimiting the stages are not so obvious that they can be applied without data visualization.
- The parameters are of different physical nature and are measured in different units. Each time series curve needs its own ordinate scale.
Features of work from the point of view of the data visualization environment
Dividing a time series into stages can be trivial or quite complex. There are cases where the boundaries of the process steps can be determined, for example, by the value of the status variable. Such a task can be solved without visualization, for example, using data filters in MS Excel .
The identification of boundaries in more complex cases is associated with a visual search on the graphs for more or less objective signs of the transition of the system to a new state. At the same time, the choice of criteria may require a specialist to understand the subject area and perform additional calculations.
It is worth noting that even with the simplest division of the time series into stages, a preliminary acquaintance with the graphs has a practical meaning. At a minimum, this action allows you to verify that there are no obvious defects in the recording before starting work.
We will not even touch on the superficially the methods used to analyze the dynamics of the process within the boundaries of a separate stage. It is important that for many problems the analysis requires further division of the series and consideration of smaller time intervals within the main stages. In addition, the time intervals of the transitions between stages may be of interest.
Thus, when solving problems of the class under consideration, it is usually required to change the time interval on the graphs many times (the count can go up to hundreds). The quality of the implementation of this action in the user interface of the data processing environment significantly affects the efficiency of work.
Existing systems
MS Excel allows you to build a multidimensional time series with two scales along the ordinate axis ("auxiliary axis"). At the same time, changing the left and right boundaries on the abscissa axis is performed by an impressive set of actions, including entering numbers from the keyboard.

After confirming the changes, none of the ordinate scales change their settings. For the changed time interval, the previous scales on the ordinate axis are often not satisfactory. In our example, additional vertical scaling is required for more visualization.

Such a user interface can hardly be called optimal for the tasks under consideration.
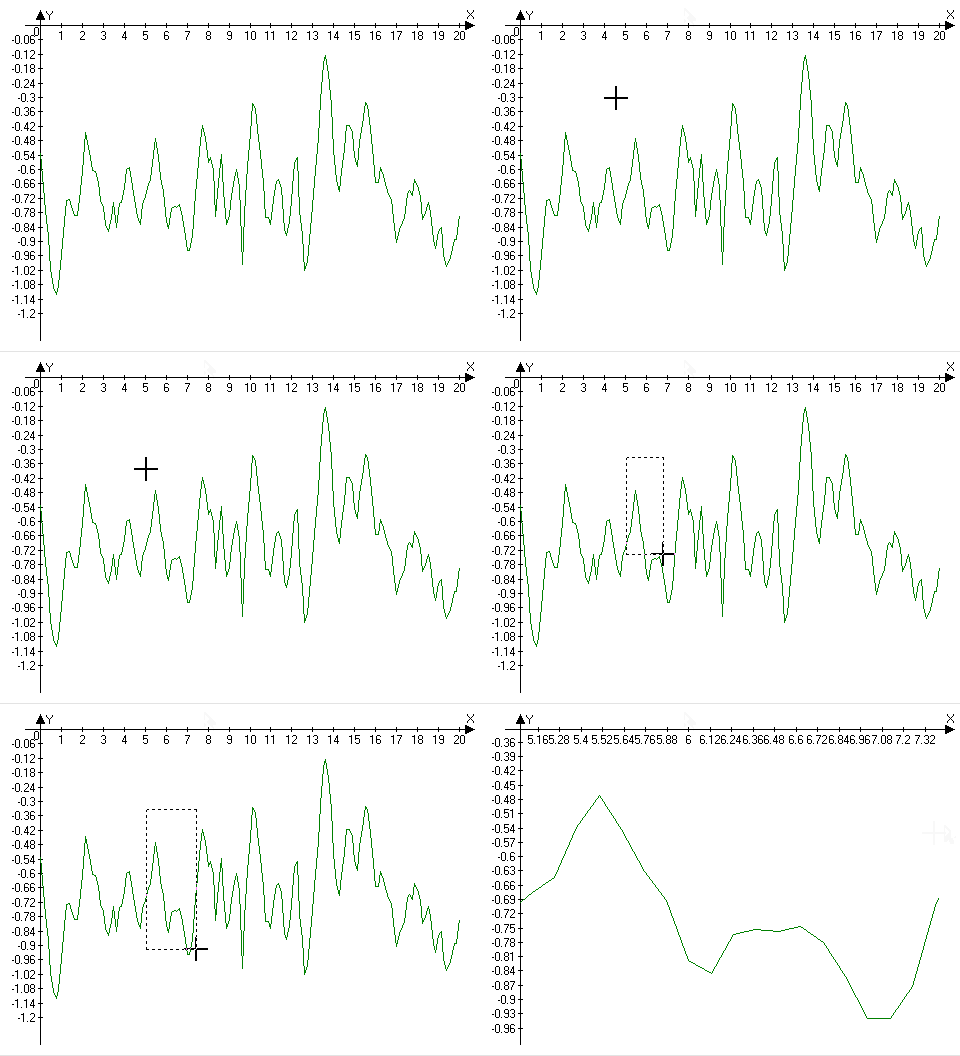
Significantly more effective user experience is built through the implementation of the WYSIWYG principlein working with the construction area. The following animation shows user interaction with such an interface.

An example is written in the Advanced Grapher application , but many other systems support a similar option, for example, the MetricsGraphics.js library .
The speed gain compared to MS Excel is obvious here. The whole scaling task is solved in one click:
- the left mouse button is pressed at the point corresponding to the corner of the new rectangular area;
- the cursor is moved to the opposite corner of the new area;
- the left mouse button is released.

But this option is not without its drawbacks. The first is the extra burden placed on the user. With one combined action, he is asked to enter the values of four parameters (coordinates of the boundaries of the rectangular area tmin , tmax , Pmin , Pmax ), which requires their preliminary assessment “in the mind”. With experience, the task has acceptable difficulty. Nevertheless, since the user is primarily interested in the time interval, tmin and tmax , it makes sense to work out the transfer of vertical scaling to the machine.
The second disadvantage is also related to vertical scaling. It consists in the impossibility of implementing this interface for the tasks of the class under consideration. The problem is that with a single click in our case, the user enters not 4, but 6, 8 or more values, depending on the number of scales on the ordinate. Each scale of the ordinate on the graph receives new values for the upper and lower boundaries, but in fact all these boundaries, no matter how many of them, are determined by two numbers. These numbers are the ordinates of the mouse cursor position at the beginning and end of the click. The user's task is not only more complicated in comparison with the case of a one-dimensional series. It also ceases to be solvable: the general interval that provides an acceptable scale for each row does not always exist.
For example, the figure shows one of the practical results of such scaling.

Both lines represent harmonic oscillations, three periods each in the considered time interval. This can be determined visually only after additional individual adjustment of the scales, since the vibration amplitudes are negligible in comparison with the intervals of both scales. Further reduction of the displayed intervals by the considered method will lead to the displacement of one of the curves outside the plotting area.
Refinement of the user interface
As noted above, the vertical scaling task should be assigned to a computer. To do this, consider how the user solves it using the example of a one-dimensional series.
As a rule, having decided on a time interval, the user determines local extrema in order to best represent the range of values. The optimal solution for most cases is to combine the range of values and the displayed scale interval (algorithms with more subtle logic are also possible, when the displayed area has a small margin above and below the range of values; the differences between these algorithms are not fundamental).
The above logic has a fairly simple implementation. The interface scheme for a one-dimensional time series is shown in the figure.

The vertical coordinate of the click does not matter here: the combined control action of the user defines only the left and right boundaries of the new display area.
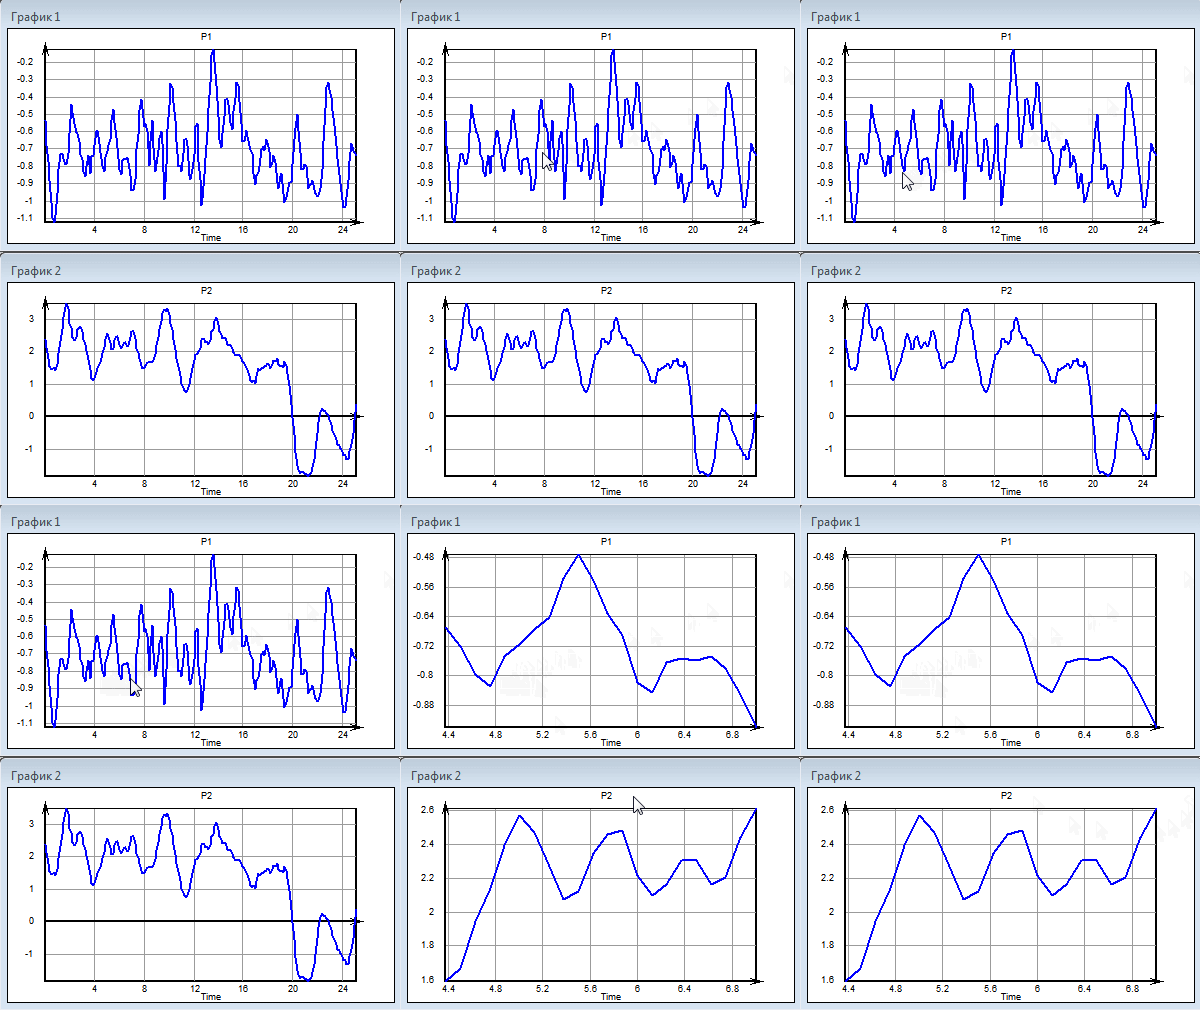
The scaling of a multidimensional series with a new user interface is demonstrated by the following animation.

The original data and new time interval in this example correspond to the example from the beginning of the article. The problem was solved by the simplest action with maximum quality. The decrease in the time required and the intellectual effort of the user seems obvious.
Limitation of applicability
Another approach to vertical scaling is also possible: in some practical problems, visualization is justified in a predetermined range of values, which does not depend on local extrema. In this case, it is enough not to change the vertical scale settings, as it is implemented in MS Excel .