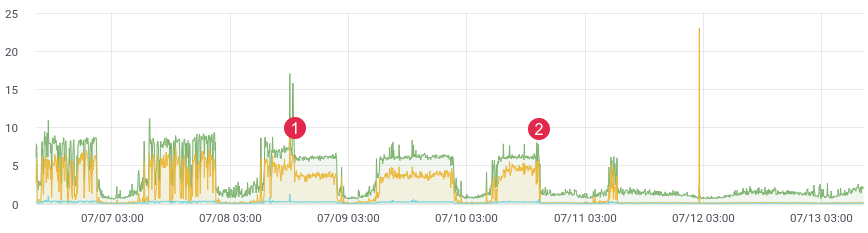
approx. latency / time.
Probably everyone faces the task of profiling code in production. Facebook's xhprof does this well. You profile, for example, 1/1000 requests and see the picture at the moment. After each release, the product comes running and says "it was better and faster before the release." You have no historical data and you cannot prove anything. What if you could?
Not so long ago, we rewrote a problematic part of the code and expected a strong performance gain. We wrote unit tests, did load testing, but how will the code behave under live load? After all, we know that load testing does not always display real data, and after deployment, you need to quickly get feedback from your code. If you are collecting data, then, after release, you only need 10-15 minutes to understand the situation in the combat environment.
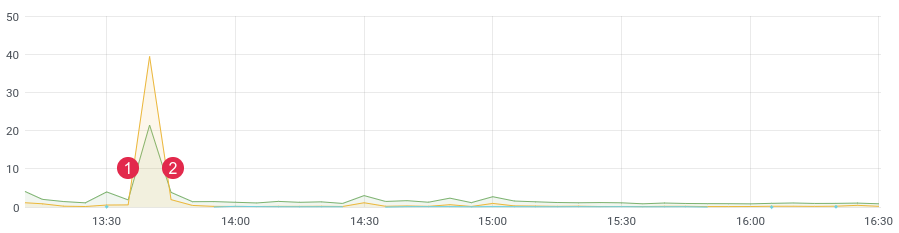
approx. latency / time. (1) deploy, (2) rollback
Stack
For our task, we took a columnar ClickHouse database (abbreviated kx). Speed, linear scalability, data compression, and no deadlock were the main reasons for this choice. Now it is one of the main bases in the project.
In the first version, we wrote messages to the queue, and as consumers we wrote them to ClickHouse. The delay reached 3-4 hours (yes, ClickHouse is slow to insert one by onerecords). Time passed and it was necessary to change something. There was no point in responding to notifications with such a delay. Then we wrote a crown command that selected the required number of messages from the queue and sent a batch to the database, then marked them processed in the queue. The first couple of months everything was fine, until problems started here. There were too many events, duplicate data began to appear in the database, queues were not used for their intended purpose (they became a database), and the crown command no longer coped with writing to ClickHouse. During this time, another couple of dozen tables were added to the project, which had to be written in batches in kx. Processing speed has dropped. The solution was as simple and fast as possible. This prompted us to write code with lists in redis. The idea is this: we write messages to the end of the list,With the crown command, we form a pack and send it to the queue. Then the consumers parse the queue and write a bunch of messages into the kx.
We have : ClickHouse, Redis and a queue (any - rabbitmq, kafka, beanstalkd ...)
Redis and lists
Until a certain time, Redis was used as a cache, but that is changing. The base has huge functionality, and for our task only 3 commands are needed : rpush , lrange and ltrim .
We will write data to the end of the list using the rpush command. In the crown command, read data using lrange and send to the queue, if we managed to send to the queue, then we need to delete the selected data using ltrim.
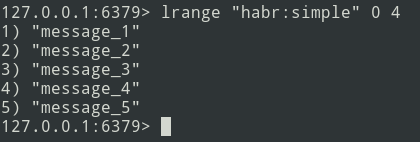
From theory to practice. Let's create a simple list.
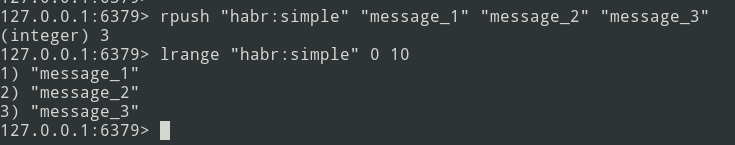
We have a list of three messages, let's add a little more ...
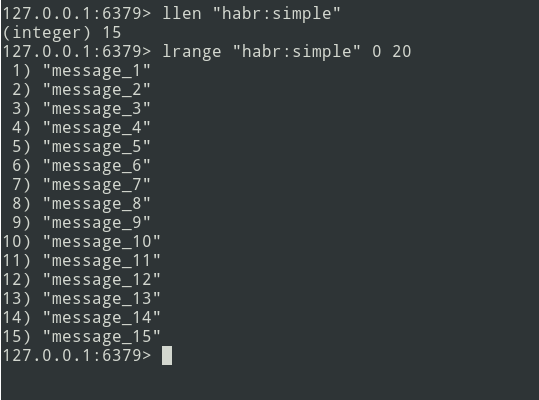
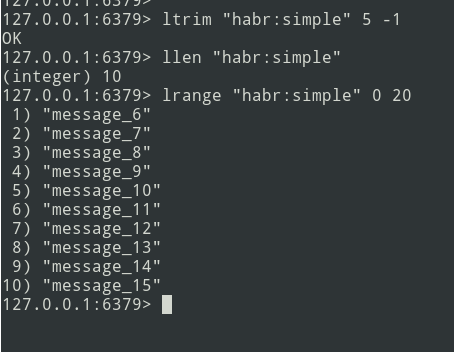
New messages are added to the end of the list. Using the lrange command, select the batch (let it be = 5 messages).
Next, we send the pack to the queue. Now you need to remove this bundle from Redis in order not to send it again.
There is an algorithm, let's get down to implementation.
Implementation
Let's start with the ClickHouse table. I didn't bother too much and defined everything in the String type .
create table profile_logs
(
    hostname   String, //  ,
    project    String, //
    version    String, //
    userId     Nullable(String),
    sessionId  Nullable(String),
    requestId  String, //
    requestIp  String, // ip
    eventName  String, //
    target     String, // URL
    latency    Float32, //   (latency=endTime - beginTime)
    memoryPeak Int32,
    date       Date,
    created    DateTime
)
    engine = MergeTree(date, (date, project, eventName), 8192);
The event will be like this:
{
  "hostname": "debian-fsn1-2",
  "project": "habr",
  "version": "7.19.1",
  "userId": null,
  "sessionId": "Vv6ahLm0ZMrpOIMCZeJKEU0CTukTGM3bz0XVrM70",
  "requestId": "9c73b19b973ca460",
  "requestIp": "46.229.168.146",
  "eventName": "app:init",
  "target": "/",
  "latency": 0.01384348869323730,
  "memoryPeak": 2097152,
  "date": "2020-07-13",
  "created": "2020-07-13 13:59:02"
}
The structure is defined. To calculate latency, we need a time period. We pinpoint using the microtime function :
$beginTime = microtime(true);
//
$latency = microtime(true) - $beginTime;
To simplify the implementation, we will use the laravel framework and the laravel-entry library . Add a model (table profile_logs):
class ProfileLog extends \Bavix\Entry\Models\Entry
{

    protected $fillable = [
        'hostname',
        'project',
        'version',
        'userId',
        'sessionId',
        'requestId',
        'requestIp',
        'eventName',
        'target',
        'latency',
        'memoryPeak',
        'date',
        'created',
    ];

    protected $casts = [
        'date' => 'date:Y-m-d',
        'created' => 'datetime:Y-m-d H:i:s',
    ];

}
Let's write a tick method (I made a ProfileLogService service ) that will write messages to Redis. We get the current time (our beginTime) and write it to the $ currentTime variable:
$currentTime = \microtime(true);If the tick for an event is called for the first time, then write it to the tick array and end the method:
 if (empty($this->ticks[$eventName])) {
    $this->ticks[$eventName] = $currentTime;
    return;
}
If the tick is called again, then we write the message to Redis using the rpush method:
$tickTime = $this->ticks[$eventName];
unset($this->ticks[$eventName]);
Redis::rpush('events:profile_logs', \json_encode([
    'hostname' => \gethostname(),
    'project' => 'habr',
    'version' => \app()->version(),
    'userId' => Auth::id(),
    'sessionId' => \session()->getId(),
    'requestId' => \bin2hex(\random_bytes(8)),
    'requestIp' => \request()->getClientIp(),
    'eventName' => $eventName,
    'target' => \request()->getRequestUri(),
    'latency' => $currentTime - $tickTime,
    'memoryPeak' => \memory_get_usage(true),
    'date' => $tickTime,
    'created' => $tickTime,
]));
The $ this-> ticks variable is not static. You need to register the service as a singleton.
$this->app->singleton(ProfileLogService::class);The batch size ( $ batchSize ) is configurable, it is recommended to specify a small value (for example, 10,000 items). If problems arise (for example, ClickHouse is not available), the queue will start to go to failed, and you need to debug the data.
Let's write a crown command:
$batchSize = 10000;
$key = 'events:profile_logs'
do {
    $bulkData = Redis::lrange($key, 0, \max($batchSize - 1, 0));
    $count = \count($bulkData);
    if ($count) {
        //     json,   decode
        foreach ($bulkData as $itemKey => $itemValue) {
            $bulkData[$itemKey] = \json_decode($itemValue, true);
        }

        //       ch
        \dispatch(new BulkWriter($bulkData));
        //    redis
        Redis::ltrim($key, $count, -1);
    }
} while ($count >= $batchSize);
You can immediately write data to ClickHouse, but the problem lies in the fact that kronor works in single-threaded mode. Therefore, we will go the other way - with the command we will form bundles and send them to the queue for subsequent multithreaded recording in ClickHouse. The number of consumers can be regulated - this will speed up the sending of messages.
Let's move on to writing a consumer:
class BulkWriter implements ShouldQueue
{
    use Dispatchable, InteractsWithQueue, Queueable, SerializesModels;

    protected $bulkData;

    public function __construct(array $bulkData)
    {
        $this->bulkData = $bulkData;
    }

    public function handle(): void
    {
            ProfileLog::insert($this->bulkData);
        }
    }
}
So, the formation of packs, sending to the queue and the consumer are developed - you can start profiling:
app(ProfileLogService::class)->tick('post::paginate');
$posts = Post::query()->paginate();
$response = view('posts', \compact('posts'));
app(ProfileLogService::class)->tick('post::paginate');
return $response;
If everything is done correctly, then the data should be in Redis. We will confuse the crown command and send the packs to the queue, and the consumer will insert them into the database.
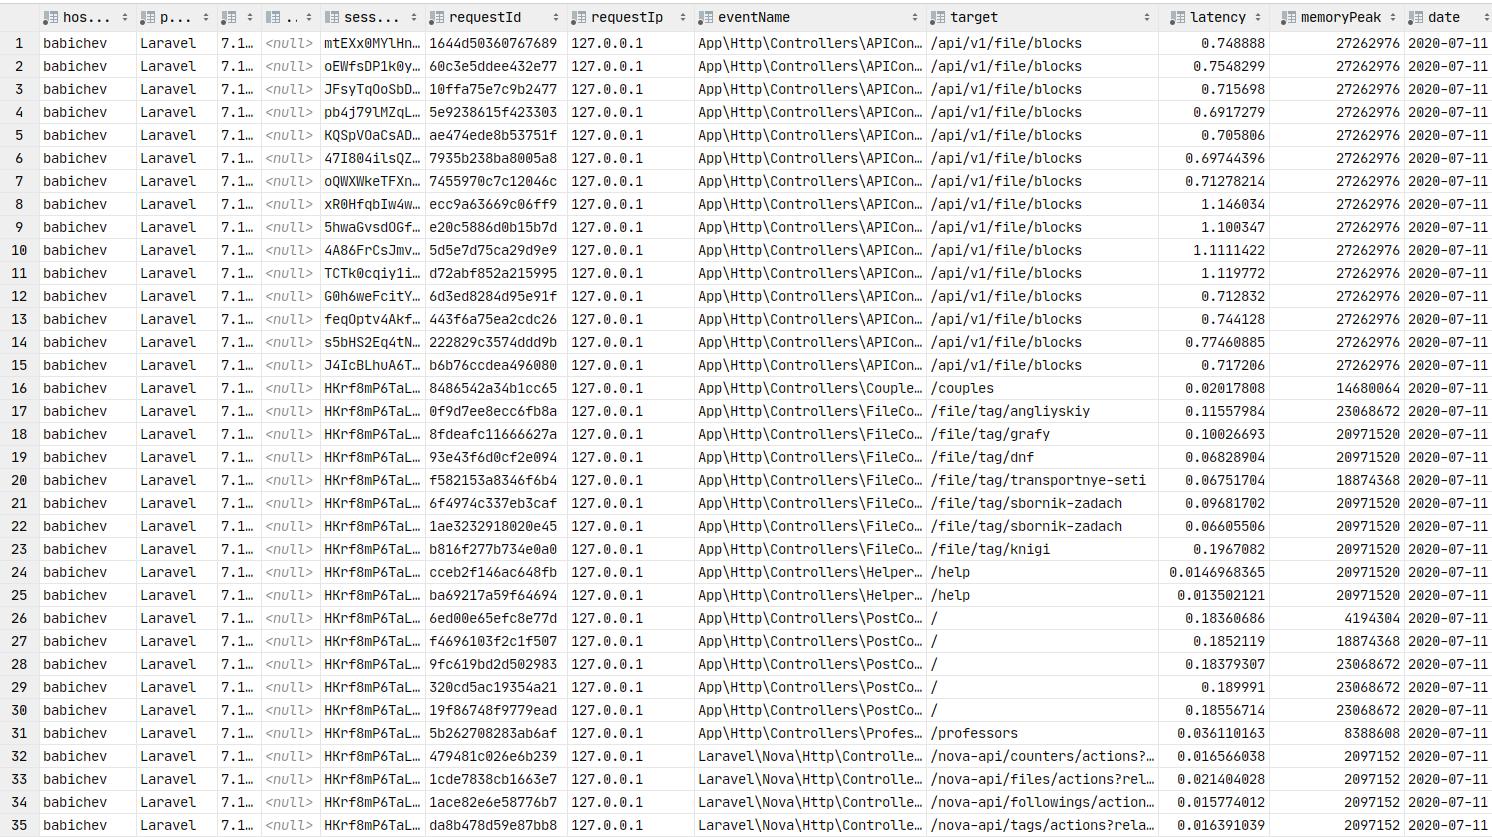
Data in the database. You can build graphs.
Grafana
Now let's move on to the graphical presentation of data, which is a key element of this article. You need to install grafana . Let's skip the installation process for debain-like assemblies, you can use the link to the documentation . Usually, the installation step boils down to apt install grafana .
On ArchLinux, the installation looks like this:
yaourt -S grafana
sudo systemctl start grafana
The service has started. URL: http: // localhost: 3000
Now you need to install ClickHouse datasource plugin :
sudo grafana-cli plugins install vertamedia-clickhouse-datasourceIf you have installed grafana 7+, then ClickHouse will not work. You need to make changes to the configuration:
sudo vi /etc/grafana.iniLet's find the line:
;allow_loading_unsigned_plugins =Let's replace it with this one:
allow_loading_unsigned_plugins=vertamedia-clickhouse-datasourceLet's save and restart the service:
sudo systemctl restart grafanaDone. Now we can go to grafana .
Login: admin / password: admin by default.

After successful authorization, click on the gear. In the popup window that opens, select Data Sources, add a connection to ClickHouse.
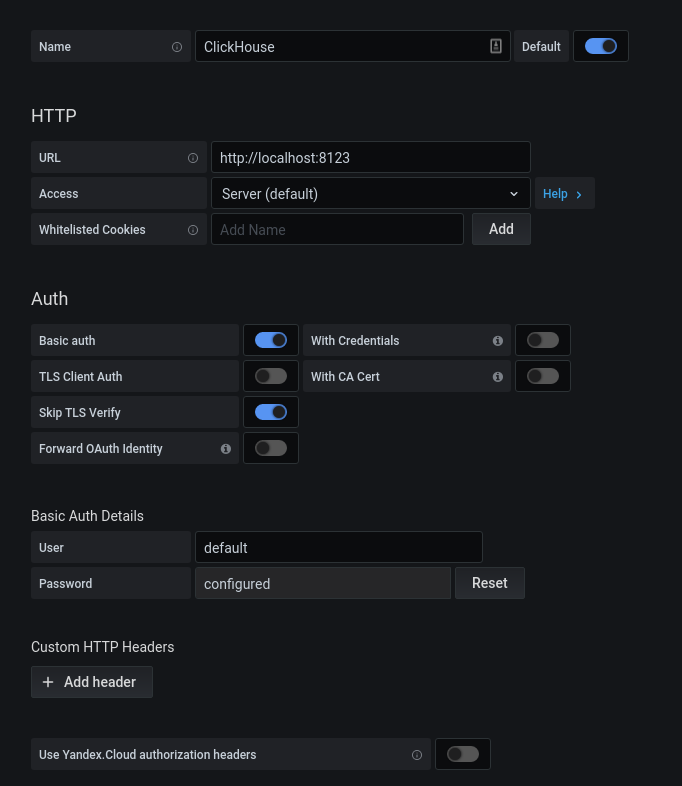
We fill in the configuration kx. Click on the "Save & Test" button, we get a message about a successful connection.
Now let's add a new dashboard:
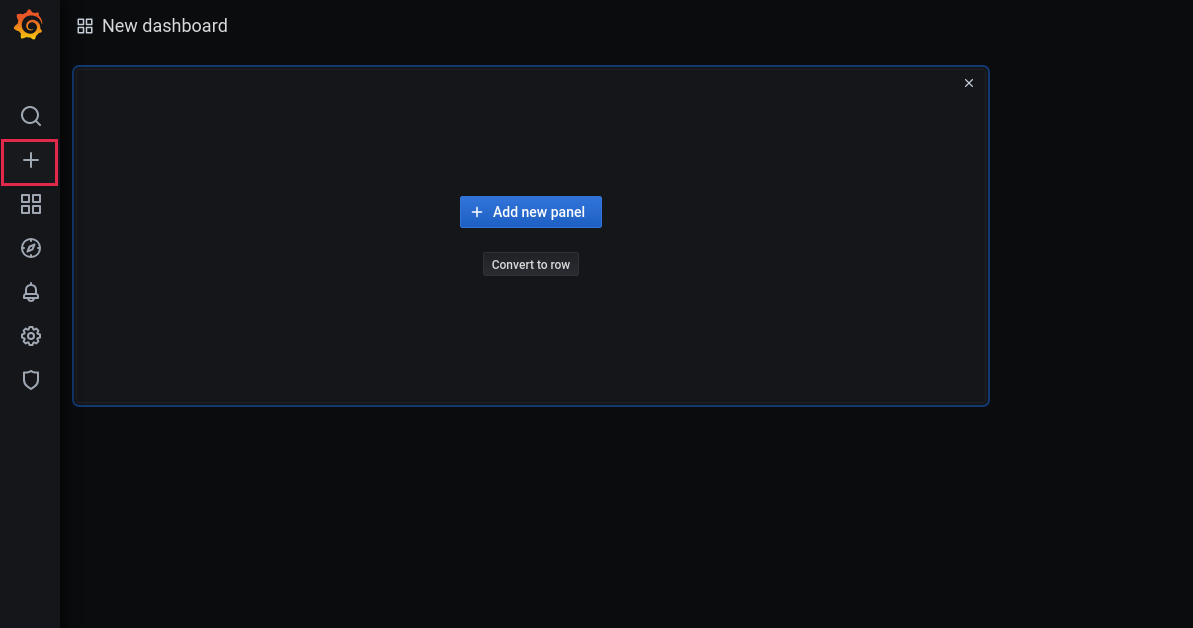
Add a panel:

Select the base and the corresponding columns for working with dates:
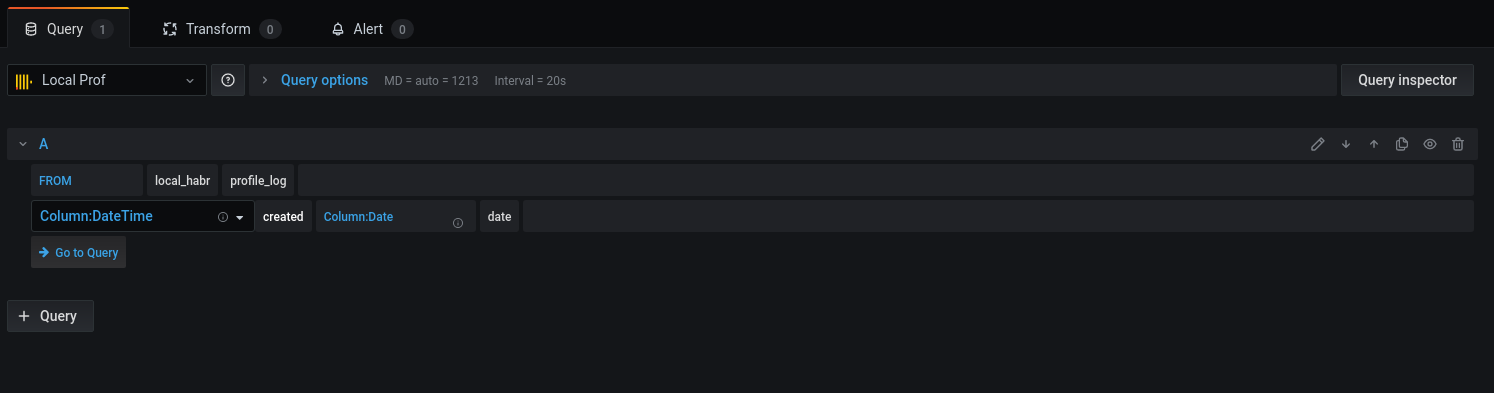
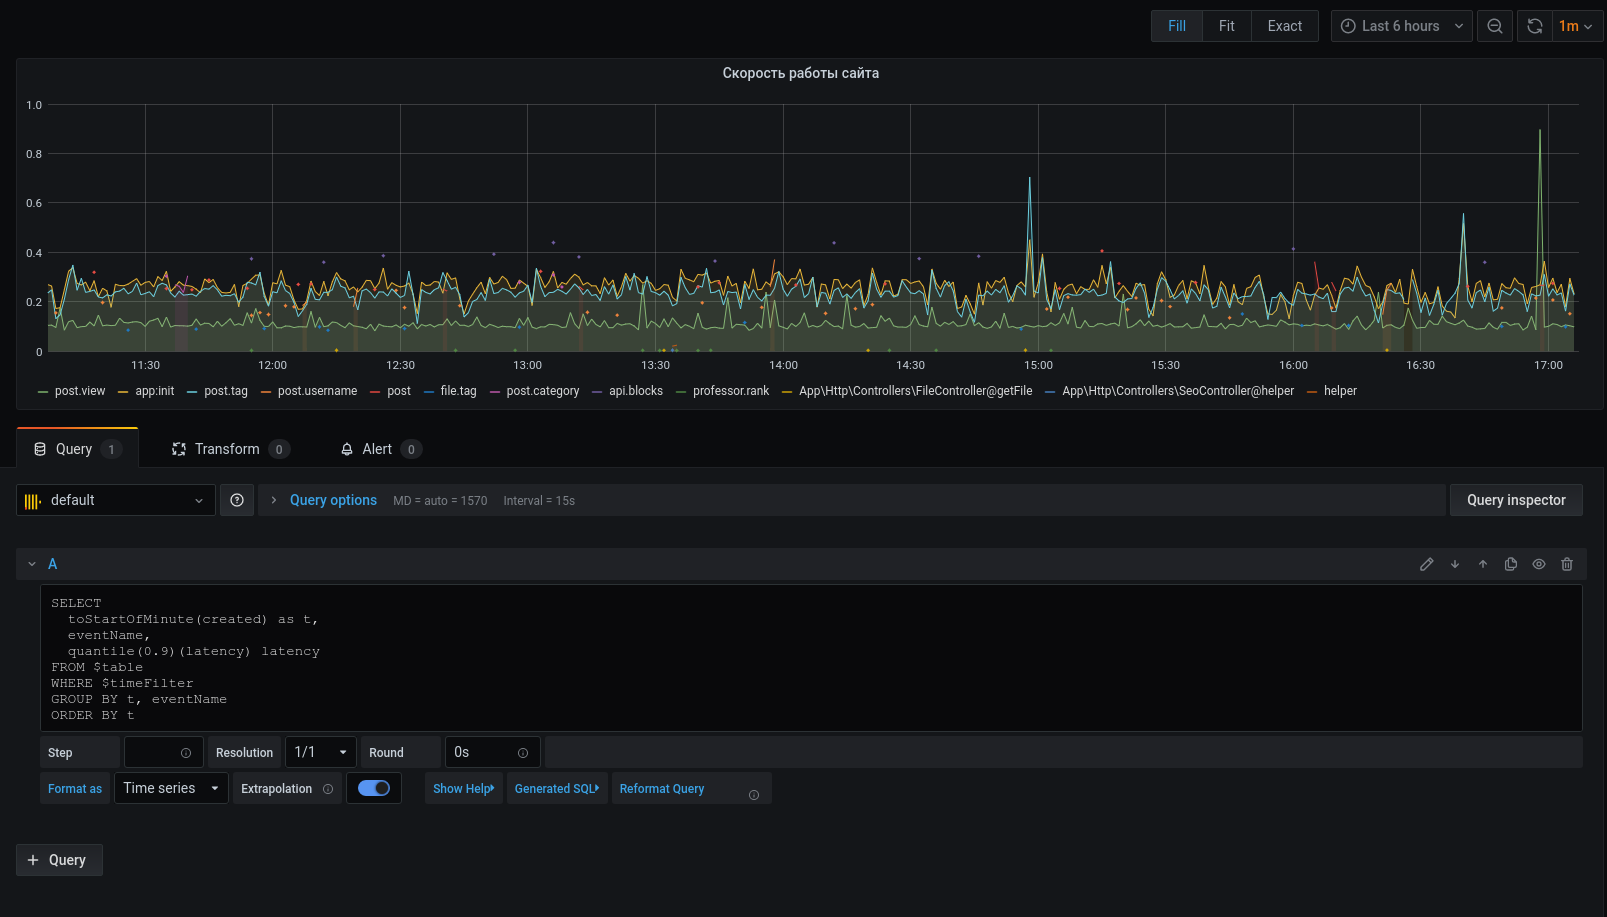
Let's move on to the query:
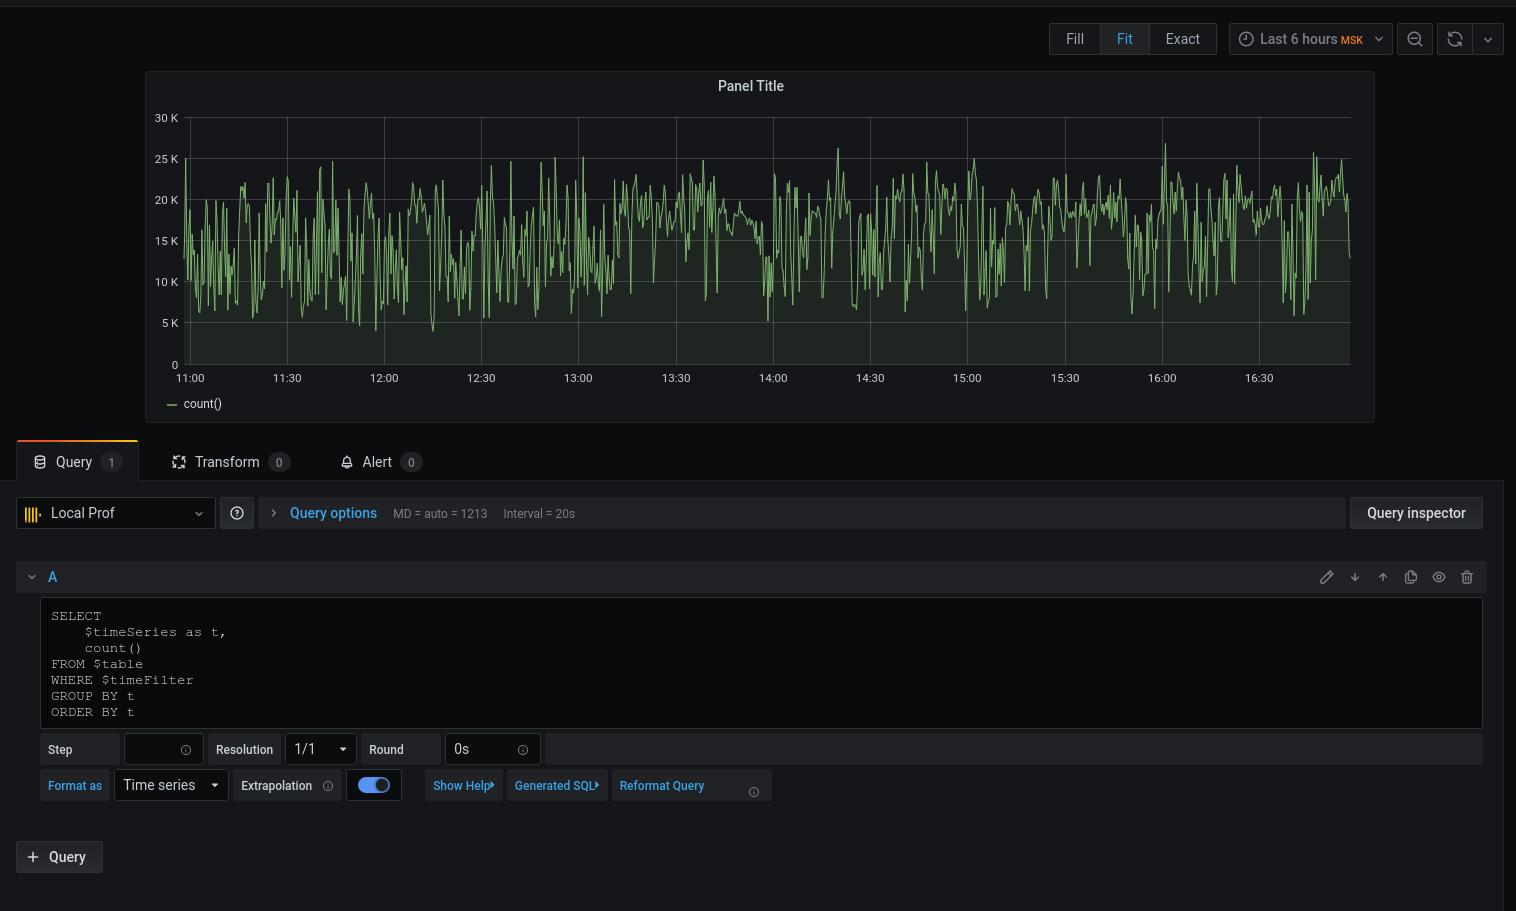
We got a graph, but I want specifics. Let's print the average latency rounding the date-with-time down to the beginning of the five-minute interval :
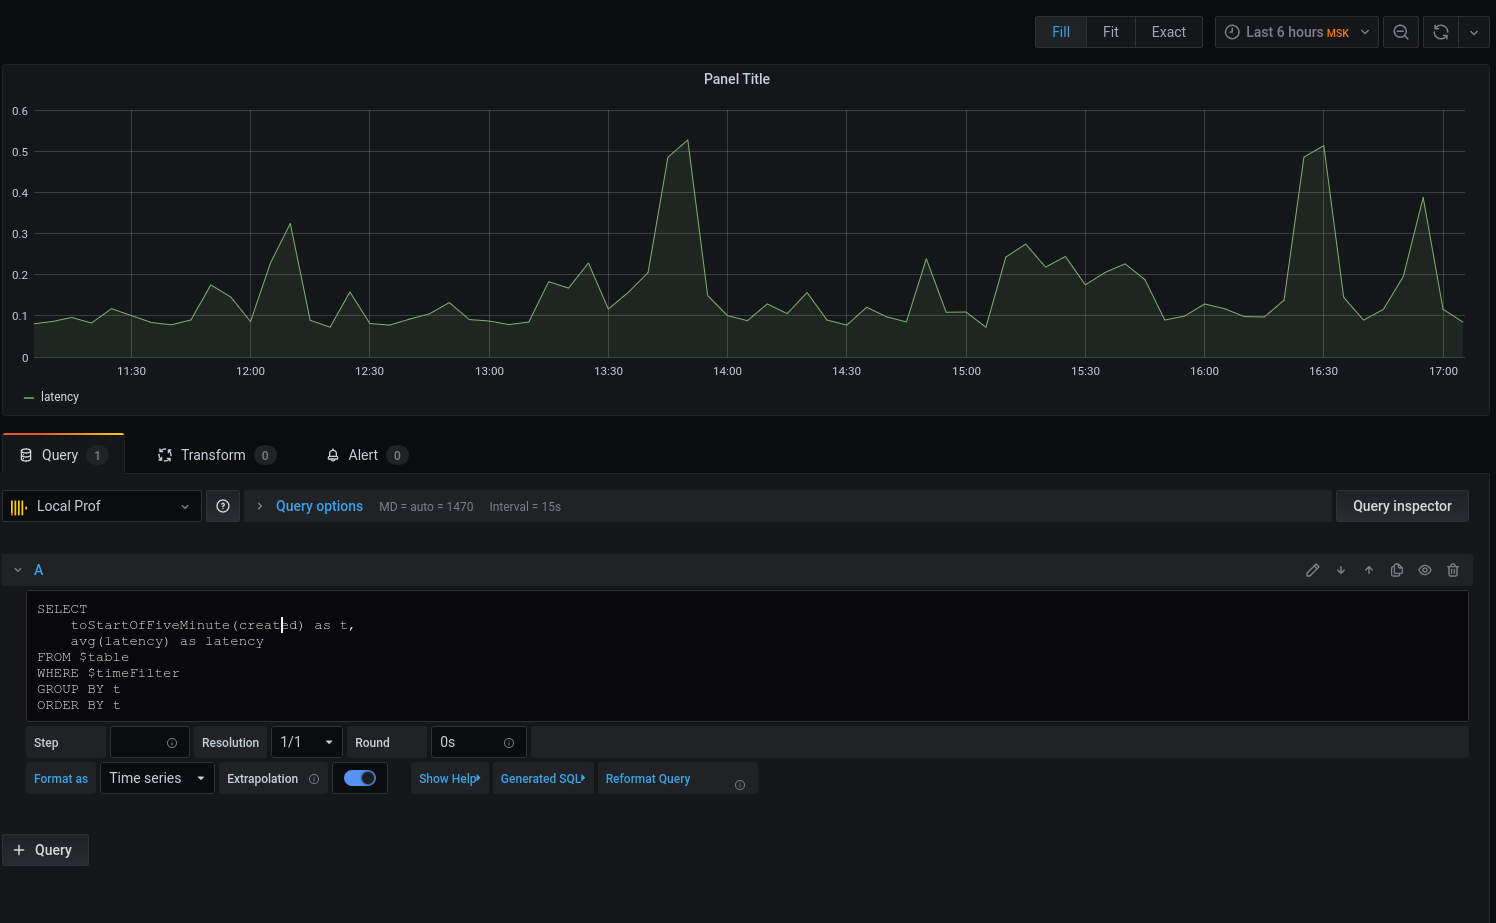
Now the selected data is displayed on the chart, we can focus on them. Configure triggers for alerts, group by events, and more.
The profiler is by no means a replacement for the tools: xhprof (facebook) , xhprof (tideways) , liveprof from (Badoo) . And only complements them.
All source code is on github - profiler model , service , BulkWriteCommand , BulkWriterJob and middleware ( 1 , 2 ).
Installing the package:
composer req bavix/laravel-profSetting up connections (config / database.php), add clickhouse:
'bavix::clickhouse' => [
    'driver' => 'bavix::clickhouse',
    'host' => env('CH_HOST'),
    'port' => env('CH_PORT'),
    'database' => env('CH_DATABASE'),
    'username' => env('CH_USERNAME'),
    'password' => env('CH_PASSWORD'),
],
Beginning of work:
use Bavix\Prof\Services\ProfileLogService;
// ...
app(ProfileLogService::class)->tick('event-name');
//
app(ProfileLogService::class)->tick('event-name');
To send a batch to the queue, you need to add a command to cron:
* * * * * php /var/www/site.com/artisan entry:bulkYou also need to run a consumer:
php artisan queue:work --sleep=3 --tries=3It is recommended to configure supervisor . Config (5 consumers):
[program:bulk_write]
process_name=%(program_name)s_%(process_num)02d
command=php /var/www/site.com/artisan queue:work --sleep=3 --tries=3
autostart=true
autorestart=true
user=www-data
numprocs=5
redirect_stderr=true
stopwaitsecs=3600
UPD:
1. ClickHouse can natively pull data from the kafka queue . Thanks,sdm