Rapid analytical data processing is often required. Often, users upload data to Excel and then create a PivotTable. the whole construction process does not require programming skills, but is built in the wizard with a few clicks of the mouse button. But this has one significant drawback: before generating a report, you need to export data every time, and this takes some time and it is difficult to call this analysis operational.
If your database is stored in MS SQL or can be specified through connected servers and there is no tool for building OLAP reports, then you can use the Client Communicator platform, through the use of views (single user version is free). To do this, you need to compose an SQL query and write it in the Designer in the Views section.
In this article, I will consider building a report based on data stored in the Klik database. Based on the presentation, the report is built in the same way, only you will need to select not a table, but a presentation.
Let's consider the following task as an example: to analyze the fullness of the counterparties' details:
- INN,
- main activity,
- main legal entity,
- phone,
- e-mail,
- The contact person.
The analysis should be broken down by the curator, state, type, balance, region.
All necessary data for the task is stored in one table. But it is possible to build a report on several tables connected to the main one by forward and backward links. The client part has an OLAP Report Builder, any user can independently create and save their reports. I will consider building a report in the designer, which differs from the custom one only in that it can be displayed in the main menu of the program.
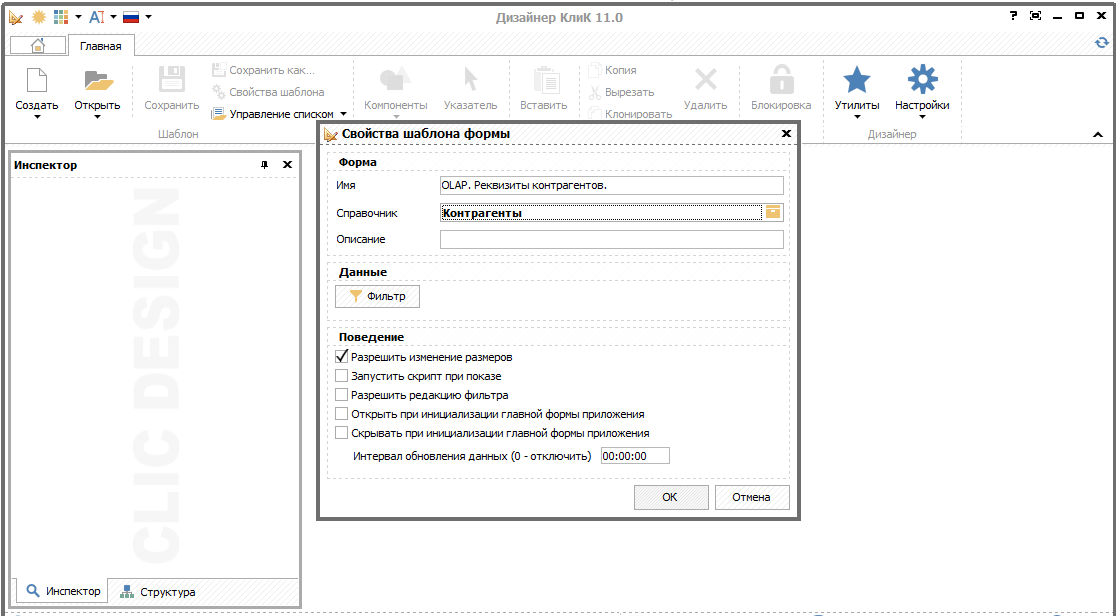
Step 1. Create a form template in the "Designer" module. Set the name of the form and select the main table.
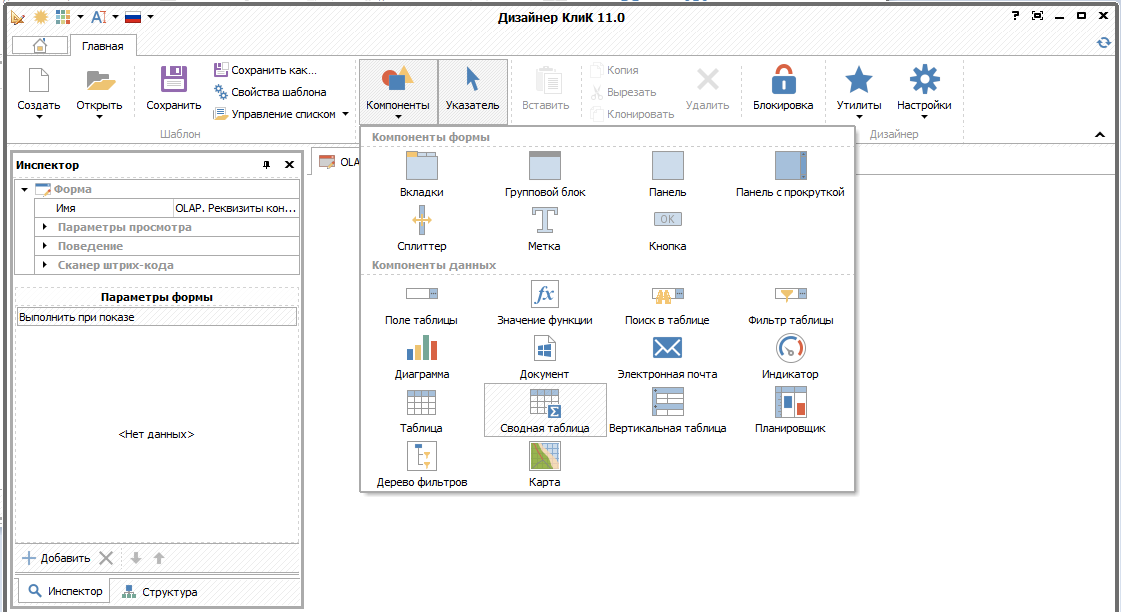
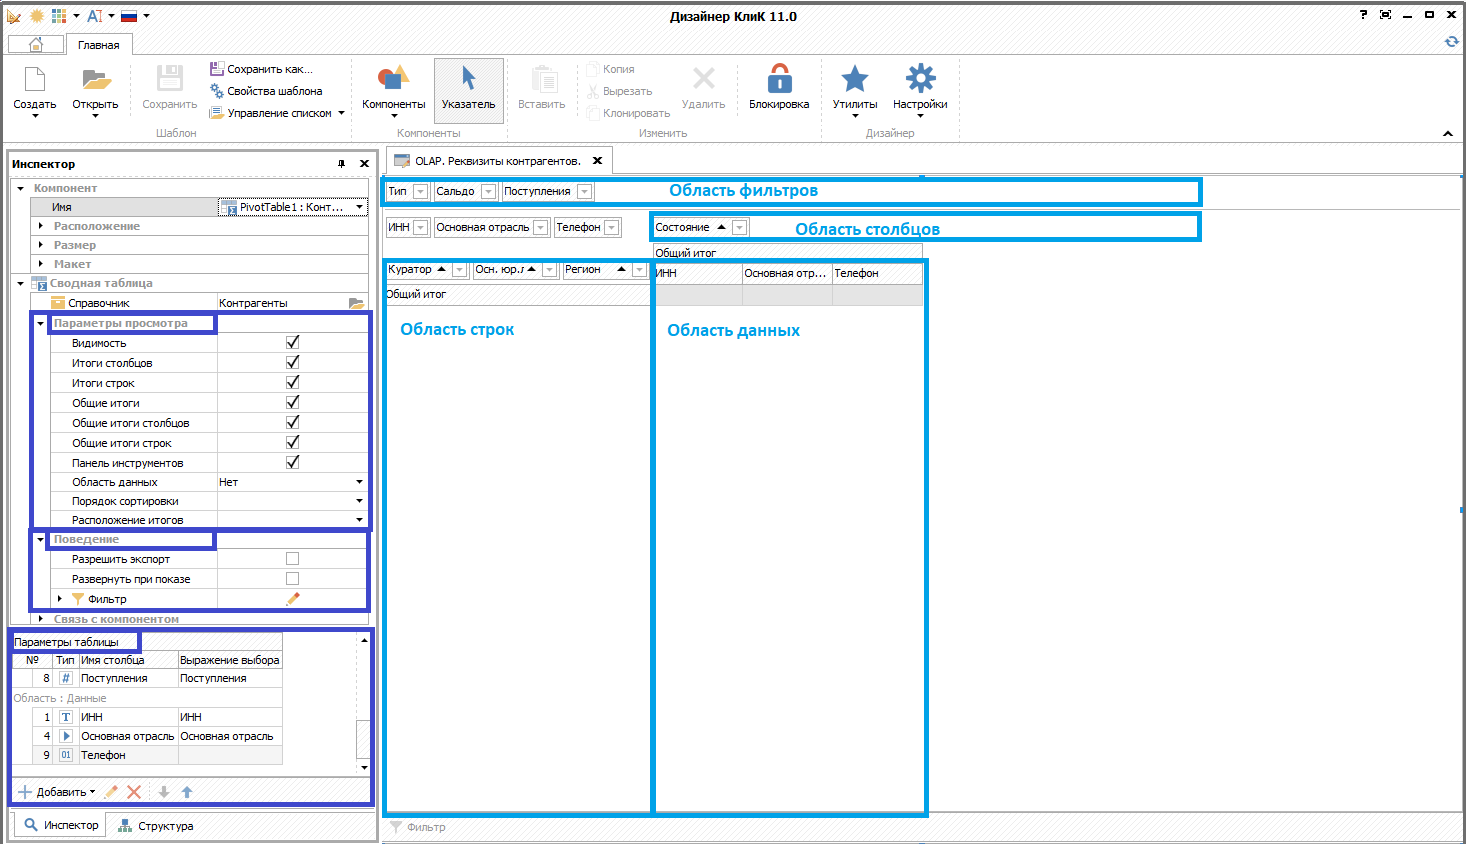
Step 2. Add the PivotTable component to the form. Set the component alignment "Whole client" (or any other of your choice).
Step 3. Set table parameters.
There are 4 types of attribute placement area:
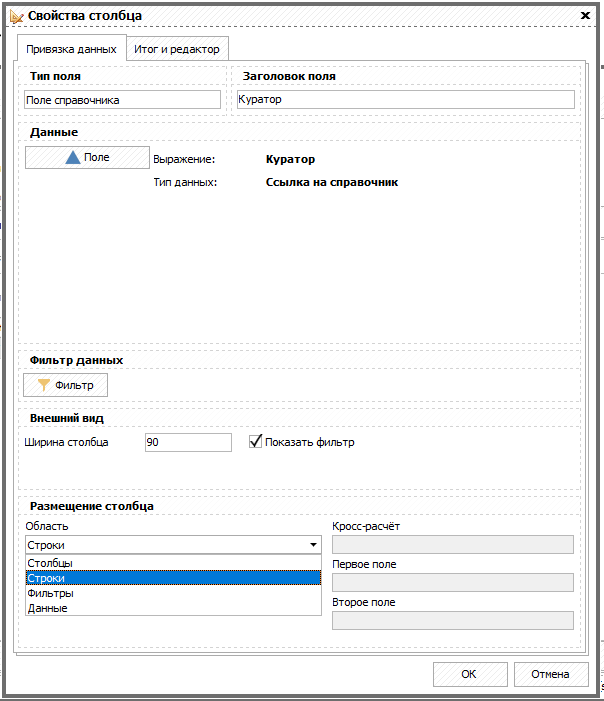
- lines - position on the left as a list, there may be several drop-down lists;
- columns - placement horizontally on top of the list, several levels are possible;
- filters - top left horizontally;
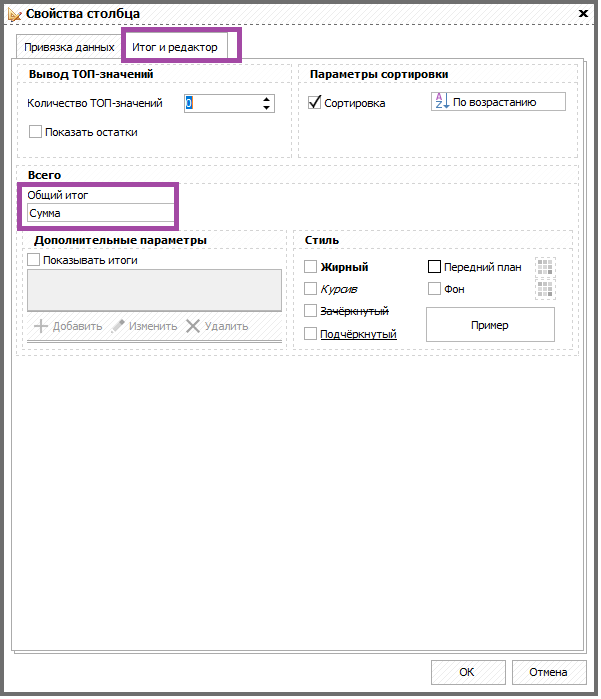
- data - the main part with aggregated data, it is imperative to specify how to calculate the grand total: quantity, minimum, maximum, amount, average. As a rule, for calculating data, numeric fields are used that can be added. For string variables, you can only use the Count aggregate function. In the example, I demonstrate how to use a calculated expression using the SQL CASE function.

Step 4. Set the viewing and behavior parameters.
Step 5. Display the form in the program menu (in the Administrator module).
Result:
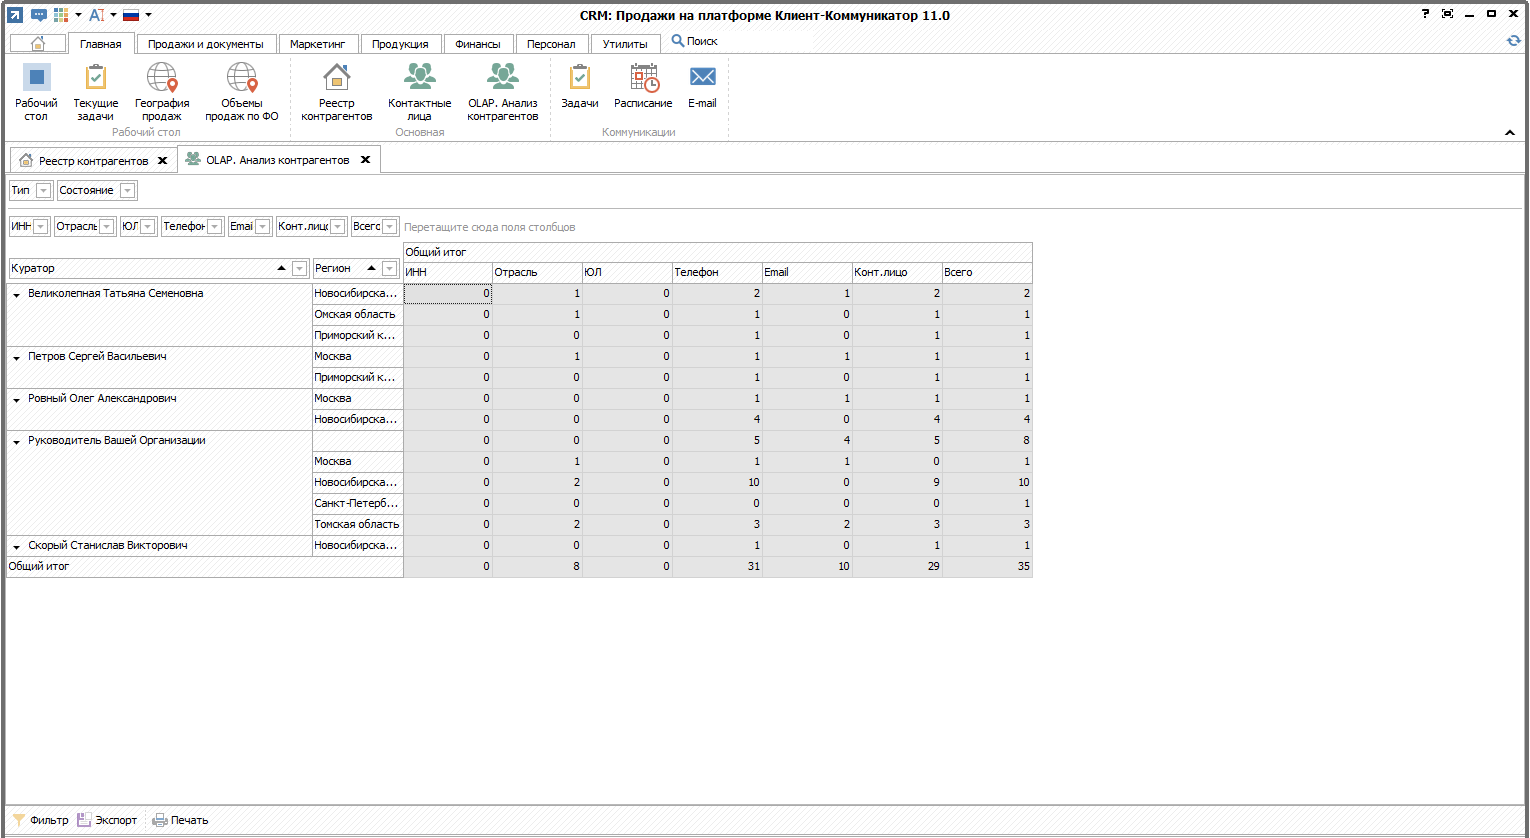
Attributes can be moved between the row, column and filter areas with the mouse, thereby obtaining different slices. It is possible to export the result to a file. I will publish later on my youtube channel how to display the transcript of the report line.
For more details, see the video .