I believe that almost every project that uses Ruby on Rails and Postgres as the main weapon on the backend is in a permanent struggle between the speed of development, readability / maintainability of the code and the speed of the project in production. I will tell you about my experience of balancing between these three whales in a case where readability and speed of work suffered at the entrance, and at the end it turned out to do what several talented engineers tried to do before me unsuccessfully.

The whole story will take several parts. This is the first one where I will talk about what PMDSC is for optimizing SQL queries, share useful tools for measuring query performance in postgres, and remind me of one useful old cheat sheet that is still relevant.
Now, after some time, “in hindsight” I understand that at the entrance to this case I did not expect at all that I would succeed. Therefore, this post will be useful rather for daring and not the most experienced developers than for super-seniors who have seen rails with bare SQL.
Input data
We at Appbooster are promoting mobile apps. To easily put forward and test hypotheses, we develop several of our applications. The backend for most of them is the Rails API and Postgresql.
The hero of this publication has been under development since the end of 2013 - then rails 4.1.0.beta1 had just been released. Since then, the project has grown into a fully loaded web application that runs on multiple servers in Amazon EC2 with a separate database instance in Amazon RDS (db.t3.xlarge with 4 vCPUs and 16 GB RAM). Peak loads reach 25k RPM, average day load 8-10k RPM.
This story began with a database instance, or rather, with its credit balance.
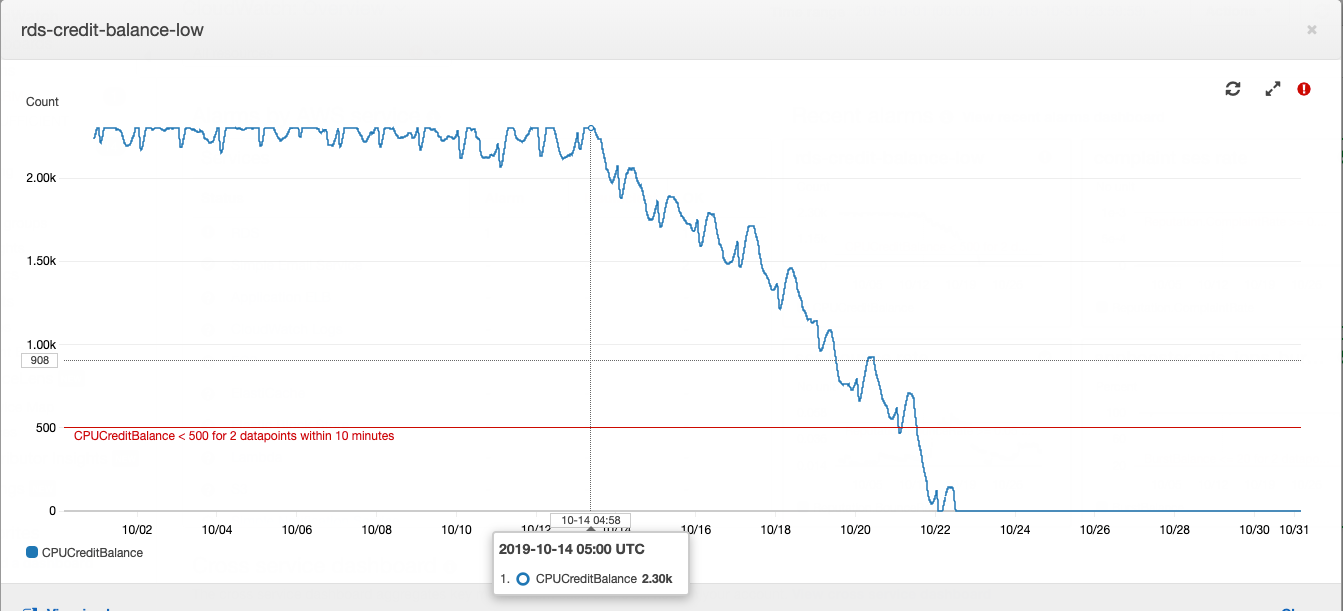
How does Postgres type “t” instance work in Amazon RDS: if your database is running with average CPU consumption below a certain value, then you accumulate credits on your account, which the instance can spend on CPU consumption during high load hours - this saves you overpaying for server capacity and to cope with high load. More details about what and how much they pay using AWS can be found in the article of our CTO .
The balance of loans at a certain point was depleted. For some time, this was not given much importance, because the balance of loans can be replenished with money - it cost us about $ 20 per month, which is not very noticeable for the total cost of renting computing power. In product development, it is customary to primarily pay attention to the tasks formulated from business requirements. The increased CPU consumption of the database server fits into technical debt and is offset by the small cost of purchasing a credit balance.
One fine day, I wrote in the daily summari that I was very tired of putting out the “fires” that periodically appeared in different parts of the project. If this continues, the burned-out developer will devote time to business tasks. On the same day, I went to the main project manager, explained the alignment and asked for time to investigate the causes of periodic fires and repair. Having received the go-ahead, I began to collect data from various monitoring systems.
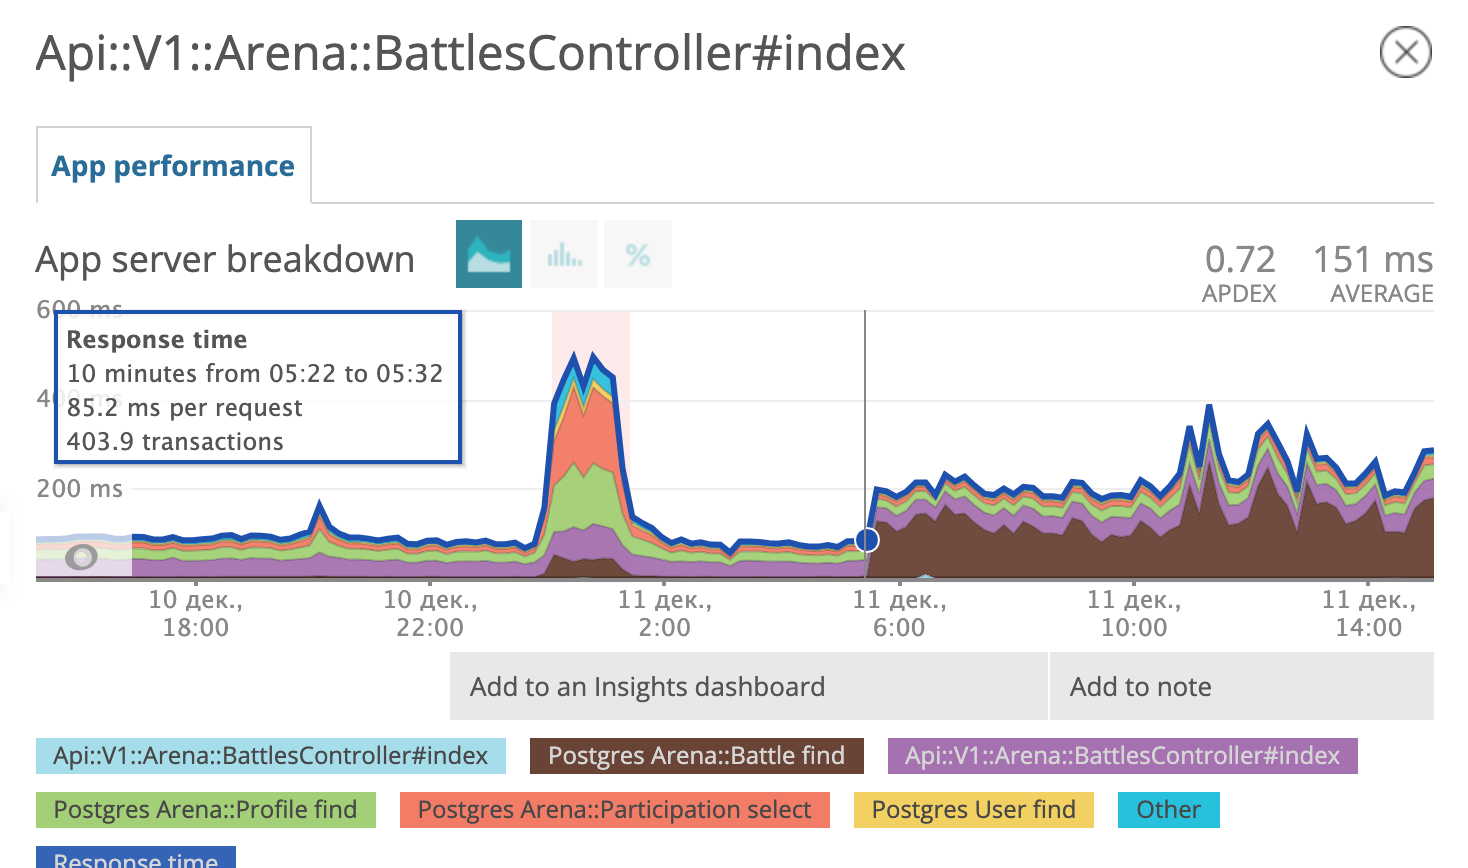
We use Newrelic to track the total response time per day. The picture looked like this:
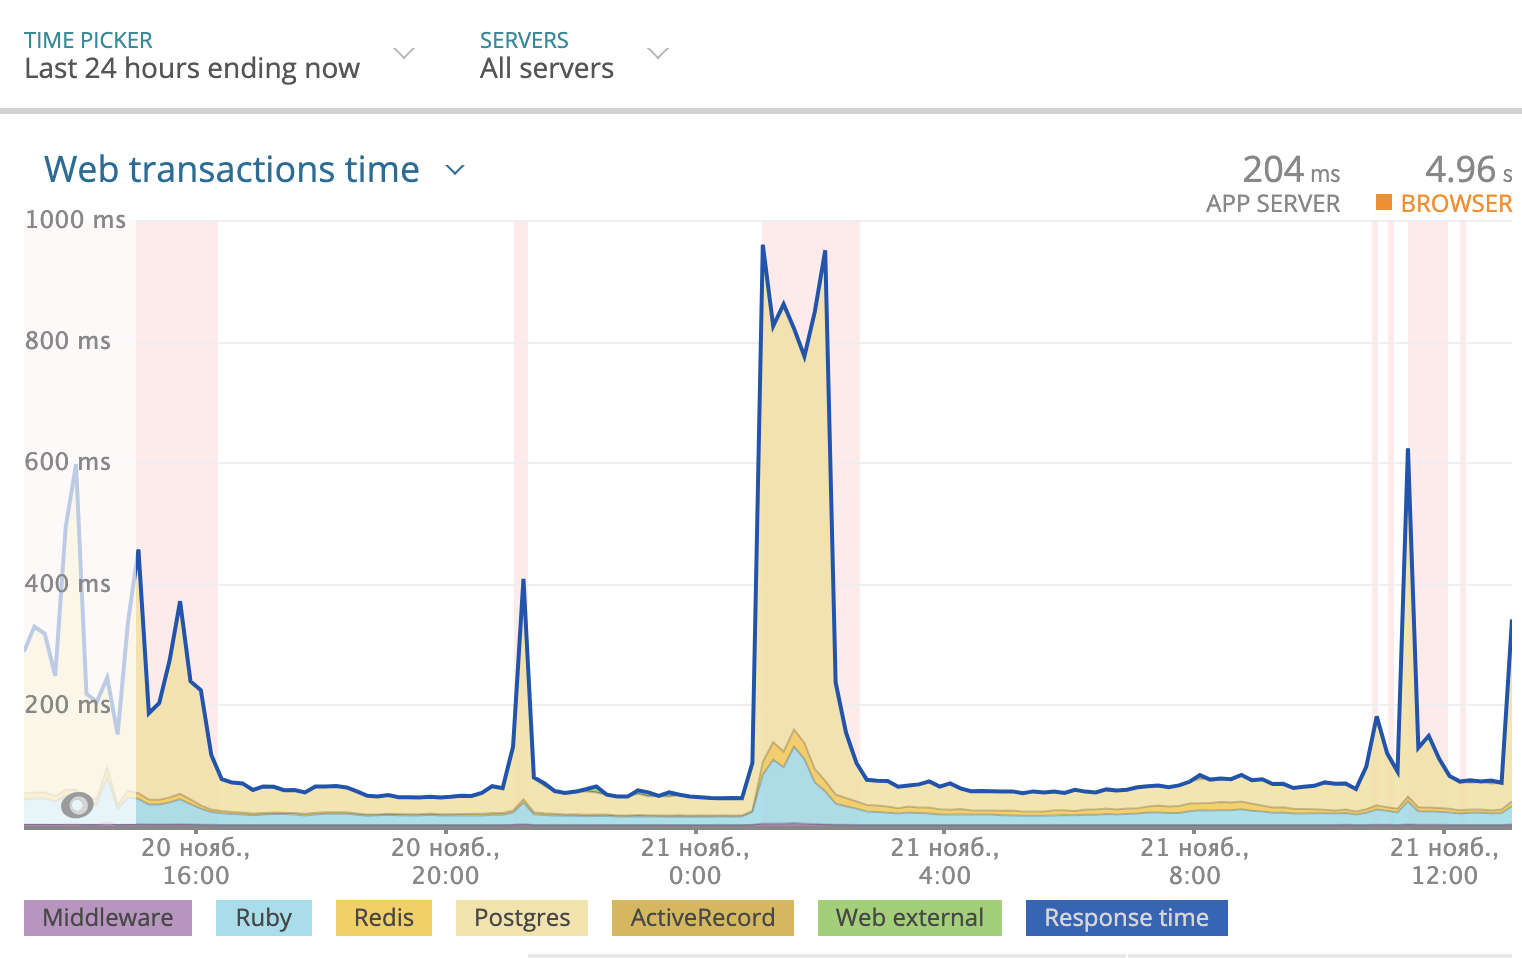
Part of the response time that Postgres takes is highlighted in yellow in the graph. As you can see, sometimes the response time reached 1000 ms, and most of the time it was the database that pondered the response. So you need to look at what is happening with SQL queries.
PMDSC is a simple and straightforward practice for any boring SQL optimization job
Play it!
Measure it!
Draw it!
Suppose it!
Check it!
Play it!
Perhaps the most important part of the whole practice. When someone says the phrase "Optimizing SQL queries" - it rather causes a fit of yawning and boredom in the vast majority of people. When you say "Detective investigation and search for dangerous villains" - it more engages and sets you yourself in the right mood. So it's important to get into the game. I enjoyed playing detective. I imagined that problems with the database are either dangerous criminals or rare diseases. And he imagined himself in the role of Sherlock Holmes, Lieutenant Columbo or Doctor House. Choose a hero to your taste and go!
Measure It!

To analyze request statistics, I installed PgHero . This is a very convenient way to read data from the pg_stat_statements Postgres extension. Go to / queries and look at the statistics of all queries for the last 24 hours. Sorting queries by default according to the Total Time column - the proportion of the total time the database processes the query - a valuable source in finding suspects. Average Time - how many, on average, the request is executed. Calls - how many requests were made during the selected time. PgHero considers requests to be slow if they were executed more than 100 times per day and took more than 20 milliseconds on average. List of slow queries on the first page, immediately after the list of duplicate indexes.

We take the first one in the list and look at the details of the query, you can immediately see it explain analyze. If the planning time is much less than the execution time, then something is wrong with this request and we are focusing our attention on this suspect.
PgHero has its own visualization method, but I liked using explain.depesz.com more, copying data from explain analyze there.
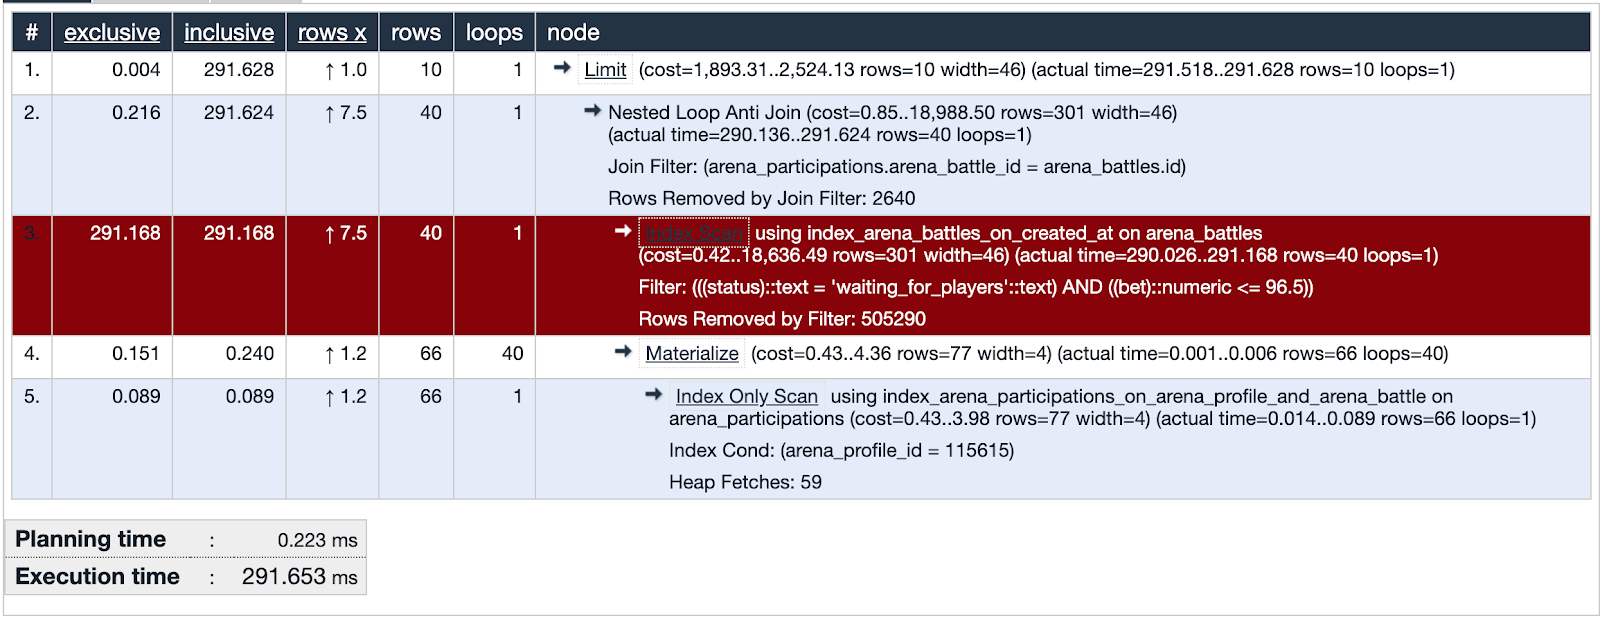
One of the suspect queries is using Index Scan. The visualization shows that this index is not effective and is a weak point - highlighted in red. Fine! We examined the suspect's tracks and found important evidence! Justice is inevitable!
Draw it!
Let's draw a lot of data that is used in the problematic part of the query. It will be useful to compare with what data the index covers.
A bit of context. We tested one of the ways to keep the audience in the application - something like a lottery in which you can win some local currency. You place a bet, guess a number from 0 to 100 and take the whole pot if your number is closest to the one that the random number generator received. We called it “Arena” and called the rallies “Battles”.

The database at the time of the investigation contains about five hundred thousand records of battles. In the problematic part of the request, we are looking for battles in which the rate does not exceed the user's balance and the status of the battle is waiting for the players. We see that the intersection of sets (highlighted in orange) is a very small number of records.
The index used in the suspect part of the request covers all created battles on the created_at field. The request runs through 505330 records from which it selects 40, and 505290 eliminates. It looks very wasteful.
Suppose it!
We put forward a hypothesis. What will help the database find forty out of five hundred thousand records? Let's try to make an index that covers the rate field, only for battles with the "waiting for players" status - a partial index.
add_index :arena_battles, :bet,
          where: "status = 'waiting_for_players'",
          name: "index_arena_battles_on_bet_partial_status"
Partial index - exists only for those records that match the condition: the status field is equal to "waiting for players" and indexes the rate field - exactly what is in the query condition. It is very beneficial to use this particular index: it takes only 40 kilobytes and does not cover the battles that have already been played and we do not need to get a sample. For comparison, the index_arena_battles_on_created_at index, which was used by the suspect, takes about 40 MB, and the table with battles is about 70 MB. This index can be safely removed if other queries do not use it.
Check it!
We roll out the migration with the new index into production and observe how the response of the endpoint with battles has changed.
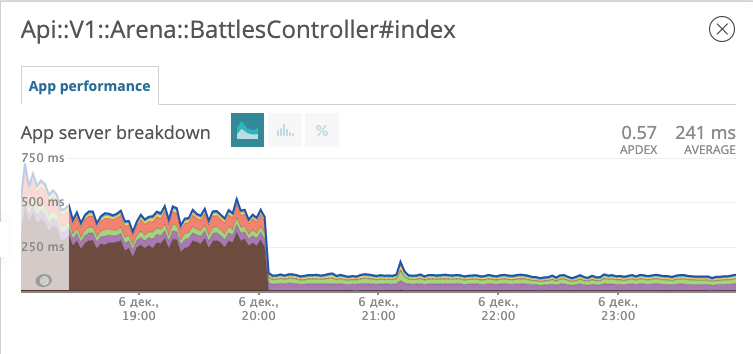
The graph shows what time we rolled out the migration. On the evening of December 6, the response time decreased by about 10 times from ~ 500 ms to ~ 50ms. The suspect in court received the status of a prisoner and is now in prison. Fine!
Prison break
A few days later, we realized that we were happy early. It looks like the prisoner found accomplices, developed and implemented an escape plan.
On the morning of December 11, the postgres query scheduler decided that using a fresh parsed index was no longer profitable for it and began to use the old one again.
We are back at the Suppose it stage! Putting together a differential diagnosis, in the spirit of Dr. House:
- It may be necessary to optimize postgres settings;
- maybe upgrade postgres to a newer version in minor terms (9.6.11 -> 9.6.15);
- and maybe, again, carefully study which SQL query forms Rails?
We tested all three hypotheses. The latter led us to the trail of an accomplice.
SELECT "arena_battles".*
FROM "arena_battles"
WHERE "arena_battles"."status" = 'waiting_for_players'
   AND (arena_battles.bet <= 98.13)
   AND (NOT EXISTS (
            SELECT 1 FROM arena_participations
            WHERE arena_battle_id = arena_battles.id
              AND (arena_profile_id = 46809)
          ))
ORDER BY "arena_battles"."created_at" ASC
LIMIT 10 OFFSET 0
Let's walk through this SQL together. We select all battlefields from the battle table whose status is equal to "waiting for players" and the rate is less than or equal to a certain number. So far, everything is clear. The next term in the condition looks creepy.
NOT EXISTS (
            SELECT 1 FROM arena_participations
            WHERE arena_battle_id = arena_battles.id
              AND (arena_profile_id = 46809)
          )
We are looking for a non-existent subquery result. Get the first field from the battle participation table, where the battle ID matches and the participant's profile belongs to our player. I will try to draw the set described in the subquery.

It's hard to comprehend, but in the end, with this subquery, we tried to exclude those battles in which the player is already participating. We look at the general explain of the query and see Planning time: 0.180 ms, Execution time: 12.119 ms. We found an accomplice!
It's time for my favorite cheat sheet, which has been around the internet since 2008. Here it is:

Yes! As soon as a query encounters something that should exclude a certain number of records based on data from another table, this meme with beard and curls should pop up in memory.
In fact, this is what we need:

Save this picture for yourself, or better yet, print it and hang it in several places in the office.
We rewrite the subquery to LEFT JOIN WHERE B.key IS NULL, we get:
SELECT "arena_battles".*
FROM "arena_battles"
LEFT JOIN arena_participations
   ON arena_participations.arena_battle_id = arena_battles.id
   AND (arena_participations.arena_profile_id = 46809)
WHERE "arena_battles"."status" = 'waiting_for_players'
   AND (arena_battles.bet <= 98.13)
   AND (arena_participations.id IS NULL)
ORDER BY "arena_battles"."created_at" ASC
LIMIT 10 OFFSET 0
The corrected query runs across two tables at once. We added a table with records of the user's participation in the battles on the “left” and added the condition that the participation identifier does not exist. Let's see the explain analyze the received query: Planning time: 0.185 ms, Execution time: 0.337 ms. Fine! Now the query planner will not hesitate that it should use the partial index, but will use the fastest option. The escaped prisoner and his accomplice were sentenced to life imprisonment in a strict regime institution. It will be more difficult for them to escape.
The summary is brief.
- Use Newrelic or another similar service to find leads. We realized that the problem is precisely in the database queries.
- Use PMDSC practice - it works and in any case is very engaging.
- Use PgHero to find suspects and investigate clues in SQL query statistics.
- Use explain.depesz.com - it's easy to read explain analyze queries there.
- Try drawing lots of data when you don't know what exactly the request is doing.
- Think of the tough guy with curls all over his head when you see a subquery looking for something that isn't in another table.
- Play detective, you might even get a badge.