Keeping track of business processes can be tricky, especially if they involve many stages and involve a large number of people and systems. For this, there are Process Mining technologies, which, in theory, should help with optimization. Today Dmitry Emelyanov, head of IT services management at M.Video-Eldorado, will tell how his team implemented a solution of this class in his department and was able to interest other divisions with successful results.
Process Mining ideas have been in the air for a long time. About 3 years ago this technology was demonstrated to us by one of the potential suppliers, but then we were not ready to apply it "for the analysis of any processes." Still, there was little information about the implementation of such solutions. However, the concept itself interested the leaders, and we decided on a pilot.
Do for yourself first
We have chosen the tasks of our own unit. Thus, the first Celonis installation and Process Mining setup were launched for ITSM processes.
This option suited everyone - streamlining business processes for handling incidents and service requests was useful for the IT department. In addition, it was much easier for us to check the effectiveness of the solution precisely on those problems that we face every day.
We work with Axios Assyst, a master ticket management system. It registers and classifies the applications themselves. But there are limited reporting options for evaluating process performance.
Before Celonis was implemented, managers had to go to multiple reports to measure the effectiveness of the process and assess its "health". They were created using SAP BI, as well as Assyst Report Server (a special reporting system that generates graphs, receiving data from the Assyst database). These decisions are difficult to manage changes - you need to create a request and wait for a response to develop and adjust a report.
Therefore, external specialists were involved in the preparation of reports, which means that any changes still required a separate request. In addition, the reports showed an already fait accompli - how many incidents there were, how much was overdue. All this was devoid of dynamics, detail. To find out how the problematic incident was actually handled, it was necessary to manually reassemble the data by period.
Among other problems of the old solution, one can note the impossibility of quickly scaling reports and applying additional filters to view only tickets with the required parameters. In addition, the participants in the process could not clarify the effectiveness of their work for each application. That is, if, for example, the SLA suffered, no one could say for sure: "Is it because of me or not?"
Mine ITSM processes
For the pilot implementation of Celonis, we used the expertise of a contractor who already had experience in implementing and creating data models. Our case, however, was quite simple from the point of view of technical setup, since all data is taken from one master system. We wanted to know the details about the processing speed of applications, the reasons for the violation of the SLA, the principles of classification and the facts of the presence of pending applications.
Technically, it all works as follows. For any analysis according to the Process Mining methodology, two tables are required: a chain table (cases) and an event log table. The case ID is a pass-through identifier for all chains. In our case, the chain table contains the main attributes of the request - status, category, the system for which the request was registered, the applicant, etc., as well as parameters calculated according to predefined formulas, for example, the time spent according to the SLA or the time of the request in standby mode.
The log of actions that were performed with the request in the system is loaded into the events table, and artificial events are created from the attributes of the request (for example, the creation time of the request is determined by the time of its registration). Each event, in addition to the obligatory three fields (case_id, timestamp, action_name), has a number of additional attributes useful for analysis: for example, the user who performed the action, the name of his group, the comment left, and so on. And when we began to process all this information in Celonis, the possibilities that process analytics provide became clear.
By the way, all the limitations and difficulties described above with the use of old reports and systems became fully apparent only at this stage. That is, having implemented Process Mining, the team involuntarily began to ask the question: "How did we live before that?"
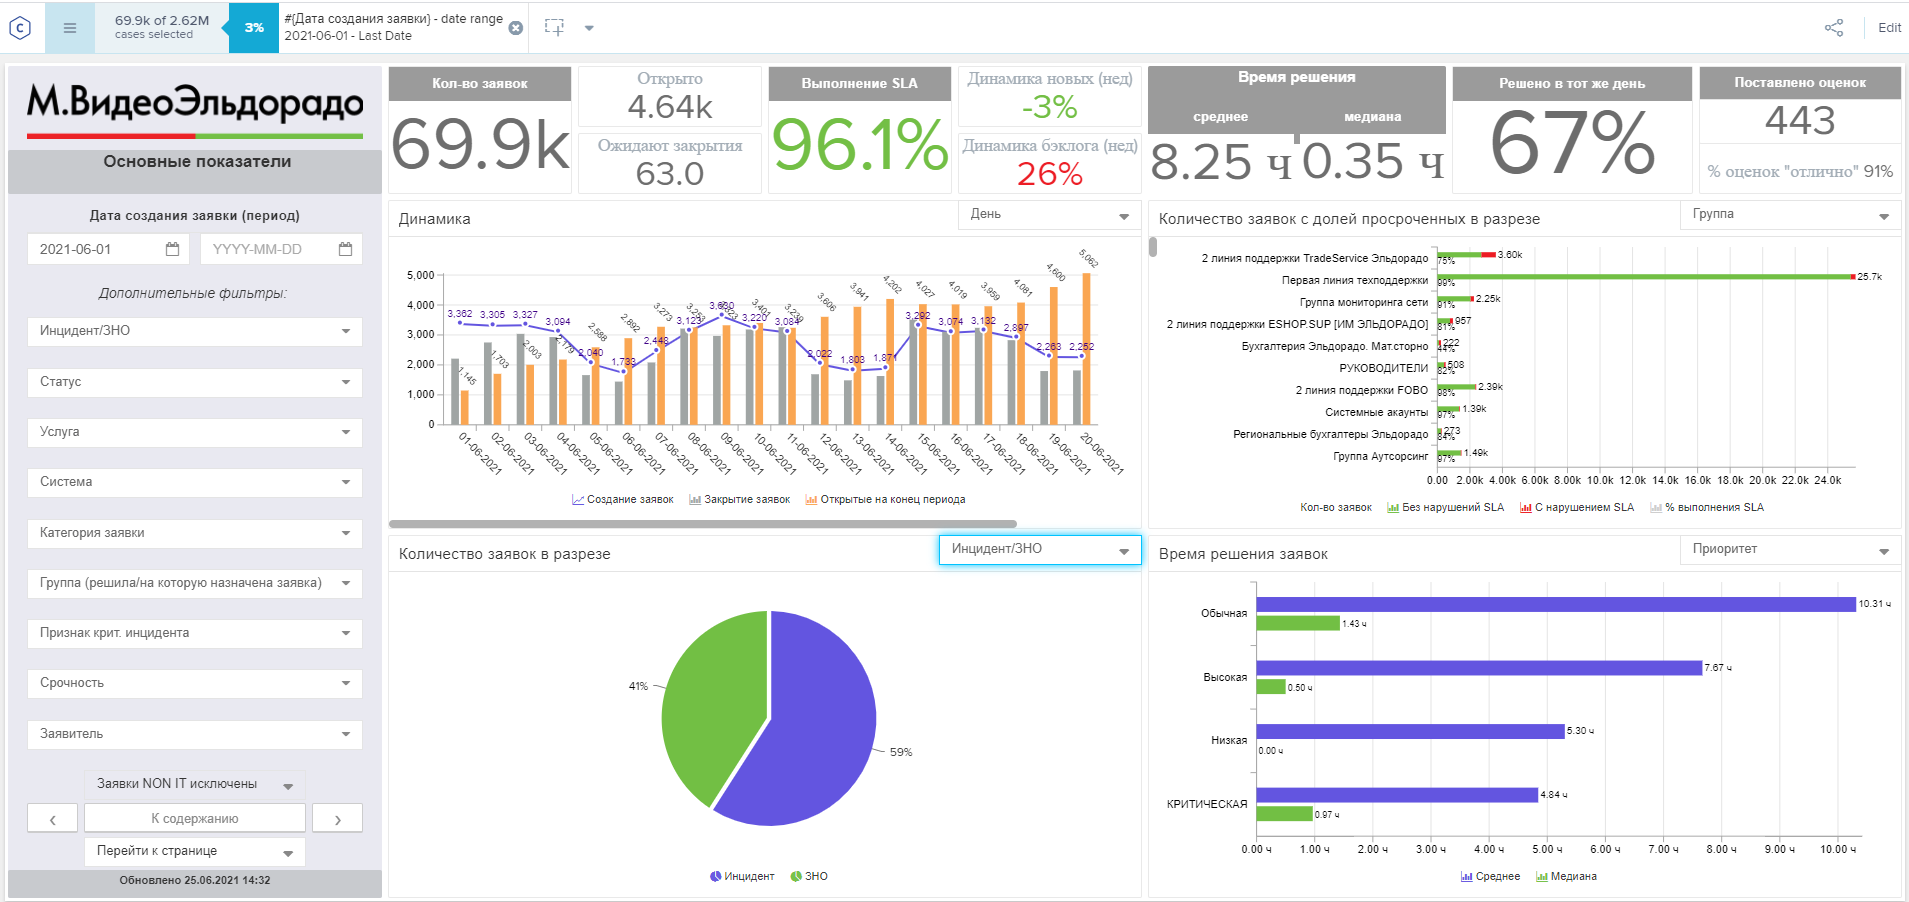
To track the parameters we are interested in, we have already created dashboards ourselves (now there are about 10 of them).

The main advantage of Celonis is the ability to build different stages of processing applications on a straight line. By revealing different parts of the process, you can find out how many people participated in the processing of this incident, see the duration of each stage, and track statistics.
Thus, we received a tool that allows us to monitor the compliance of business processes with approved standards in real time and immediately register violations and study the factors that lead to deviations.

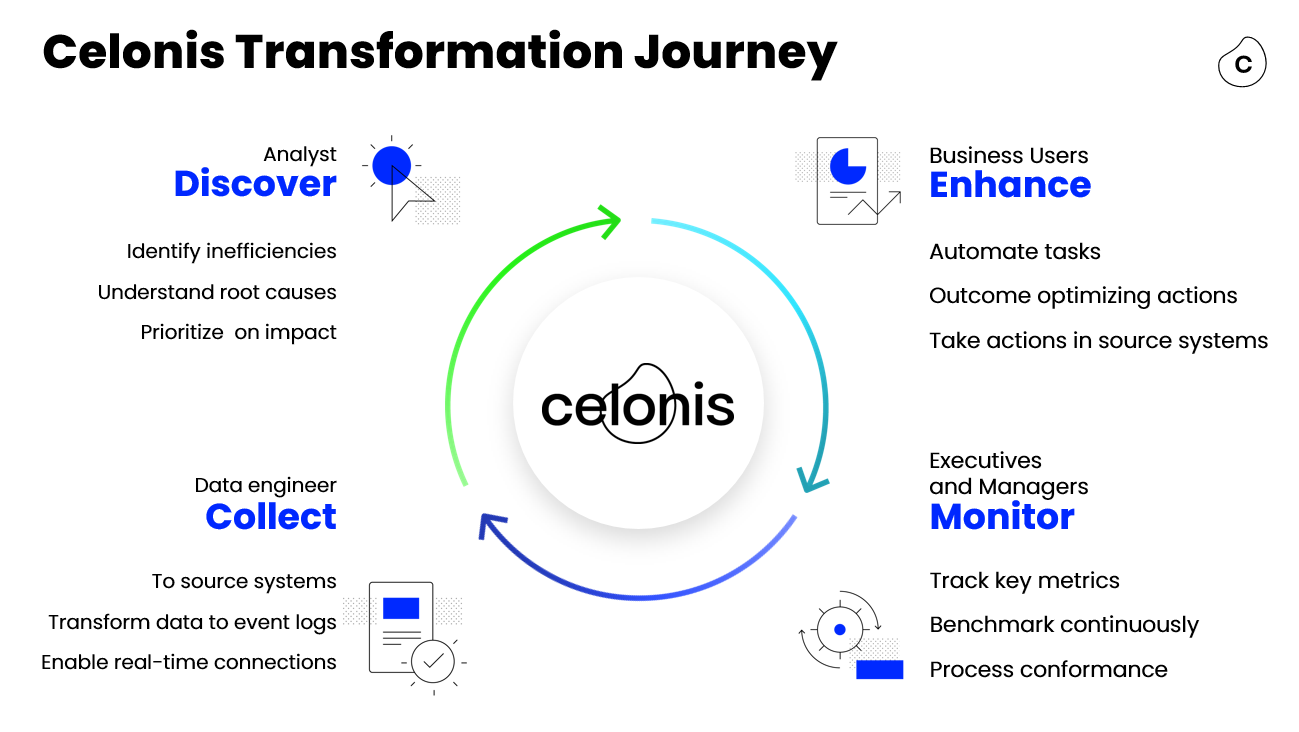
We started by collecting 50 attributes to test the functionality of the system, but it soon became clear that this was not enough. We started to expand the data model, and this process is still going on. The advantage of process analysis through Celonis is that the analysis, monitoring, collection and processing of data are closed in a continuous loop, providing development and flexibility. And as the model evolves, new attributes are added to it, and all participants are included in this work: from data engineers to process managers.

The undoubted advantage of the Process Mining pilot in the ITSM field is that we ourselves understand which digital traces we want to track and why. We know what results we want to get and accumulate the necessary expertise to connect other departments to the system.
How we use Celonis today
So, with the help of Celonis, we find bottlenecks and optimize the work with requests. Regular loading of data into the dashboard allows you to quickly get statistics and quickly track deviations from the process standards. Additional filters provided in the system increase the transparency and flexibility of the reports. And this means that we can get a detailed picture with a drawing of an incident that we, perhaps, did not even know about a few minutes ago.
Dashboards are built for the participants in the process themselves, for management analytics, and are also created to test hypotheses. The last type of dashboards is the most dynamic one, it helps to check the assumptions about deviations in the application routes.
For example, we decided to check how the reopening of the application affects the key indicators, as well as find out why they occur - if there is any pattern in this. To do this, tracking of reopened orders is added to the dashboard, for example, with an SLA. By observing the process, we can understand which services it is typical for and trigger a change in the process.
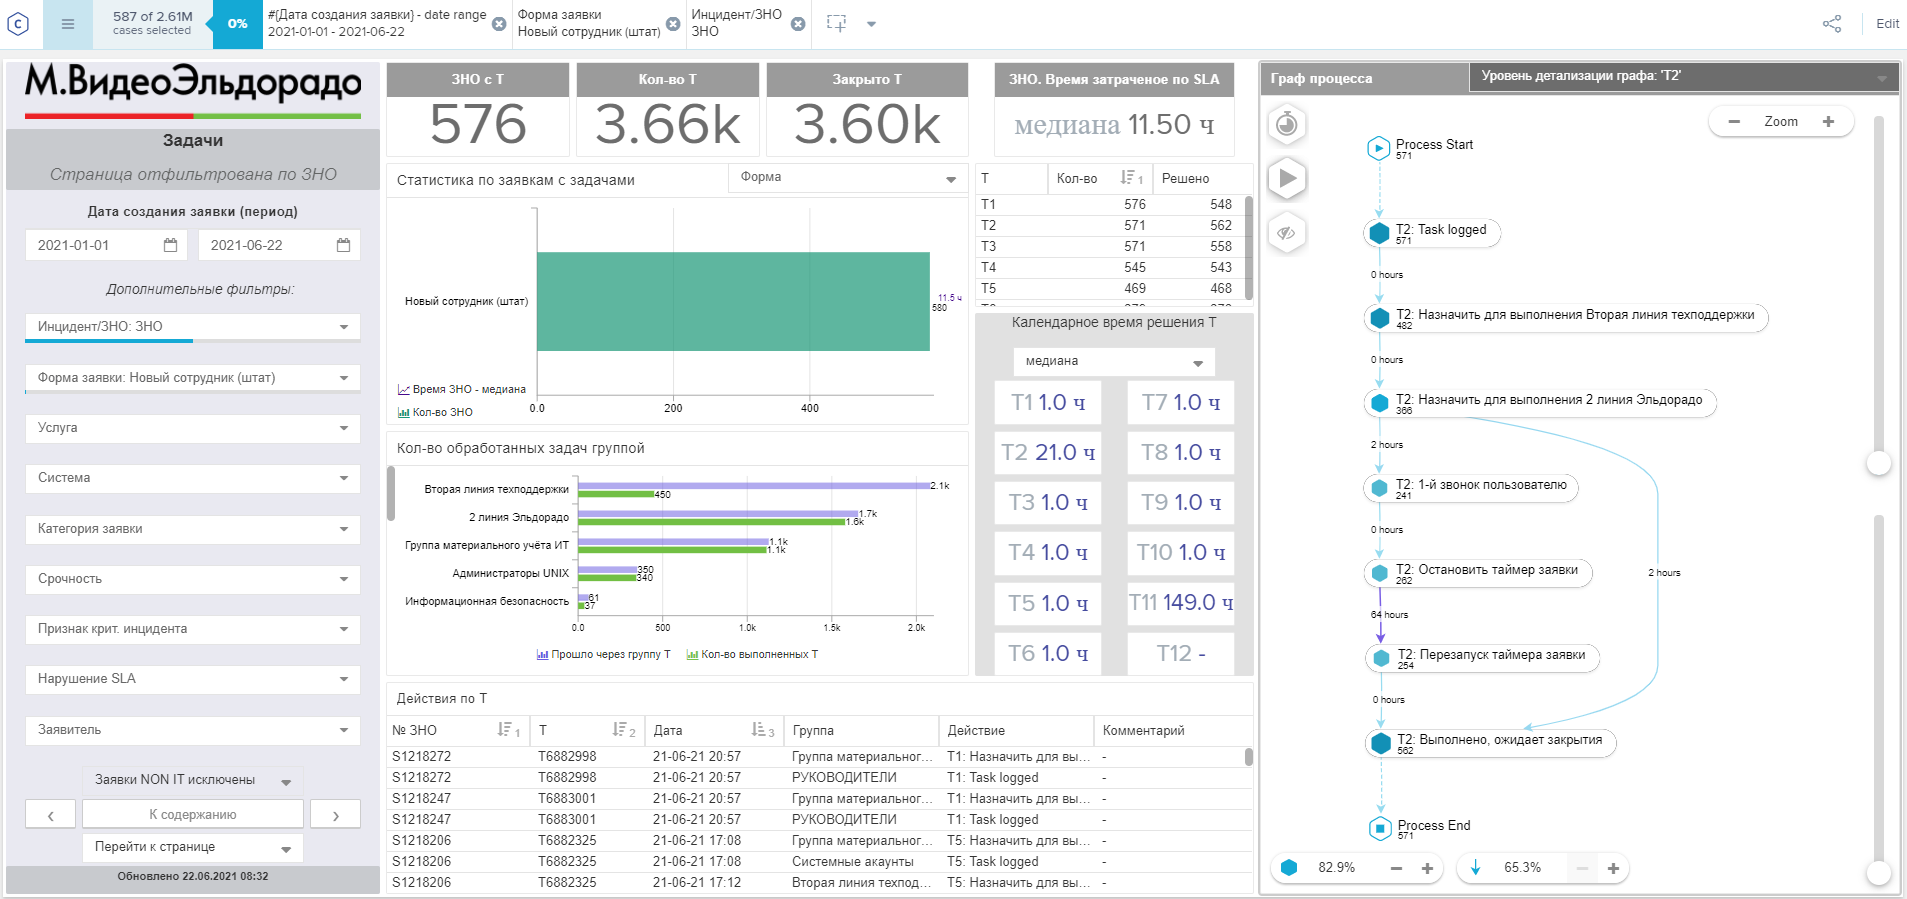
Let's look at an illustrative example. One of the typical applications in our company is setting up a workplace for a new employee. At such a request, a computer is provided, sent to IT specialists for configuration, and so on. What could go wrong?
In the system, we see that over the past six months we have had 576 such applications. Applications include up to 11 sequential tasks that are performed by different groups. The average execution time for each is 1 hour, but for the second task this time rises to 21 hours. On the graph, you can see that in half of the cases an additional step occurs - a call to the user, due to which the application timer stops for several days.

We can fail in the details and find out what the processes were, what equipment was required, what information was not enough to resolve the application. In our case, it turned out that in 184 cases the customer was asked for something additional. This took a significant amount of time. So we should go deeper into the process, find out what information was missing and add a new field to the application form.
Here's another example. The process requires up to three approvals. D1 approval takes 16 hours, and the rest takes place instantly. It becomes obvious that the bottleneck of the process is the first agreement. The life cycle of the application will be shortened precisely due to the optimization of this step. Improving server performance, increasing the number of responsible personnel is useless.

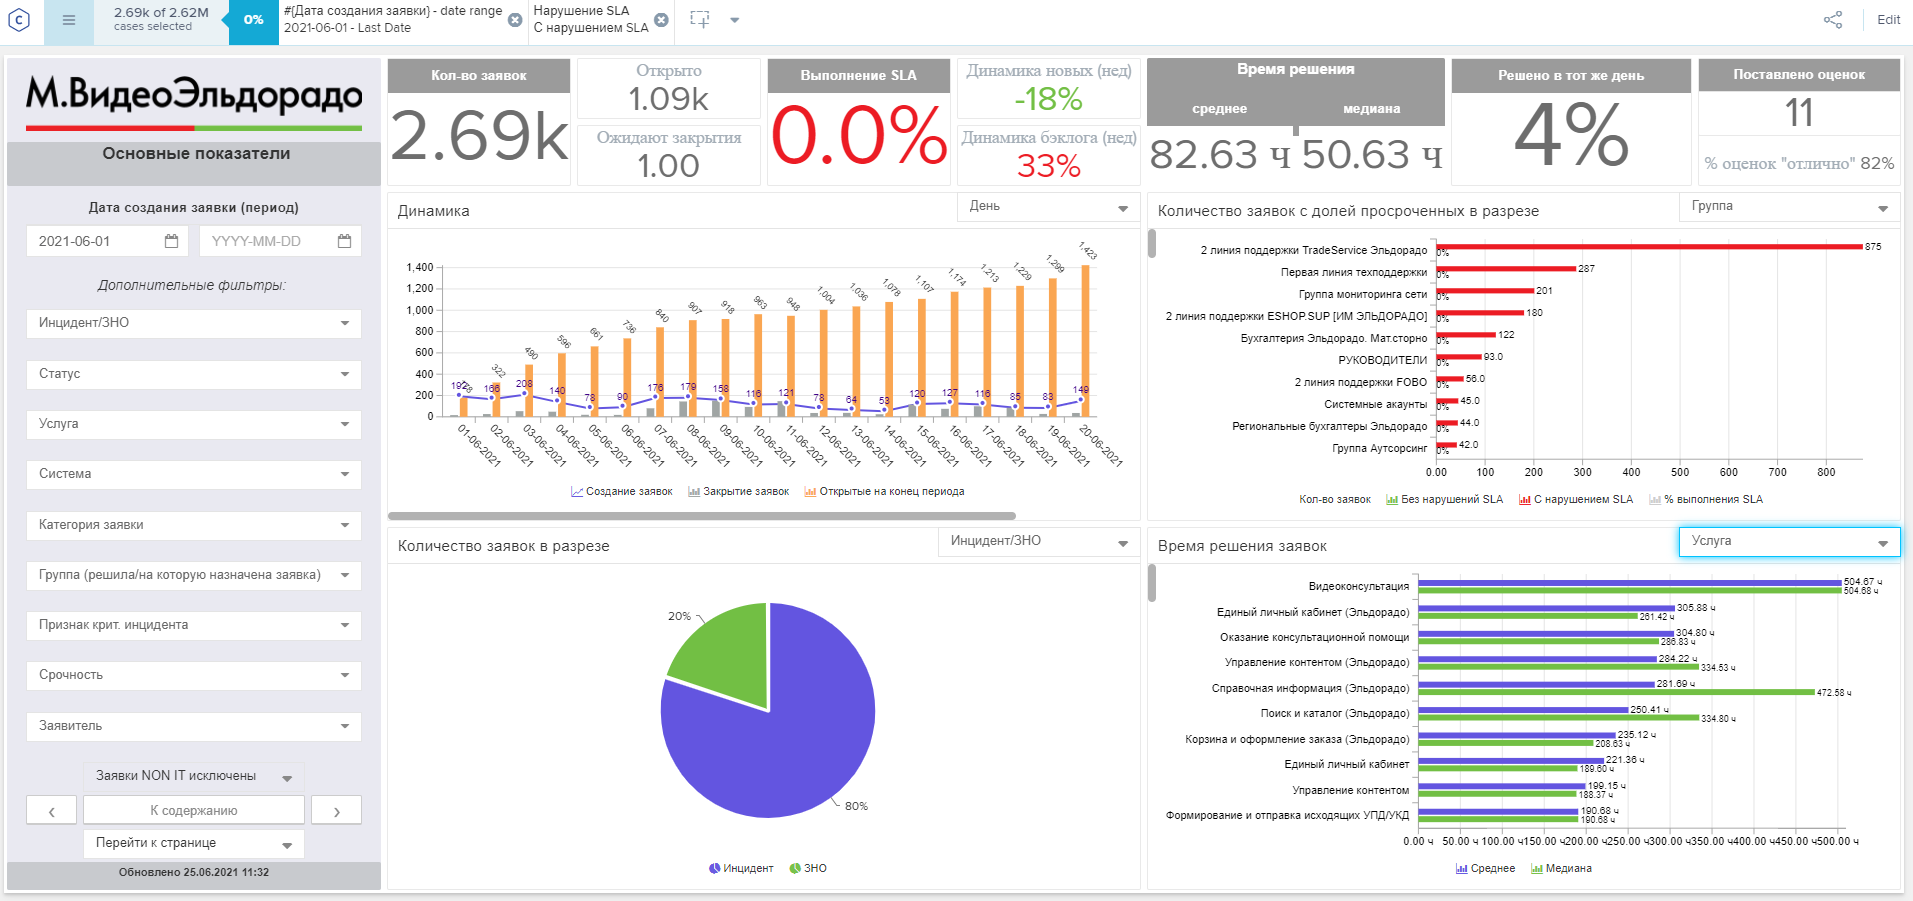
Now let's turn our attention to tracking a key metric - SLA compliance. Right on the dashboard, we can select only those orders where the SLA was violated. The flexibility and scalability of reports allows you to quickly conduct in-depth analysis and understand the root causes that lead to a violation of the SLA.

At the same time, tabs with dashboards can be personalized for different tasks and customers. For example, you can set up regular export to PDF and sending to responsible persons. This is what a dashboard looks like for a support team leader.

Expansion prospects
As we have already said, within the framework of the pilot, the data is taken from one system. Having received the first results for ITSM (the processing time of requests for critical systems decreased in some cases by 90%, and the "SLA compliance" indicator increased from 90 to 97%), we were convinced that the system will help improve other business processes.
We're working to expand Celonis' applications to include ordering and installation processes, so digital footprints will soon be coming from 7 different systems. For example, as part of the analysis of order execution, one process will affect delivery, settlement documents, complaints, customer requests, etc. However, as soon as we do, we will definitely tell you.