I have long liked Bayesian networks of trust (BSD) for their clarity, which, you see, is very important for the educational process. Somehow on the Internet, quite unexpectedly, I came across a very successful visualization of simple financial tasks, performed using BSD. A thought flashed - this, perhaps, can be explained not only to our financiers, but also to philologists-psychologists, together with doctors!
And this story began about three years ago, when the leadership of the university put us, the teachers, with a choice: either we were on the command "All of a sudden!" we enter the digital economy, or, shaking hands, quietly disperse, whoever knows where. The reason is the demographic hole, the economic crisis, the success of competitors, etc.
Well, well, as they say, digital is so digital! For those of us who, besides financial, also had a good engineering education, all this did not seem to be a disaster, because chewed long ago in textbooks and monographs on machine learning, artificial intelligence, expert systems. However, the problem was aggravated by the fact that the law does not prevent philologists, psychologists, doctors and anyone else from entering the financial magistracy. As a result, the study group often includes half of the philologists and psychologists, or even more. And here, if you are not capable of such an audience, which is called “between times,” to quickly “finish reading” the theory of probability at least to Bayes’s theorem, then further - a complete stop, and no digitalization.
After that discovery on the Internet, for some time I deliberately sorted out ready-made software products, and, in the end, settled on Netica . Yes, there is Hugin, there is MSBN, and a dozen more like them, but, as always: one is expensive, the other is complex, the third is both, etc. But Netica is free (up to 15 nodes of variables ), simple, intuitive, students master it in one lesson, and - go ahead! Build your own, albeit simple, even primitive, but working "with a kick" expert system, which "buzzes and clicks" right in the classroom.
But to show is better than to tell, so further I show what came of it.
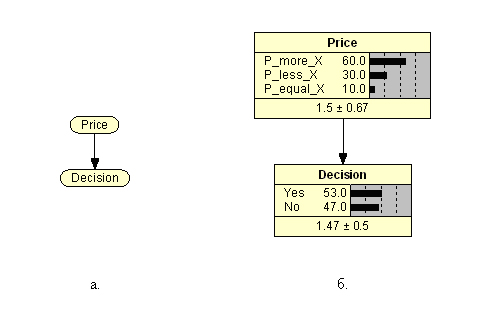
, . – (. . 1). :
rice ( ) ;
Decision ( D) .
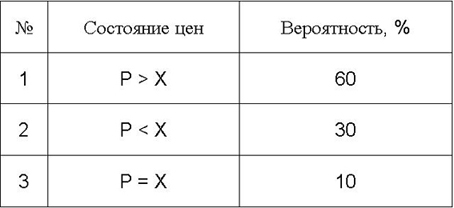
, () , , , (), , , , 60% , . , (10%), 30% , .


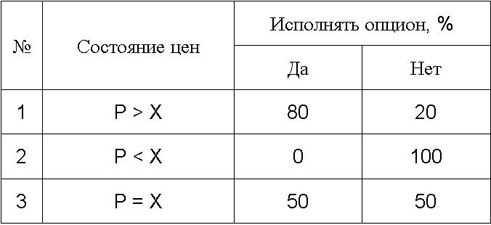
() D , , . , , , . , 100%, , , 80% (1- ).

P < X (2- ), , 100% . (3- ), – , , . 50/50.
Netica , (. 1). :
D yes = 0,8 · 0,6 + 0 · 0,3 + 0,5 · 0,1 = 0,53;
D no = 0,2 · 0,6 + 1 · 0,3 + 0,5 · 0,1 = 0,47.
, , . , (), () .

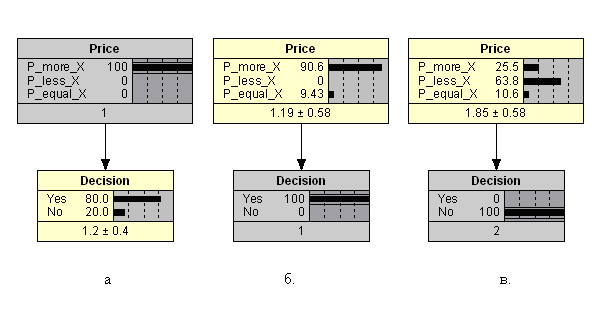
Netica , . ( ), , .
.2 P > X. , 80% . . 2 , , , , 90,6% ( 100%) , 9,43% , . . 2. , 63,8%, 25,5% , 10,6% !
– , , (. 2). , , :
, ( ) , .
, , – , , – ! , , , , . , .
? – (). ? – 22, . . .