I first saw this strange graph in the laboratory of the university. A nondescript piece of paper, photocopied from an old book, was pasted on the wall next to the rotary evaporator . The sheet, obviously, was used often, but it was taken care of, as if it contained some ancient powerful spell ... Subsequently, I came across similar kind of graphs in other laboratories, as if they were an integral part of distillation with vacuum. Then similar drawings were found on the pages of various technical literature. They were called nomograms . It turned out to be ridiculously easy to learn how to use them, but who and how made them at one time remained a mystery.
What nomograms look like and how they work
A nomogram that is often used in vacuum distillation is shown in the figure below.
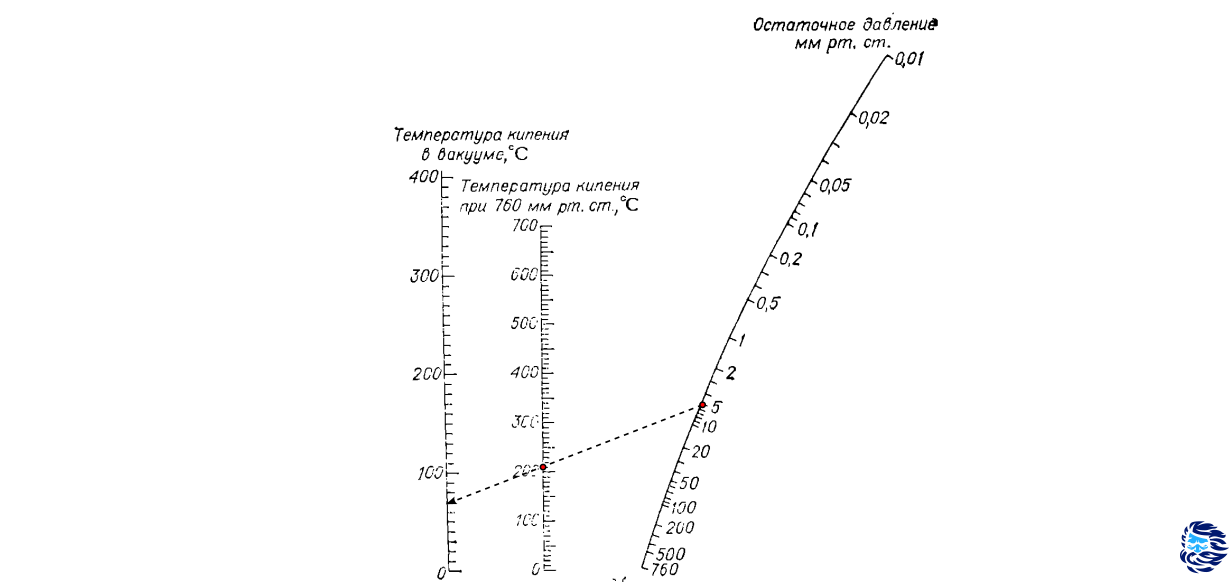
, , (), . , , , — , . , . 760 100 , , 40 34 .
-, 204 ? " 760 " 204 , " " 5 , . , , 70 .
. . , . , ?
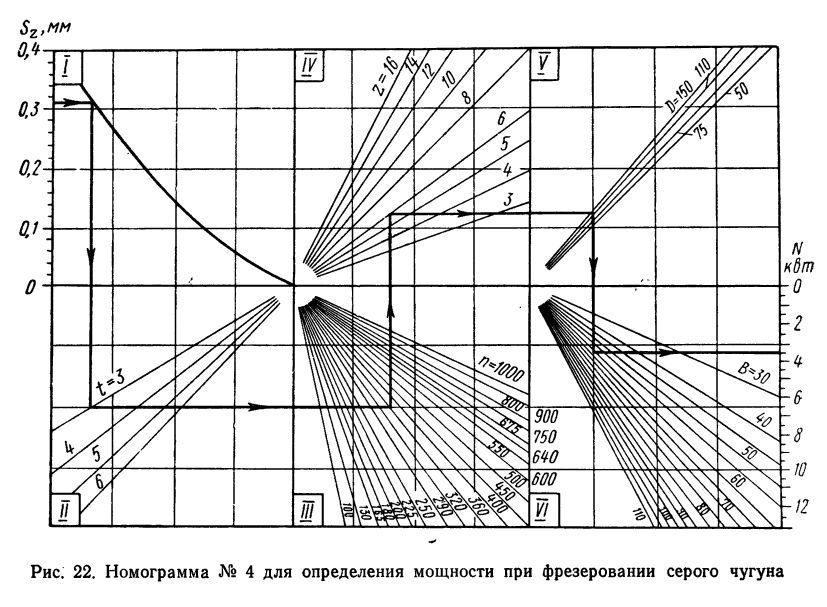
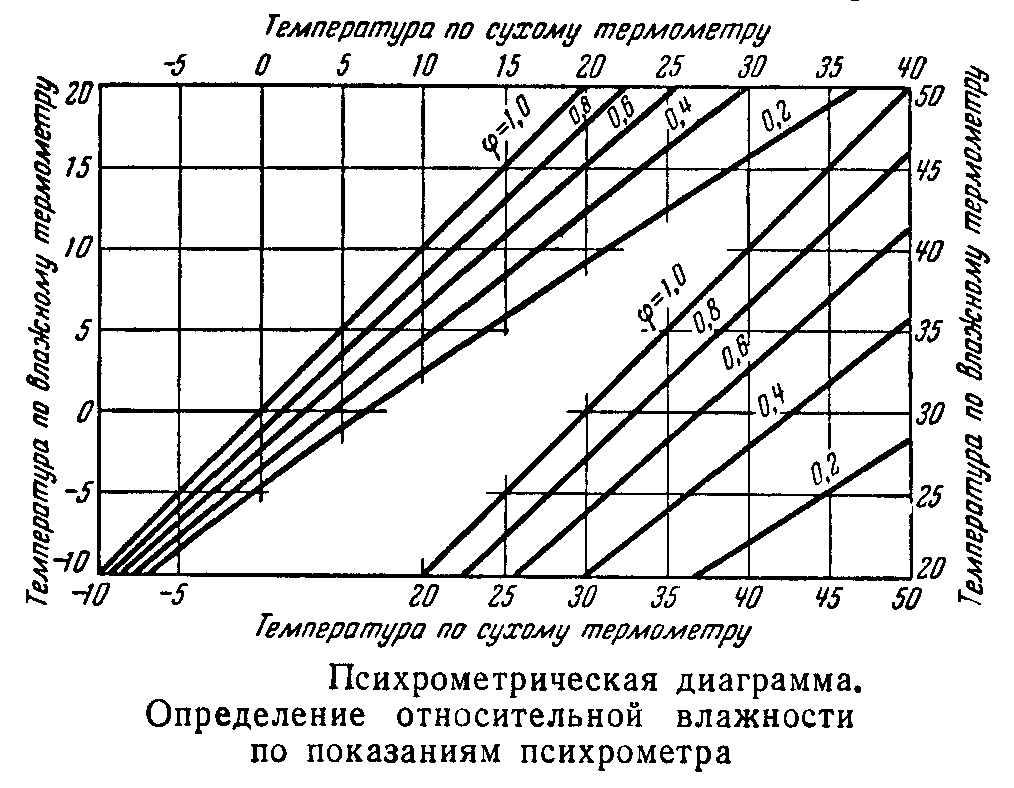
(1884—1891) — «». Traité de nomographie. Théorie des abaques. Applications pratiques . . , — The Lost Art of Nomography by Ron Doerfler.
, !
: . , — :
— , — .
:
760 , — . .
:
, :
.
pynomo
— - pynomo. :
pip install pynomo
2 :
— - . .
, (RPM) . :
#!/usr/bin/env python3
# -*- coding: utf-8 -*-
"""
rpm.py
Simple nomogram of type 2: F1=F2*F3
"""
import sys
sys.path.insert(0, "..")
from pynomo.nomographer import *
N_params_RCF={
'u_min':1000.0,
'u_max':30000.0,
'function':lambda u:u,
'title':r'RCF, $\times g$',
'tick_levels':3,
'tick_text_levels':1,
'tick_side': 'left',
'scale_type':'linear smart',
'text_format': r"$%2.0f$",
}
N_params_r = {'u_min': 1.0,
'u_max': 5.0,
'function': lambda u:u,
'tick_levels': 3,
'tick_text_levels': 1,
'tick_side': 'left',
'text_format': r"$%2.0f$",
'title':r'R, cm',
'extra_params': [
{'u_min': 5.0,
'u_max': 10.0,
'tick_levels': 2,
'tick_text_levels': 1,
'tick_side': 'right',
'text_format': r"$%2.0f$",},
{'u_min': 10.0,
'u_max': 40.0,
'scale_type': 'manual line',
'manual_axis_data': {10.0: r'10',
12.0: r'12',
14.0: r'14',
16.0: r'16',
20.0: r'20',
24.0: r'24',
30.0: r'30',
40.0: r'40'},
},
],
}
N_params_RPM={
'u_min': 1000.0,
'u_max':20000.0,
'function':lambda u:u*u*1.1182e-5,
'title':r'RPM',
'tick_levels':3,
'tick_text_levels':1,
'scale_type':'linear smart',
'text_format': r"$%2.0f$",
}
block_1_params={
'block_type':'type_2',
'mirror_y':True,
'width':10.0,
'height':10.0,
'f1_params':N_params_RCF,
'f2_params':N_params_r,
'f3_params':N_params_RPM,
'isopleth_values':[['x',10.0,15200]],
}
main_params={
'filename':'RPM.pdf',
'paper_height':10.0,
'paper_width':10.0,
'block_params':[block_1_params],
'transformations':[('rotate',0.01),('scale paper',)],
'title_str':r'$a=r\times \omega^2$'
}
Nomographer(main_params)
:
'function':lambda u:u*u*1.1182e-5,
RPM.pdf, .
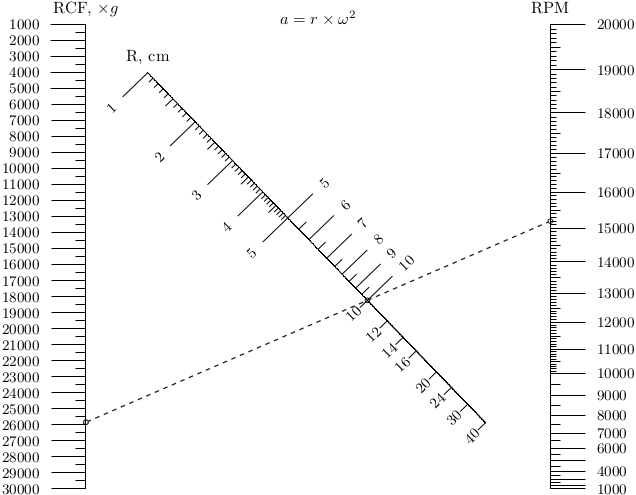
— , ( g) ( ) (RPM).
? .
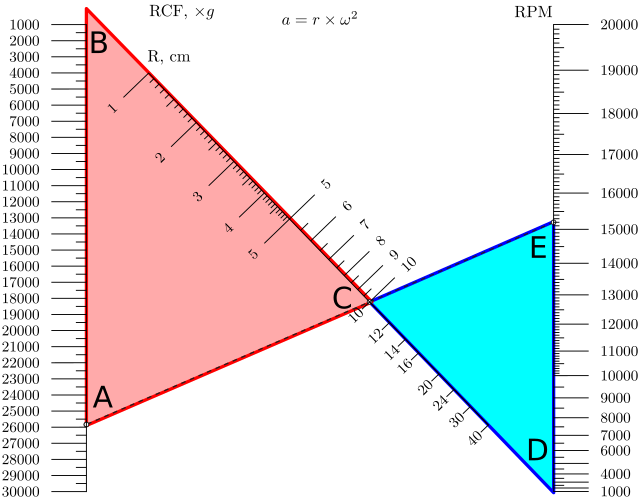
, ABC CDE — . :
L — BD, . , L.
,
:
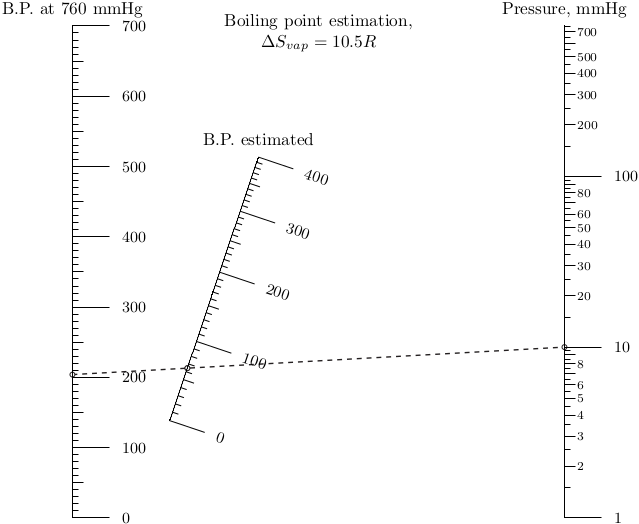
, , . Trouton–Hildebrand–Everett:
:
. .
from math import log
from pynomo.nomographer import *
import sys
sys.path.insert(0, "..")
Pressure = {
'u_min': 1.0,
'u_max': 760.0,
'function': lambda u: log(u / 760.0),
'title_y_shift': 0.55,
'title': r'Pressure, mmHg',
'tick_levels': 3,
'tick_text_levels': 2,
'scale_type': 'log smart',
}
BP_guess = {
'u_min': 0.0,
'u_max': 400.0,
'function': lambda u: 1/(u + 273.15),
'title_y_shift': 0.55,
'title': r'B.P. estimated',
'tick_levels': 4,
'tick_text_levels': 2,
'scale_type': 'linear smart',
}
BP_at_atm = {
'u_min': 0.0,
'u_max': 700.0,
'function_3': lambda u: (u + 273.15)*(4.5 + log(u + 273.15)),
'function_4': lambda u: -(4.5 + log(u + 273.15)),
'title_y_shift': 0.55,
'title': r'B.P. at 760 mmHg',
'tick_levels': 4,
'tick_text_levels': 2,
'scale_type': 'linear smart',
}
block_1_params = {
'block_type': 'type_10',
'width': 10.0,
'height': 10.0,
'f1_params': Pressure,
'f2_params': BP_guess,
'f3_params': BP_at_atm,
'isopleth_values': [[10, 'x', 204]]
}
main_params = {
'filename': 'ex_type10_nomo_1.pdf',
'paper_height': 10.0,
'paper_width': 10.0,
'block_params': [block_1_params],
'transformations': [('rotate', 0.01), ('scale paper',)],
'title_y': 0.55,
'title_str': r'Boiling point estimation, $\Delta S_{vap} = R(4.5 + \ln T)$'
}
Nomographer(main_params)
!
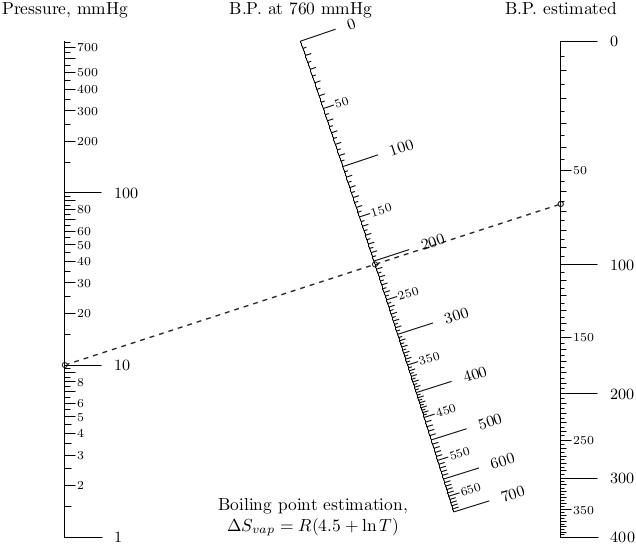
, . , — , . , , . .
10% !
