Fig 1.
The above text is a continuation of already published articles.
Part One
Part Two
Let's take from 1C such features as: query language, dynamic list, data composition system.
Something from a rich set of libraries will come in handy from Python. For example, technical analysis libraries:
We need the 1C "Processing" mechanism. Using it, we will execute Python scripts and display the resulting result on the screen or save it in the 1C database.
Fig 2.

To transfer data to Python, we will select one or more tools.
Fig 3.

Let's provide general processing settings depending on the selected script. This is the text of the script itself, an option for transferring data from 1c to Python and vice versa.
Fig 4. General settings for export import files

Fig 5. Selection of the output and analyzed data itself

Fig 6. Let's provide for the possibility of receiving an output stream and Python errors in 1C.

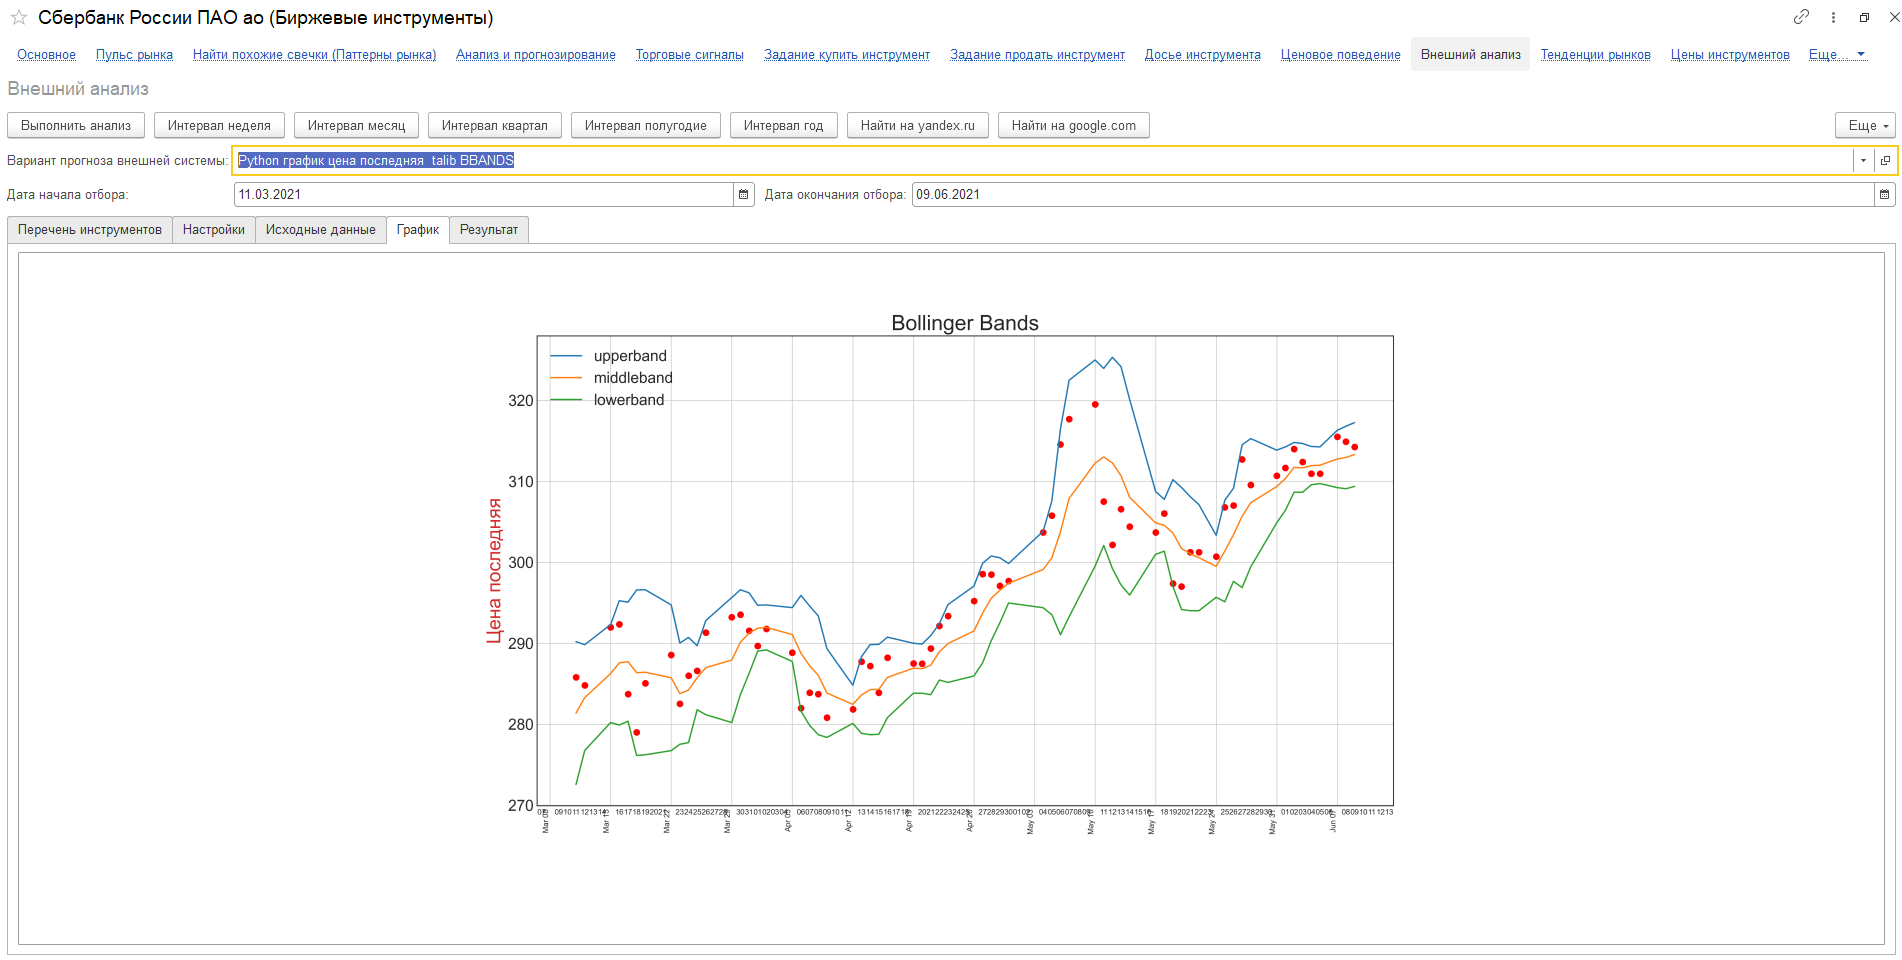
Fig 7. And of course the graph. The result of what we all started this for

Fig 8.

To save space, we are compatible with complex graphics. But a simple script fix will allow you to split them into different charts, as it is done in a classic way.
Fig 9.

Remembering that we have two technical analysis libraries, we will create the ability to display each chart. We get 120 charts (some of the indicators are repeated in the libraries).
Before we jump into Python machine learning, let's take a moment to stop. Let's create the ability to transfer and store indicators calculated by Python in 1C.
Fig 10.

Fig 11.

Having measured the average speed of calculating all Python indicators and transferring them to 1C, we get 20 seconds for each exchange instrument. That in the presence of 340 exchange instruments, it will take about 2 hours for their full recalculation. When working on an interval of 1 day, this turns out to be a completely acceptable indicator. But even if it seems to us that the time for a complete recalculation is too long, we will remember that scheduled tasks can be made running in parallel on several cores / processors of the server. Accordingly, doubling the number of scheduled jobs will halve the full recount time. Etc.
What we got:
- We got the opportunity to almost instantly generate Python graphs and display them in 1C.
- Storing technical indicators calculated by Python in 1C, and therefore the possibility of using them in the query language, reports.
- The ability to connect analysis and forecasting tools 1C. For example 1C Analytics.
v8.1c.ru/platforma/1s-analitika
Details can be found in the documentation
To be continued ...