Nature does not have bad weather, every weather is grace. The words of this lyric song can be understood figuratively, interpreting the weather as a relationship between people. It can be understood literally, which is also true, because there would be no snowy and cold winter, we would not value summer so much, and vice versa. But unmanned vehicles are devoid of lyrical feelings and poetic outlook, for them not all the weather is grace, especially winter. One of the main problems faced by the developers of "robotic vehicles" is the decrease in the accuracy of sensors that tell the car where to go during bad weather conditions. Scientists from Michigan Technological University have created a database of weather conditions on the roads "through the eyes" of unmanned vehicles. This data was needed in order to understand what needs to be changed or improved so that the vision of robotic vehicles during a snowstorm is no worse,than on a clear summer day. How bad weather affects the sensors of unmanned vehicles, what method of solving the problem do scientists propose, and how effective is it? We will find answers to these questions in the report of scientists. Go.
Basis of research
The work of self-driving cars can be compared to an equation in which there are a lot of variables that must be taken into account without exception to obtain the correct result. Pedestrians, other cars, the quality of the road surface (visibility of the dividing lines), the integrity of the systems of the drone itself, etc. Many researches of scientists, provocative statements of politicians, sharp articles of journalists are based on the connection between an unmanned vehicle (hereinafter simply a car or a car) and a pedestrian. This is quite logical, because a person and his safety should come first, especially given the unpredictability of his behavior. Moral and ethical disputes about who will be to blame if a car hits a pedestrian who jumped out onto the road continues to this day.
However, if we remove the variable "pedestrian" from our figurative equation, then there will still be many potentially dangerous factors. The weather is one of them. Obviously, in bad weather (rainstorm or snowstorm), visibility can decrease so much that sometimes you just have to stop, because it is unrealistic to drive. The vision of cars, of course, is difficult to compare with the vision of a person, but their sensors suffer from reduced visibility no less than we do. On the other hand, cars have a wider arsenal of these sensors: cameras, millimeter wave (MMW) radars, global positioning systems (GPS), gyro stabilizer (IMU), light detection and ranging (LIDAR), and even ultrasonic systems. Despite this variety of senses, autonomous cars are still blind during bad weather.
In order to understand what is the matter, scientists propose to consider aspects, the totality of which in one way or another affects a possible solution to this problem: semantic segmentation, detection of a traversable (suitable) path and combining sensors.
With semantic segmentation, instead of detecting an object in an image, each pixel is classified individually and assigned to the class that the pixel best represents. In other words, semantic segmentation is a pixel-level classification. Classical semantic segmentation - convolutional neural network (CNN from Convolutional neural network A ) - consists of a coding and decoding networks.
The coding network downsamples the input data and extracts functions, and the decoding network uses these functions to recover and upsamples the input data and finally assigns a class to each pixel.
The two key components in decoding networks are the so-called MaxUnpooling layer and the Transpose convolution layer. The MaxUnpooling layer (an analogue of the MaxPooling layer - a pooling operation with a maximum function) is required to reduce the dimension of the processed data.
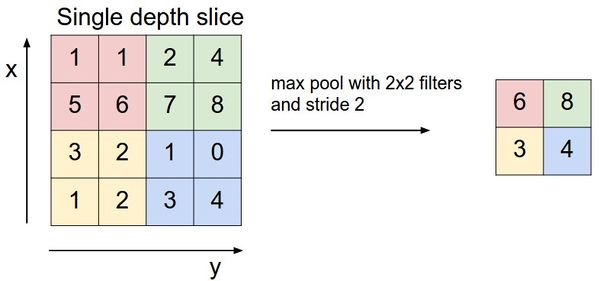
An example of the MaxPooling operation.
There are several methods for distributing values (i.e., pulling) that have the common goal of storing the locations of the maximum values in the MaxPooling layer and using those locations to place the maximum values back to matching locations in the corresponding MaxUnpooling layer. This approach requires the codec network to be symmetric, in which each MaxPooling level in the encoder has a corresponding MaxUnpooling level on the decoder side.
Another approach is to place the values in a predetermined location (for example, in the upper left corner) in the area that the kernel points to. It was this method that was used in modeling, which will be discussed a little later.
A transposed convolutional layer is the opposite of a regular convolutional layer. It consists of a moving core that scans the input and convolves the values to fill the output image. The output volume of both layers, MaxUnpooling and Transpose, can be controlled by adjusting the kernel size, padding and pitch.
The second aspect, which plays an important role in solving the problem of bad weather, is the detection of a passable path.
A walkable path is a space in which a car can move safely in a physical sense, i.e. carriageway detection. This aspect is extremely important for various situations: parking, poor road markings, poor visibility, etc.
According to scientists, the detection of a passable path can be implemented as a preliminary step towards detecting a lane or any object. This process stems from semantic segmentation, the purpose of which is to generate a pixel-by-pixel classification after training on a pixel-mapped dataset.
The third, but no less important, aspect is sensor fusion. This means literally combining data from multiple sensors to obtain a more complete picture and reduce the likely errors and inaccuracies in the data of individual sensors. There is a homogeneous and heterogeneous pooling of sensors. An example of the former would be the use of multiple satellites to refine a GPS location. An example of the second is combining camera data, LiDAR and Radar for self-driving cars.
Each of the above sensors, individually, does indeed show excellent results, but only in normal weather conditions. In harsher working conditions, their shortcomings become apparent.
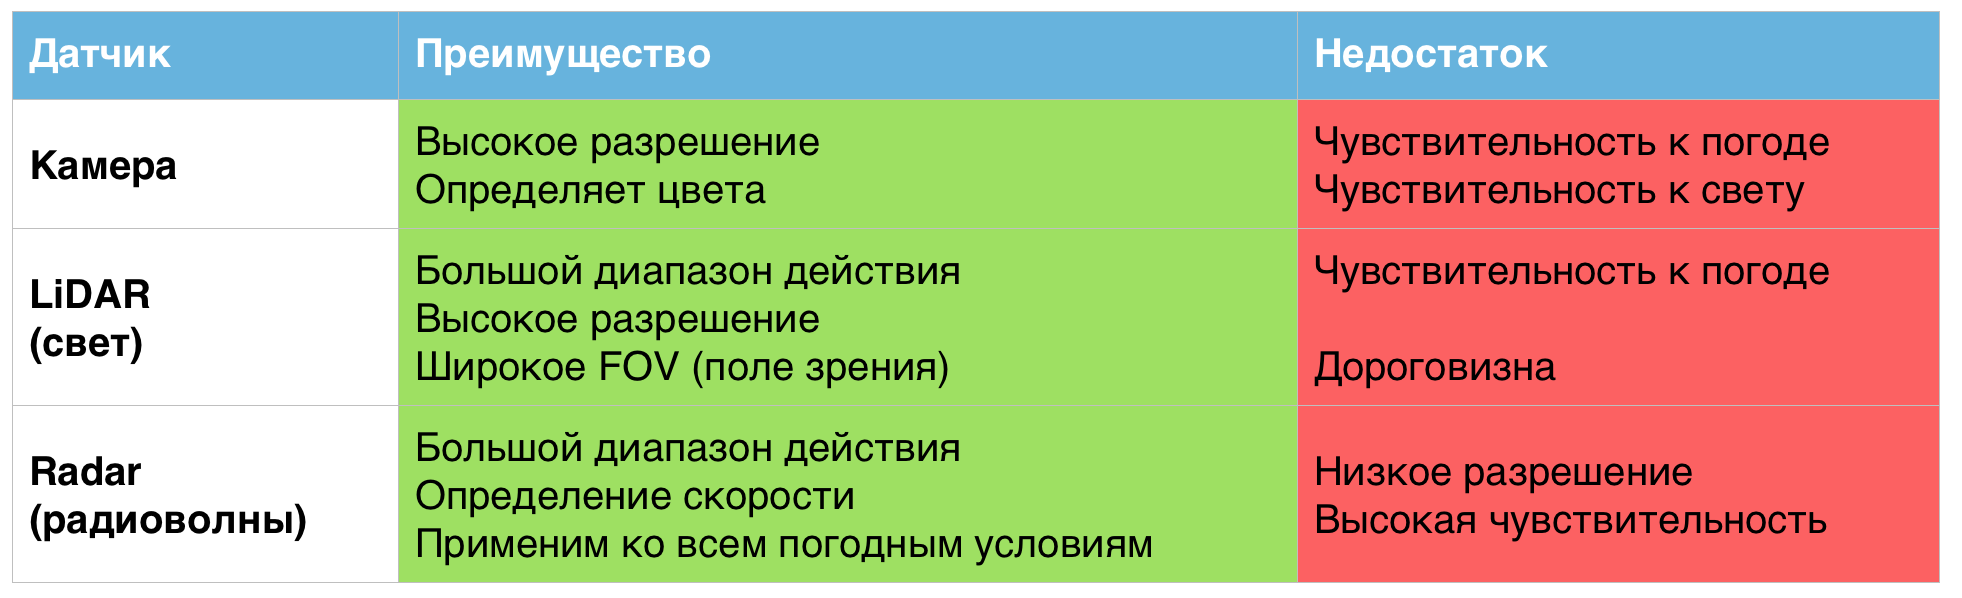
A table of the advantages and disadvantages of sensors used in unmanned vehicles.
That is why, according to scientists, combining these sensors into a single system can help solve problems associated with bad weather conditions.
Data collection
In this study, as mentioned earlier, convolutional neural networks and sensor fusion were used to solve the problem of finding a path to drive in adverse weather conditions. The proposed model is a multi-threaded (one thread per sensor) deep convolutional neural network that will downsample the function maps (the result of applying one filter to the previous layer) of each stream, combine the data, and then re-upsample the maps to perform pixel-by-pixel classification.
To carry out further work, including calculations, modeling and testing, a lot of data was needed. The more, the better, the scientists themselves say, and this is quite logical when it comes to the operation of various sensors (cameras, LiDAR and Radar). Among the many already existing datasets, DENSE was chosen, which covers most of the nuances necessary for research.
DENSEis also a project aimed at solving the problems of finding a way in severe weather conditions. Scientists working on DENSE traveled about 10,000 km across Northern Europe, recording data from multiple cameras, multiple LiDARs, radars, GPS, IMUs, road friction sensors and thermal imaging cameras. The dataset consists of 12,000 samples, which can be broken down into smaller subgroups describing specific conditions: day + snow, night + fog, day + clear, etc.
However, for the model to work correctly, it was necessary to correct the data from DENSE. The original camera images in the dataset are 1920 x 1024 pixels and have been scaled down to 480 x 256 for faster training and model testing.
LiDAR data is stored in a NumPy array format that needed to be converted to images, scaled (up to 480 x 256) and normalized.
Radar data is stored in JSON files, one file for each frame. Each file contains a dictionary of detected objects and several values for each object, including x-coordinates, y-coordinates, distance, speed, etc. This coordinate system is parallel to the plane of the vehicle. To convert it to a vertical plane, only the y-coordinate needs to be considered.
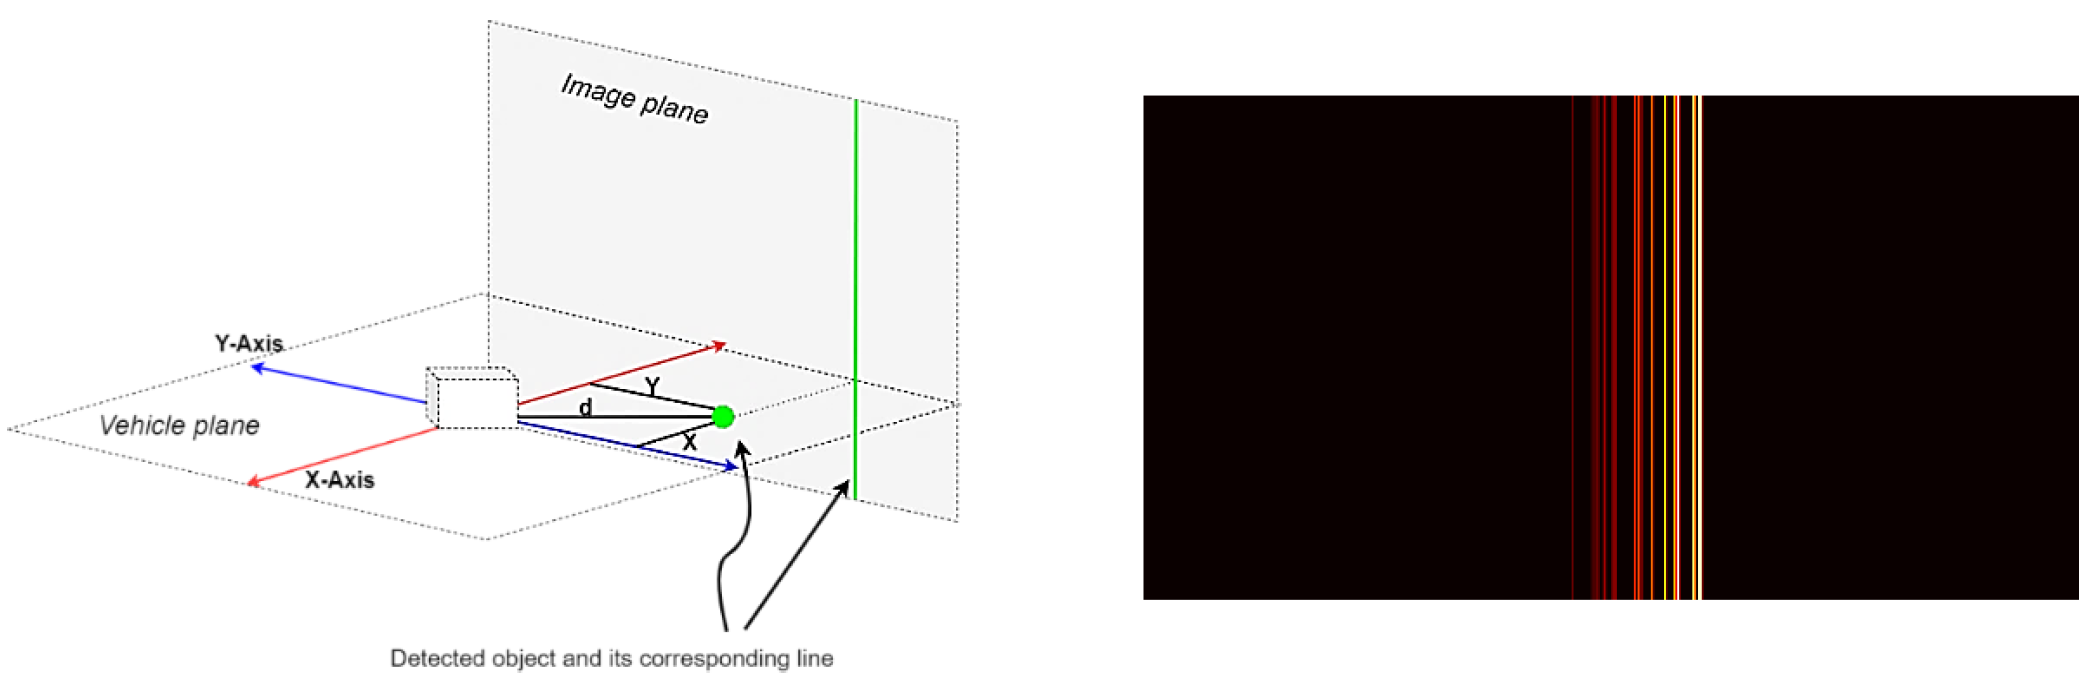
Image # 1: projection of the y-coordinate onto the image plane (left) and the processed radar frame (right).
The resulting images were scaled (up to 480 x 256) and normalized.
Developing a CNN model
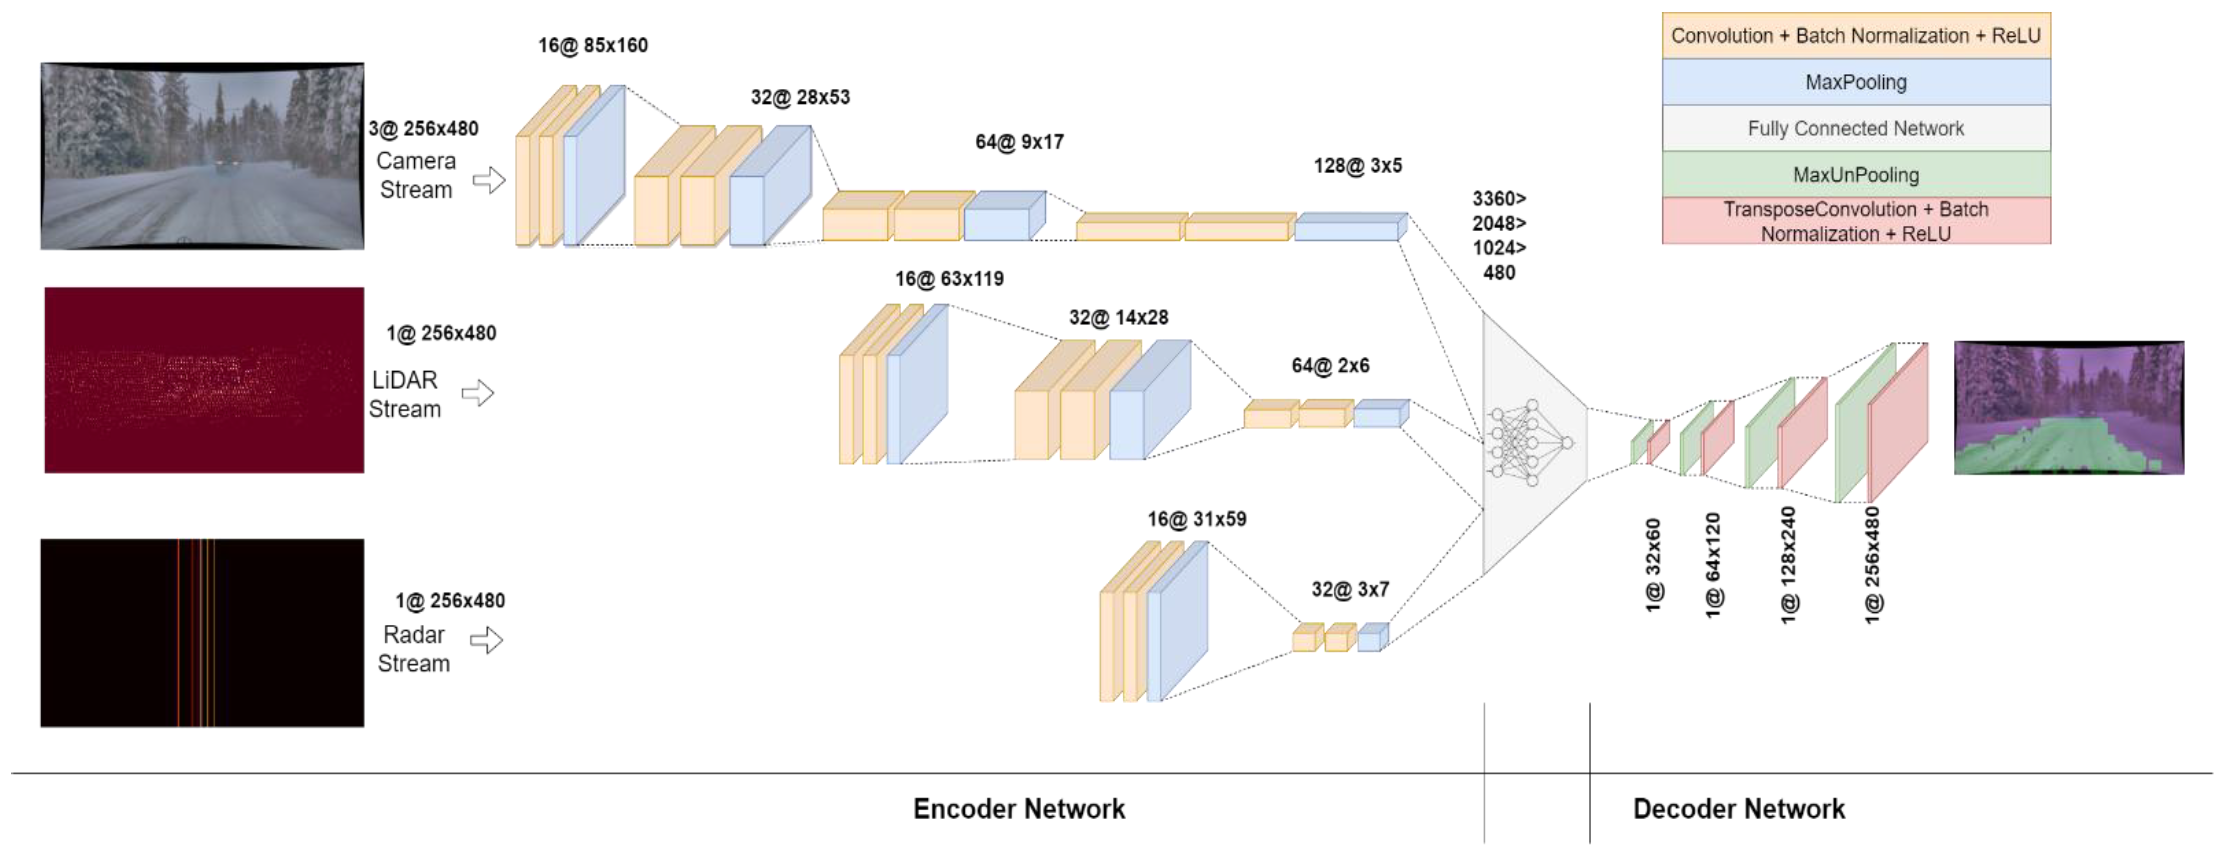
Image # 2: The architecture of the CNN model.
The network was designed to be as compact as possible, as deep codec networks require a lot of computational resources. For this reason, the decoding network was not designed with as many layers as the coding network. The coding network consists of three streams: camera, LiDAR, and radar.
Since the camera images contain more information, the camera stream is made deeper than the other two. It consists of four blocks, each of which consists of two convolutional layers - a batch normalization layer and a ReLU layer, followed by a MaxPooling layer.
LiDAR data is not as massive as data from cameras, so its stream consists of three blocks. Likewise, the Radar stream is smaller than the LiDAR stream, therefore it consists of only two blocks.
The output from all streams is modified and combined into a one-dimensional vector, which is connected to a network of three hidden layers with ReLU activation. The data is then converted into a two-dimensional array, which is passed to a decoding network consisting of four consecutive MaxUnpooling and transposed convolution steps to up-sample the data to an input size (480x256).
CNN model training / testing results
Training and testing was done on Google Colab using GPU. The hand-tagged subset of data consisted of 1000 camera, LiDAR, and radar data samples — 800 for training and 200 for testing.
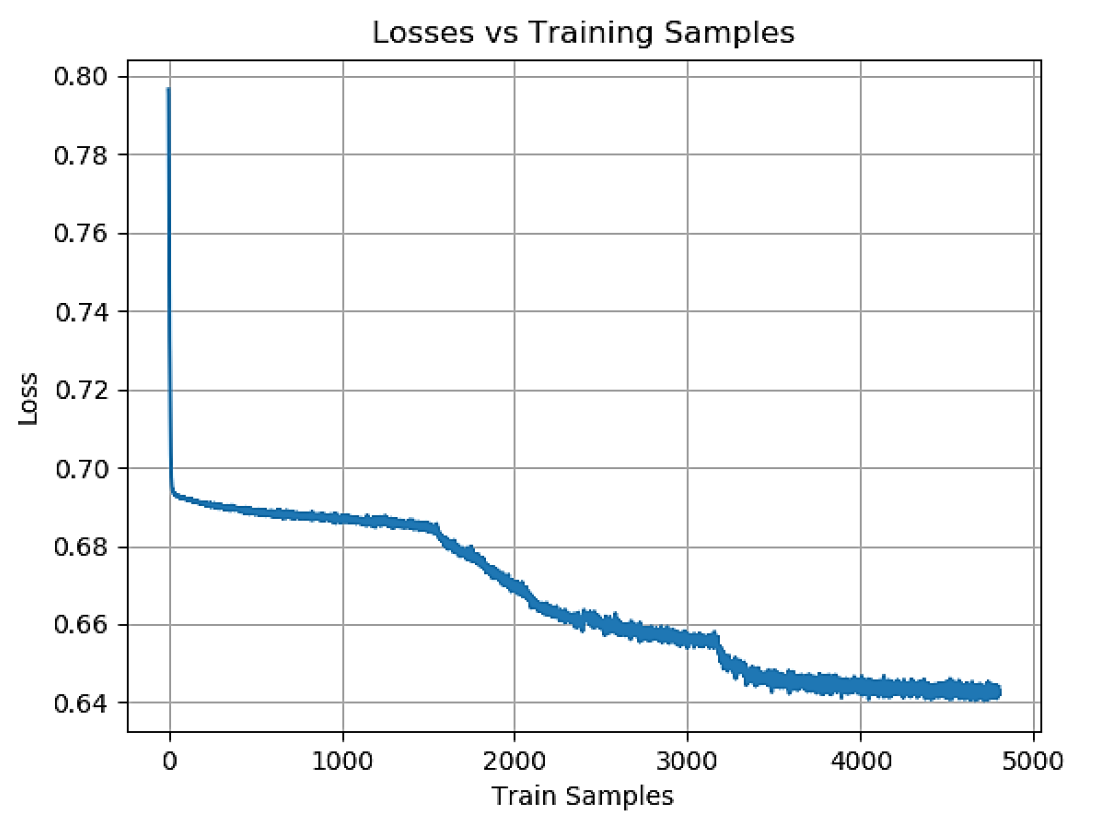
Image # 3: Loss in training samples during the training phase.
The output of the model was post-processed with image expansion and erosion with different kernel sizes to reduce the amount of noise in the pixel classification output.
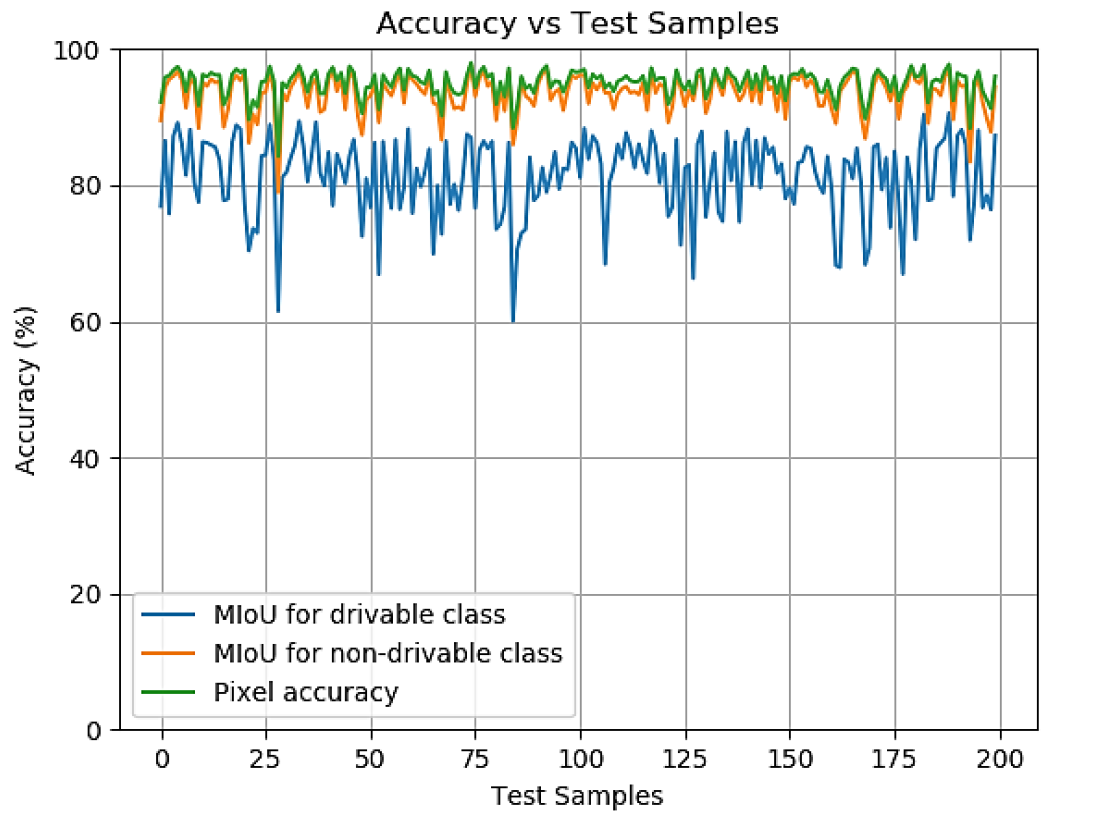
Image # 4: Accuracy in test samples during the testing phase.
Scientists note that the simplest indicator of system accuracy is pixel, i.e. the ratio of correctly defined pixels and incorrectly defined pixels to the image size. Pixel accuracy was calculated for each sample in the test set, and the average of these values represents the overall accuracy of the model.
However, this figure is not ideal. In some cases, a certain class is underrepresented in the sample, from which the pixel accuracy will be significantly higher (than it actually is) due to the fact that there are not enough pixels to test the model for a certain class. Therefore, it was decided to additionally use MIoU - the average ratio of the intersection area to the union area.
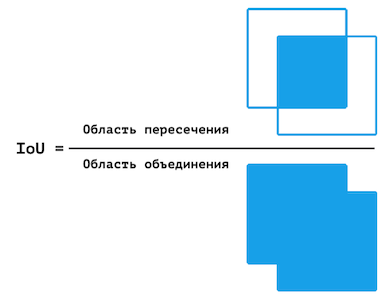
Visual representation of the IoU.
Similar to pixel precision, IoU precision is calculated for each frame, and the final precision is the average of these values. However, MIoU is calculated for each class separately.

Precision value table.
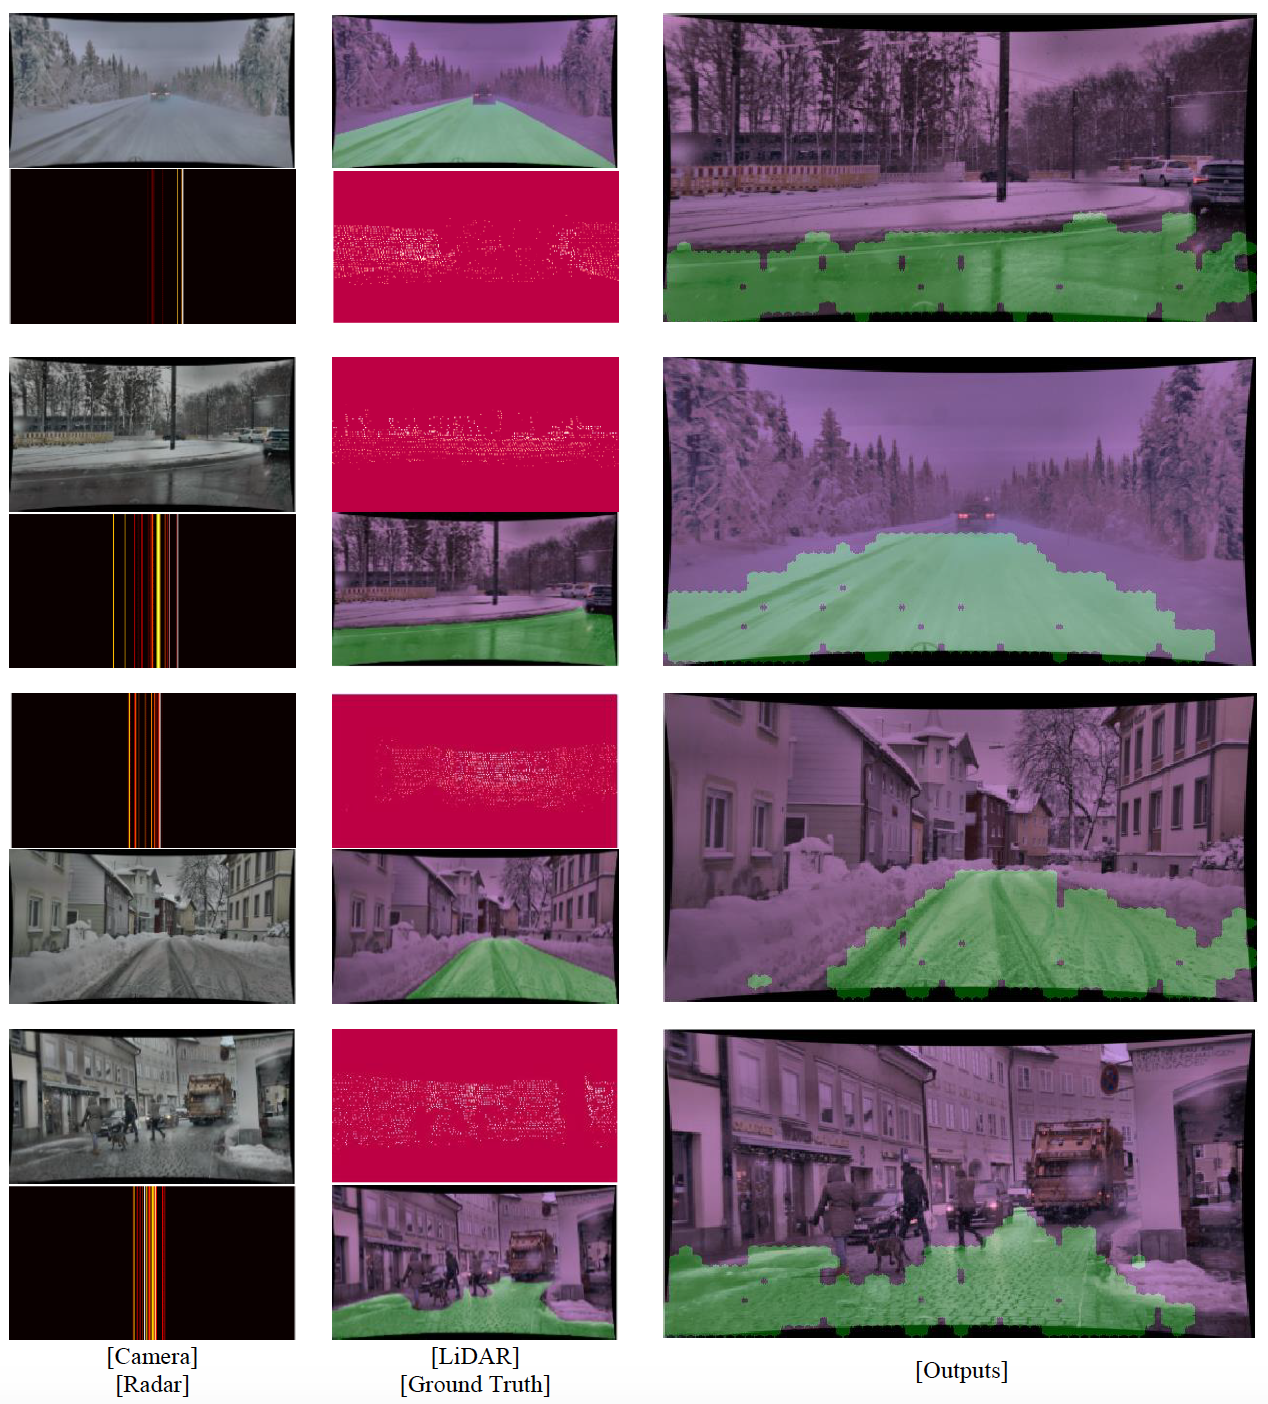
Image # 5
The image above shows four selected frames of snow movement from camera, LiDAR, radar, ground data, and model output. It is evident from these images that the model can delineate the general circumference of the area in which the vehicle can move safely. The model ignores any lines and edges that could otherwise be interpreted as the edges of the carriageway. The model also performs well in low visibility conditions (eg fog).
The model also avoids pedestrians, other cars and animals, although this was not the main goal of this particular study. However, this particular aspect needs to be improved. However, given that the system consists of fewer layers, it learns much faster than its predecessors.
For a more detailed acquaintance with the nuances of the study, I recommend that you look into the report of scientists and additional data to it.
Epilogue
The attitude towards self-driving cars is ambiguous. On the one hand, the robo-car negates such risks as the human factor: drunk driver, recklessness, irresponsible attitude to traffic rules, little driving experience, etc. In other words, the robot does not behave like a human. That's good, isn't it? Yes and no. Autonomous vehicles outperform flesh-and-blood drivers in many ways, but not in all. Bad weather is a prime example of this. Of course, it is not easy for a person to drive during a snowstorm, but for unmanned vehicles it was almost unrealistic.
In this work, scientists drew attention to this problem, proposing to make machines a little more human. The fact is that a person also has sensors that work in teams so that he receives maximum information about the environment. If the sensors of an unmanned vehicle also work as a single system, and not as separate elements of it, it will be possible to obtain more data, i.e. to improve the accuracy of finding the passable path.
Of course, bad weather is a collective term. For some, light snowfall is bad weather, but for others it is a hail storm. Further research and testing of the developed system should teach it to recognize the road in all weather conditions.
Thanks for your attention, stay curious and have a good work week, guys. :)
A bit of advertising
Thank you for staying with us. Do you like our articles? Want to see more interesting content? Support us by placing an order or recommending to friends, cloud VPS for developers from $ 4.99 , a unique analogue of entry-level servers that we have invented for you: The Whole Truth About VPS (KVM) E5-2697 v3 (6 Cores) 10GB DDR4 480GB SSD 1Gbps from $ 19 or how to divide the server correctly? (options available with RAID1 and RAID10, up to 24 cores and up to 40GB DDR4).
Is Dell R730xd 2x cheaper in Maincubes Tier IV data center in Amsterdam? Only we have 2 x Intel TetraDeca-Core Xeon 2x E5-2697v3 2.6GHz 14C 64GB DDR4 4x960GB SSD 1Gbps 100 TV from $ 199 in the Netherlands!Dell R420 - 2x E5-2430 2.2Ghz 6C 128GB DDR3 2x960GB SSD 1Gbps 100TB - From $ 99! Read about How to Build the Infrastructure of Bldg. class with the use of Dell R730xd E5-2650 v4 servers at a cost of 9000 euros for a penny?