Needless to say, I could hardly wait for the weekend to do my checks. Let's take a look at the test results. And to make it more interesting, along the way we will consider the technology of displaying variables "on the fly", without stopping the processor core. Well, and the technology of visual debugging of elf files collected by batch compilers.
What kind of testing we will conduct
The essence of testing was discussed in the comments to the previous article. The original PC program sends data. Which is not important. Data, and that's it. The controller accepts this data and safely ignores it. Because the issue was the transmission speed. New libraries can theoretically either skip some data, or mix up a pair of buffers. Therefore, the flow must become time-varying. In such cases, either a pseudo-random sequence or incremental data is sent.
Not wanting to spend a lot of time on generating a pseudo-random sequence for the source and destination (the algorithm must be the same), I limited myself to an incremental 32-bit word. The main disadvantage of this approach is that up to three out of four bytes can coincide in neighboring packets. But one, and the very first, will differ. So for today's test, it seems acceptable to me.
The fact is that the USB protocol is packet. And the packet itself is caught at the hardware level. There should not be a situation inside the block that a byte is corrupted, and then useful data is sent again. At least because of the problems that we want to catch in libraries now, this will not arise. If the data will be corrupted, then globally. If the old data is overwritten with new ones, then the first byte will be overwritten first, and it is different in different packets.
In principle, everyone will be able to rewrite my code to another version of the test data ... Today, I will simply send an incrementing 32-bit word, and when receiving it, I will check that the increment goes without breaking the sequence.
How will we track the result
How are we going to find out that everything works? One LED will not be enough. Well, in order to add a UART, you have to hardcode someone else's code. You can make your mistakes. Let's use a functionality that I have known about for a long time, but have always used it only in the Keil development environment. Today I will show you how to use it in Eclipse. From the comments to the last article, I realized that not everyone knows about this technology.
The JTAG debug port allows work only when the processor core is stopped. This is not acceptable for USB. There, and during normal operation, stops are fraught with timeouts, and in our case, even if we do not catch the timeout, the speed may be underestimated. Fortunately, the SWD debug port allows you to monitor memory on the fly. Back in 2016, I checked using an oscilloscope, which allows you to set synchronization by pulse duration, access to memory by SWD practically does not slow down the processor core. But how do we use it?
The first thing we will rely on today is the ability of CubeIDE (which is a doped Eclipse) to display variables on the fly. We will create a group of variables, where the program will display a lot of useful information, and we will start tracking them on the screen. Many people know about this, but so far not everyone. Let everyone know now.
And the second is what the guys and I recently found. No one in our office knew this. It turns out that if you build a project with a batch compiler, embedding Dwarf-2 debug information into it, then this elf file can be opened in Eclipse for debugging and you can get a full link with its sources. At the same time, the sources themselves do not need to be connected to the project.The debugger will automatically pull in paths to them from the debug information. Now I always do that. A GCC or CLang project is assembled, and I just connect elf to the Eclipse and trace it, without wasting time connecting the project itself to this Eclipse. Sometimes they even send me elf files collected by toolchains that are not on my machine. Even compiled in Linux (and I work with Windows). The method works even in these cases, as long as the project is sent in a complete set: elf and its sources. Today it will help us not to finalize the author's projects in terms of their structure. I'll just build everything on the basis of the "native" makefile, and then connect with the debugger to the elf file.
We train to connect
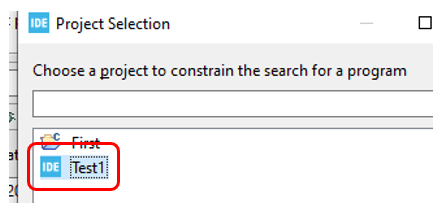
The first thing we need to do in CubeIDE is a project for STM32F103. "Wait a minute!", The attentive reader exclaims ... "The author just promised that he won't have to do anything with the original project !!!" That's all right. This is the quirk of CubeIDE. We need a project for STM32F103. Any. The main thing is that it is under STM32F103. We create it, collect it and forget it. What is in it is not important. The very fact of its existence in the development environment is important.
Now in CubeIDE we go to the debugger settings. For example, like this:
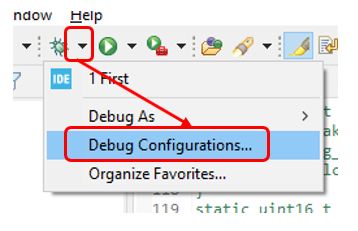
We would not have to pervert with the creation of the left project if we selected the GDB Hardware Debugging item. I always choose it in regular Eclipses. I tried to select it here:
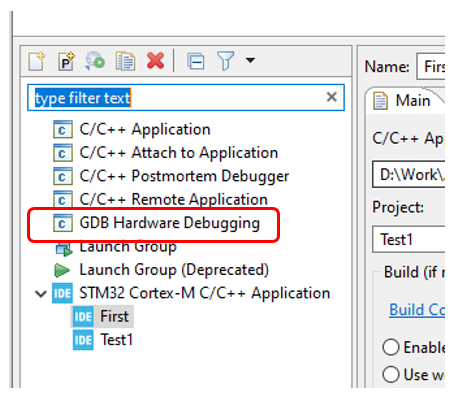
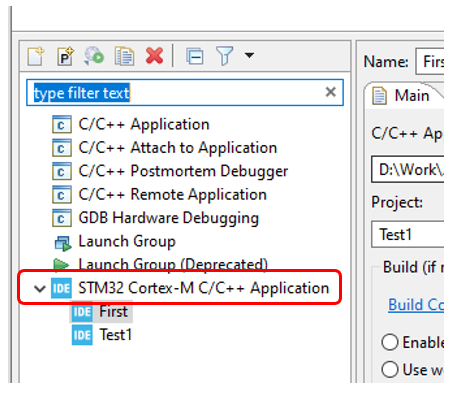
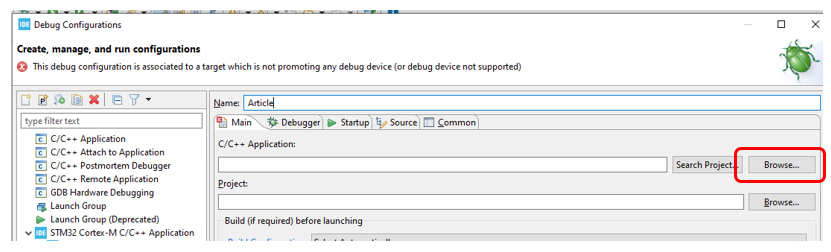
Alas. The left project will not be needed, but the functionality of displaying variables in real time is said to be unavailable. Therefore, alas and ah. Choose STM32 Cortex-M C / C ++ Application. I already have two configurations there. Now, to make sure that I have not deceived you, I will create a third. To do this, I double-click here:
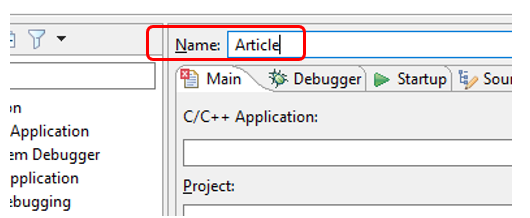
I will name the configuration Article:
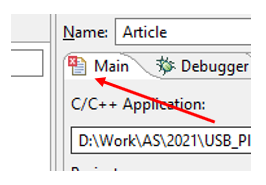
You need to select the path to the elf file:
I chose this path (there should be no Russian letters anywhere in the path):

And here the error flashes. Here it is, the red one:
To remove it, I have to select a project tied to STM32F103. This is where you need to poke into Browse:
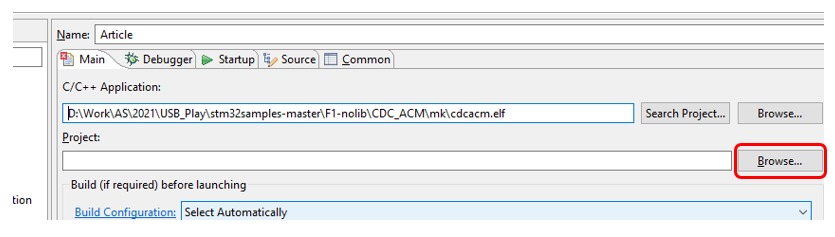
And select the previously created left project.
The red (sign of error) is gone:
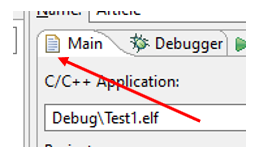
Oops! In this figure, you can see that after selecting a project, the name of the elf file jumped off. The elf of this project was registered. I had to select the one I needed after specifying the project again. No wonder I went over all the points.
Since we have nothing to collect here (we collect everything in batches), we need to check the box so that the system does not try to do useless work:

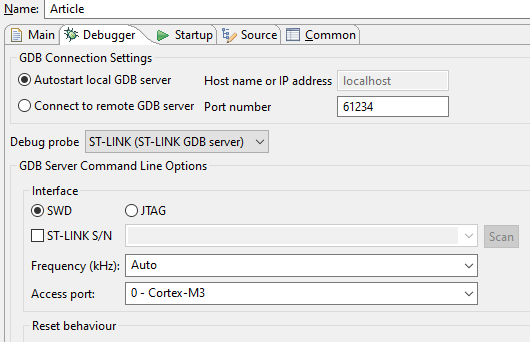
On this tab - everything. Go to the Debugger tab. True, nothing needs to be changed here. At least, if everything is set up in the same way:
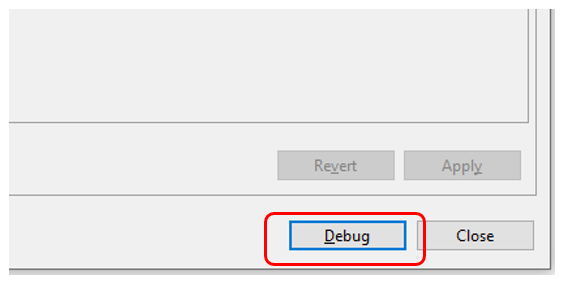
Actually, you don't need to change anything anywhere else. Well, let's start debugging?
Technically, yes. Organizationally - we first need to prepare the code that we will run.
Checking the first library
So, download the project stm32samples / F1-nolib / CDC_ACM at master eddyem / stm32samples GitHub for authorship EddyEm...
Do not forget to add the formation of debug information dwarf-2 to the makefile:

The same with the text:
CFLAGS += -O2 -g -gdwarf-2 -D__thumb2__=1 -MD
We start to edit the code.
There is an infinite loop in the main () function. I will leave only horns-yes-legs from him:
while (1){ IWDG->KR = IWDG_REFRESH; // refresh watchdog usb_proc(); get_USB(); }
I will make a working get_USB () function like this:
uint32_t loop = 0; uint32_t errors = 0; uint32_t errState = 0; int32_t lastData = 0; int32_t show = 0; int32_t pkt = 0; #define USBBUF 63 char tmpbuf[USBBUF+1]; int32_t* pData = (int32_t*) tmpbuf; // usb getline char *get_USB() { int x = USB_receive((uint8_t*)tmpbuf) / sizeof(uint32_t); int i; show += 1; if(!x) return NULL; pkt += 1; // - // ! if (pData [0] == 0) { lastData = 0; errState = 0; loop += 1; } // if (errState) { return NULL; } // for (i=0;i<x;i++) { // ! if (pData[i]!=lastData++) { // ! errState = 1; // errors += 1; // return NULL; } } // return NULL; }
A bunch of global variables are made in order to monitor them in real time. The locals are lost on every startup. The global ones are visible forever.
The show variable will indicate that the debugger is actually displaying everything. It is incremented each time the function is entered, whether there was data or not. And we call the function in an infinite loop all the time.
The variable pkt will show that the data is really coming (at first it did not come from me). It will increase only if we did not exit due to the fact that there was nothing from USB.
lastDatawill show how many we have already counted in the test. It will make sure that we are really working with large blocks of data. The value of this variable at the end of the test shows the block size in double words. To understand how many bytes have passed, you need to multiply the value by 4.
Loop will increase when a block of data arrives starting at zero. Roughly speaking, this is the test number. Well, or the run number. When I collect statistics for plotting, there are quite a few of these runs. Different sizes of the requested blocks, multiplied by repetitions to average the results.
errState- an auxiliary variable that prevents the appearance of a snowball of errors. At the first error, it flies up to one and stops analyzing the data before starting a new test.
errors - the counter of the errors that occurred once. At first, I myself was mistaken in the logic, then this counter was constantly increasing. But if everything is good, it should not increase.
I almost forgot. I also commented out the check of the flag in the USB_receive function:
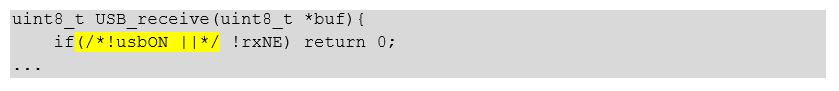
The same with the text:
uint8_t USB_receive(uint8_t *buf){ if(/*!usbON ||*/ !rxNE) return 0; ...
This flag is set when the terminal sets the speed of the virtual COM port. My test program, on the other hand, opens the device directly through the WinUSB driver and does nothing to customize the CDC functionality. The easiest thing to do was to ignore this flag.
Well. Build the project with a batch compiler and run it in the CubeIDE debugger. As I was told, not all readers like animated drawings. For some, they distract from reading the text. But this is really nice to see.
It's ticking! It's ticking! It's ticking!
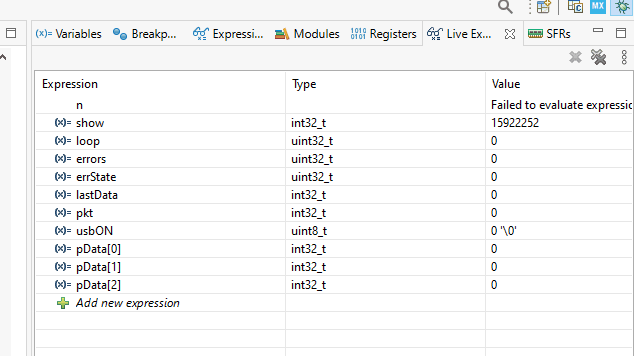
Well. Add array filling to the testing program:
QByteArray data; data.resize(totalSize); uint32_t* dwPtr = (uint32_t*) data.constData(); for (uint32_t i = 0;i<totalSize/4;i++) { dwPtr[i] = i; }
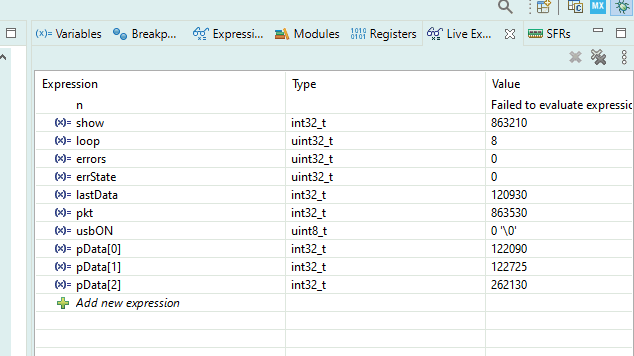
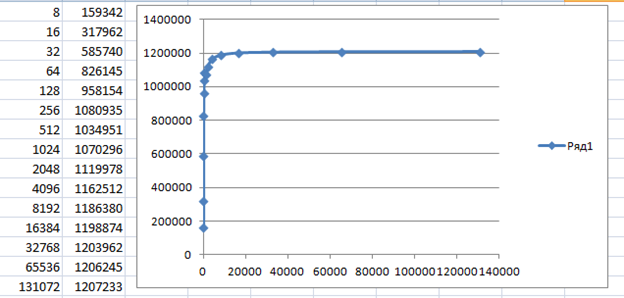
And we run the test. We get this kind of beauty in variables (zero errors):

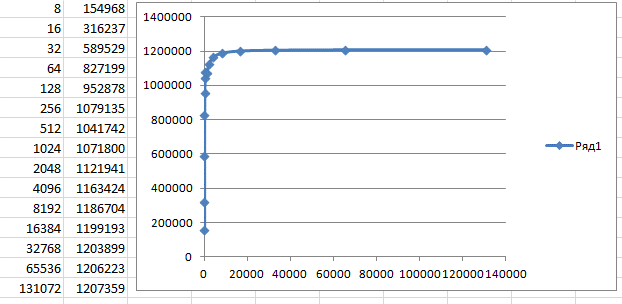
And here is a graph of the speed:

The values are slightly less than in a completely idle operation, but still pleasant. In general, ST-LINK has been added to my system, and the number of bits running over USB depends on the data being pumped (sometimes a sync bit can be inserted).
A spherical horse works in a vacuum, but what about the real one?
There is one potential problem with this entire system. Now the function of receiving data is constantly called in an infinite loop. We don't have any special useful jobs right now. And if they are? Then the call of this function may occur not immediately after the arrival of the packet, but with a delay.
Are we going to test different options? On the mind - it would be necessary, but there is no time. I'm currently busy at work with a completely different controller. And then I just had fun on the weekend. Therefore, we will go the other way. We will glue the reception of data to the fact of their arrival.
These things are done with interrupts. But in the last article it was said that if we stretch the USB interrupt handler, the hardware will start sending NAKs and all the charm of the library in question will come to naught. How do we get an interrupt, but not linger on the interrupt?
Well, the way is known here. In the USB interrupt handler, we must make it so that immediately after exiting it, the interrupt would also be triggered, but some other one. And there we will quickly, with a guaranteed low latency, take data from the hardware buffer into our internal one. What interruption to sit on? Examining the startup code. Namely, interrupt handlers. Our task is to find the unused one.
Here is the file of interest to us
\ stm32samples-master \ F1-nolib \ inc \ startup \ vector.c
Let me cheekily borrow an interrupt from the third UART. In fact, we do not use the first one either. But maybe it will be sometime later. And I have never used the third one in my life. Therefore, personally, I will sit down insolently on this particular handler. This is how it is described:
[NVIC_USART3_IRQ] = usart3_isr, \
Knowing the name, create a function in the main.c file:
void usart3_isr() { NVIC_ClearPendingIRQ(USART3_IRQn); get_USB(); }
This will be a kind of callback function. And already it will call us the code that we recently wrote. And let's comment out the call to get_USB () in an infinite loop.
Now we need to set this interrupt to a lower priority so that it does not interfere with anyone. In real life, you may have to be creative when choosing a priority. But today I'll just take the fifteenth. We add the following code to the initializing part of the main () function:
NVIC_SetPriority(USART3_IRQn, 15); NVIC_EnableIRQ(USART3_IRQn);
Well, now comes the fun part. In the USB interrupt handler, add a provocation to trigger the USART3 interrupt, if there was a call to our endpoint:

The same text.
#include "stm32f10x.h" … void usb_lp_can_rx0_isr(){ LED_off(LED0); if(USB->ISTR & USB_ISTR_RESET){ … } if(USB->ISTR & USB_ISTR_CTR){ // EP number uint8_t n = USB->ISTR & USB_ISTR_EPID; if (n == 1) { NVIC_SetPendingIRQ(USART3_IRQn); } // copy status register uint16_t epstatus = USB->EPnR[n]; // copy received bytes amount …
Since the priority is low, nothing will happen until the end of the USB interrupt. But as soon as it ends, they will immediately call us. Because we don't have any other interrupts yet. Even with the fifteenth priority, we will be the VIPs.
We launch. At first it is scary that the show variable is not increasing. But it normal. Now the function is not called unconditionally, but only after the actual interruption. So we need to start testing.
You can watch the testing process forever.
And here is the speed metric:
Checking the second library
Now we check the usb / 5.CDC_F1 library at main COKPOWEHEU / usb GitHub authored COKPOWEHEU... A description of this library can be found here: USB on registers: STM32L1 / STM32F1 / . This is where we are provided with callback functions to handle endpoint activity. Here we will fix it. The show variable is no longer needed. We are always called upon arrival of data. Otherwise, we get practically the same code.
uint32_t loop = 0; uint32_t errors = 0; uint32_t errState = 0; int32_t lastData = 0; int32_t pkt = 0; void data_out_callback(uint8_t epnum){ int i; uint8_t buf[ ENDP_DATA_SIZE ]; int32_t* pData = (int32_t*) buf; int len = usb_ep_read_double( ENDP_DATA_OUT, buf) / sizeof (uint32_t); if(len == 0)return; pkt += 1; // - // ! if (pData [0] == 0) { lastData = 0; errState = 0; loop += 1; } // if (errState) { return NULL; } // for (i=0;i<len;i++) { // ! if (pData[i]!=lastData++) { // ! errState = 1; // errors += 1; // return NULL; } } }
When checking with me, CubeIDE for some reason incorrectly determined the starting address. Perhaps there is some kind of incompatibility with the same "left" project. Let's postpone this for a separate study. Until I began to understand, but right at the start I entered the correct value of the PC register. The code ran and started working. We run the test. The number of errors is also zero:

The speed is also decent:
Conclusion
Both Russian USB libraries coped with rough load testing. None of them left the race. True, I know firsthand that testing does not prove the absence of errors, it reveals their presence. But the specifically cited tests did not reveal anything. This gives hope that any of these libraries can be used.
Along the way, we mastered the replacement of debug output by monitoring a number of variables in real time via the SWD port. In the rough, we also mastered the debugging of any batch-built applications in Eclipse, but along the way, due to the mixing of the two projects, I had some difficulties that I had to overcome by correcting the PC register directly. But in a regular Eclipse, this kind of mixing is not needed. And in the end, even with the help of a sickle, a hammer and some kind of mother, the ultimate goal was still achieved. Debugging has been done. At the same time, the source codes on Syakh were still displayed in Eclipse.
Afterword
When the article was already written, but was still in the process of uploading to Habr, such wonderful material appeared for authorship DSarovsky... There, too, access to USB is implemented, but this is done through a library made in my favorite style - the style of Konstantin Chizhov.
I just have to note the existence of a library made in such a beautiful version. At the moment, we checked the performance with its author and found out that so far its speed is typical, not maximum. But it is possible that by the time you read these lines, it has already been overclocked. Therefore, I will leave a link to it among others. She simply has to take off! Libraries in this style cannot help but take off!