
In a series of articles, I want to refute the misconceptions associated with memory management and take a deeper look at its structure in some modern programming languages - Java, Kotlin, Scala, Groovy, and Clojure. Hopefully this article will help you figure out what's going on under the hood of these languages. First, we'll look at memory management in the Java Virtual Machine (JVM) , which is used in Java, Kotlin, Scala, Clojure, Groovy, and other languages. In the first article, I also covered the difference between a stack and a heap, which is useful for understanding this article.
JVM memory structure
First, let's take a look at the JVM memory structure. This structure has been used since JDK 11 . This is how much memory is available to the JVM process, it is allocated by the operating system:
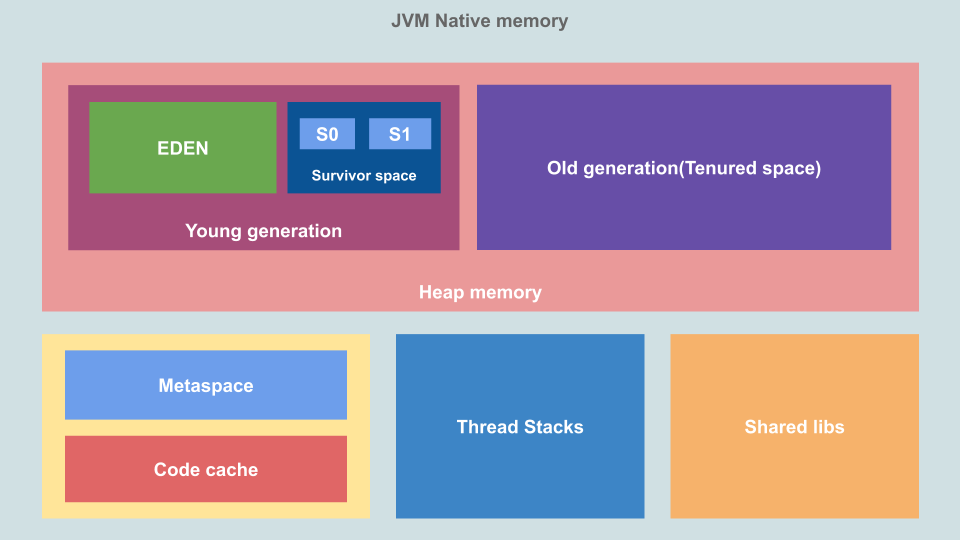
This is native memory allocated by the OS and its size depends on the system, processor, and JRE. What areas and what are they intended for?
Heap
This is where the JVM stores objects and dynamic data. This is the largest memory area and is where the garbage collector works. The heap size can be controlled with the
Xms
(initial size) and
Xmx
(maximum size) flags . The heap is not transferred to the virtual machine as a whole, some part is reserved as virtual space, due to which the heap can grow in the future. The heap is divided into spaces of the "young" and "old" generation.
- The young generation , or "new space": the area in which new objects live. It is divided into Eden Space and Survivor Space. The young generation area of control, " the younger garbage collector » (Minor GC), which is also called "the young» (Young GC).
- Paradise : This is where memory is allocated when we create new objects.
- Survivor area : This is where the objects left over from the minor garbage collector are stored. The area is divided into two halves, S0 and S1 .
- The old generation , or "storage" (Tenured Space): This includes objects that have reached the maximum storage threshold during the life of a junior garbage collector. This space is managed by a Major GC.
Thread stacks
This is a stack area in which one stack is allocated per thread. This is where thread-specific static data is stored, including method and function frames, and pointers to objects. The size of the stack memory can be set using a flag
Xss
.
Metaspace
This is part of native memory, by default it has no upper bound. In earlier versions of the JVM, this memory is called the permanent generation space (Permanent Generation (PermGen) Space) . Class loaders stored class definitions in it. If this space grows, then the OS can move the data stored here from RAM to virtual memory, which can slow down the application. This can be avoided by setting the size MetaSpace via flags
XX:MetaspaceSize
and
-XX:MaxMetaspaceSize
, in this case, the application may issue a memory error.
Code cache
This is where the Just In Time (JIT) compiler stores compiled blocks of code that you need to access frequently. Usually the JVM interprets the bytecode into native machine code, however the code compiled by the JIT compiler does not need to be interpreted, it is already in native format and cached in this memory area.
Shared Libraries
This is where the native code for any shared libraries is stored. This area of memory is loaded by the operating system only once for each process.
JVM memory usage: stack and heap
Now let's take a look at how the executable program uses the most important parts of memory. Let's use the code below. It is not optimized for correctness, so ignore problems like unnecessary intermediate variables, incorrect modifiers, and more. Its job is to visualize the use of the stack and heap.
class Employee {
String name;
Integer salary;
Integer sales;
Integer bonus;
public Employee(String name, Integer salary, Integer sales) {
this.name = name;
this.salary = salary;
this.sales = sales;
}
}
public class Test {
static int BONUS_PERCENTAGE = 10;
static int getBonusPercentage(int salary) {
int percentage = salary * BONUS_PERCENTAGE / 100;
return percentage;
}
static int findEmployeeBonus(int salary, int noOfSales) {
int bonusPercentage = getBonusPercentage(salary);
int bonus = bonusPercentage * noOfSales;
return bonus;
}
public static void main(String[] args) {
Employee john = new Employee("John", 5000, 5);
john.bonus = findEmployeeBonus(john.salary, john.sales);
System.out.println(john.bonus);
}
}
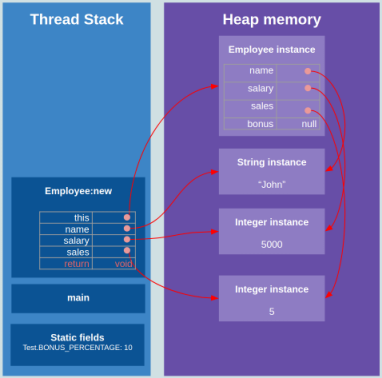
Here you can see how the above program is executed and how the stack and heap are used:
https://files.speakerdeck.com/presentations/9780d352c95f4361bd8c6fa164554afc/JVM_memory_use.pdf
As you can see:
- Each function call is pushed onto the thread of execution stack as a frame block.
- All local variables, including arguments and return values, are stored on the stack inside function frame blocks.
- int .
- Employee, Integer String , . .
- , , .
- , .
- ().
- , .
The stack is automatically managed by the operating system, not the JVM. Therefore, there is no need to take special care of him. But the heap is no longer managed this way, and since this is the largest area of memory containing dynamic data, it can grow exponentially, and the program can take up all of the memory over time. In addition, the heap gradually becomes fragmented, thereby slowing down the performance of applications. The JVM will help solve these problems. It automatically manages the heap using garbage collection.
JVM memory management: garbage collection
Let's take a look at automatic heap management, which plays a very important role in application performance. When a program tries to allocate more memory on the heap than is available (depending on the value
Xmx
), we get out of memory errors .
The JVM manages the heap using garbage collection. To make room for the creation of a new object, the JVM cleans up memory occupied by orphaned objects, that is, objects that are no longer directly or indirectly referenced from the stack.
The JVM garbage collector is responsible for:
- Getting memory from the OS and returning it to the OS.
- Transfer of allocated memory to the application upon its request.
- Determine which portions of the allocated memory are still in use by the application.
- Claiming unused memory for use by the application.
Garbage collectors in the JVM work on a generational basis (objects in the heap are grouped by age and cleaned up during different stages). There are many different garbage collection algorithms, but Mark & Sweep is the most commonly used one .
Garbage collector Mark & Sweep
The JVM uses a separate daemon thread that runs in the background for garbage collection. This process starts when certain conditions are met. The Mark & Sweep collector usually works in two stages, sometimes a third is added, depending on the algorithm used.

- Markup : First, the collector determines which objects are in use and which are not. Those that are used or accessed by stack pointers are recursively marked as alive.
- Removal : The collector walks through the heap and removes all objects that are not marked alive. These memory locations are marked as free.
- Compression : After removing unused objects, all surviving objects are moved so that they are together. This reduces fragmentation and speeds up memory allocation for new objects.
This type of collector is also called stop-the-world, because while they are removed, there are pauses in the application.
The JVM offers several different garbage collection algorithms to choose from, and depending on your JDK, there may be even more options (for example, the Shenandoah collector in OpenJDK). Authors of different implementations aim at different goals:
- Throughput : Time spent on garbage collection, not running the application. Ideally, the throughput should be high, that is, the garbage collection pauses are short.
- Pause Duration : How long the garbage collector has interfered with the execution of the application. Ideally, the pauses should be very short.
- Heap size : Ideally should be small.
Collectors in JDK 11
JDK 11 is the current LTE release. Below is a list of the garbage collectors available in it, and the JVM chooses one by default depending on the current hardware and operating system. We can always force a picker to be selected using a radio button
-XX
.
- : , , .
-XX:+UseSerialGC
. - : , . , / .
-XX:+UseParallelGC
. - Garbage-First (G1): ( ). , . .
-XX:+UseG1GC
. - Z: , , JDK11. . , stop-the-world. , / ( ).
-XX:+UseZGC
.
Regardless of which collector is selected, the JVM uses two types of assembly - the junior collector and the senior collector.
Junior Assembler
It maintains the cleanliness and compactness of the younger generation's space. It is launched when the JVM cannot get the necessary memory in heaven to accommodate a new object. Initially, all areas of the heap are empty. Paradise fills up first, followed by the survivors' area, and at the end of the vault.
You can see the progress of this collector here:
https://files.speakerdeck.com/presentations/f4783404769145f4b990154d0cc05629/JVM_minor_GC.pdf
- Let's say there are already objects in paradise (blocks 01 to 06 are marked as being used).
- The application creates a new object (07).
- JVM , , JVM .
- ( ), — ().
- JVM S0 S1 «» (To Space), S0. «» , , , .
- , .
- , - , ( 07 13 ).
- (14).
- JVM , , JVM .
- , , « ».
- JVM «» S1, S0 «». «» «» (S1), , . , «», , (premature promotion). , .
- «» (S0), .
- This is repeated with each session of the junior collector, the survivors move between S0 and S1, and their age increases. When it reaches the specified "maximum threshold", which is 15 by default, the object is moved to the "storage".
We looked at how the junior collector cleans up memory in the younger generation space. This is a stop-the-world process, but it is so fast that its duration can usually be neglected.
Senior Assembler
Monitors the cleanliness and compactness of the old generation space (storage). Runs under one of the following conditions:
- The developer calls in the program
System
.gc()
orRuntime.getRunTime().gc()
. - The JVM decides that the store is out of memory because it is full as a result of past sessions of the junior collector.
- If during the running of the junior collector, the JVM cannot get enough memory in paradise or survivor area.
- If we set a parameter in the JVM
MaxMetaspaceSize
and there is not enough memory to load new classes.
The senior collector's work process is simpler than the junior one:
- Let's say that many junior collector sessions have passed and the storage is almost full. The JVM decides to run the older collector.
- In storage, it recursively traverses the object graph starting from stack pointers and marks the used objects as (used memory), the rest as garbage (lost). If the senior collector was launched during the work of the junior collector, then his work covers the space of the younger generation (paradise and the area of the survivors) and the vault.
- The collector removes all orphaned objects and reclaims the memory.
- If there are no objects left on the heap during the work of the older collector, the JVM also reclaims memory from the metaspace, removing loaded classes from it, if this is a full garbage collection.
Conclusion
We have covered the structure and memory management of the JVM. This is not an exhaustive article, we have not talked about many of the more complex concepts and ways to customize for specific use cases. You can read more details here .
But for most JVM developers (Java, Kotlin, Scala, Clojure, JRuby, Jython) this amount of information will be enough. Hopefully, now you can write better code, create more efficient applications, avoiding various problems with memory leaks.