Hello, Habr! Today I want to start my cycle of articles on algorithmic trading.
First of all, I'll tell you about the simplest indicator of the expected return of a security - the daily price change.
Daily price change is the ratio of the current day's close to the previous day's close. In simple terms, this is the percentage by which a security rose or fell in 1 day.
By itself, this indicator is not very useful - it just shows the daily price change. But, here, if we accumulate statistics for any period (for example, for a month), we can calculate the median and, thus, try to predict the expected profit for 1 day.
Let's move on to practice:
To make calculations, we need:
Data on price changes (the Mosbirzh API will do just fine)
Knowledge of Python and its Pandas and Matplotlib libraries
Trader's Sense (I'm sure if you are reading this article, then you have it)
I will give all the code in a notebook on google colab
Next, I will talk about the daily change in the value of securities for the period from January 1, 2021. until May 25, 2021
For example, let's take Lukoil stock (ticker LKOH). For them, the distribution of the daily price change is as follows:
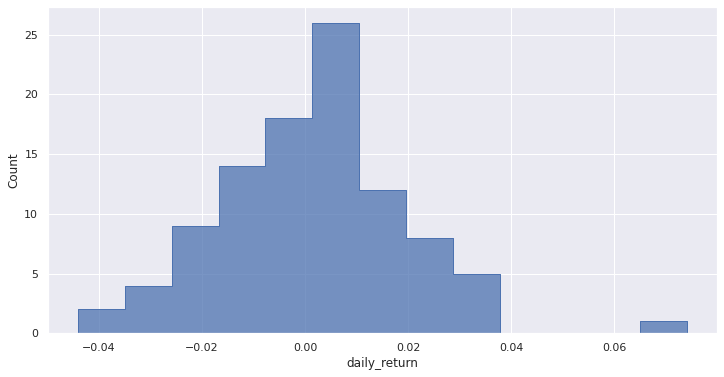
1 2021 25 2021 , 0,26%. , , 0,26%
.
ticker |
median |
q005 |
q05 |
q25 |
q75 |
q95 |
q995 |
|---|---|---|---|---|---|---|---|
LKOH |
0.0026 |
-0.036 |
-0.026 |
-0.01 |
0.011 |
0.032 |
0.035 |
q25 q75 , 50% [-1%; 1,1%]. .., , 5 10 , -1% 1,1%.
q005 q995 , 99% [-3,6%; 3,5%]. .., , , -3,6% 3,5%.
q05 q95 , 90% [-2,6%; 3,2%]. .., , 9 10 , -2,6% 3,2%.
:

. , :
month |
ticker |
median |
q005 |
q05 |
q25 |
q75 |
q95 |
q995 |
|---|---|---|---|---|---|---|---|---|
2021-01-01 |
LKOH |
0.0032 |
-0.022 |
-0.029 |
-0.007 |
0.011 |
0.033 |
0.032 |
2021-02-01 |
LKOH |
0.0041 |
-0.027 |
-0.028 |
-0.010 |
0.014 |
0.027 |
0.027 |
2021-03-01 |
LKOH |
0.0029 |
-0.028 |
-0.027 |
-0.006 |
0.014 |
0.034 |
0.035 |
2021-04-01 |
LKOH |
-0.0005 |
-0.019 |
-0.019 |
-0.011 |
0.005 |
0.015 |
0.015 |
2021-05-01 |
LKOH |
0.0023 |
-0.022 |
-0.024 |
-0.013 |
0.016 |
0.027 |
0.022 |
We see that in April 2021. the median has turned negative, which hints to us opening short positions this month. By visualizing these numbers, we get the following picture:
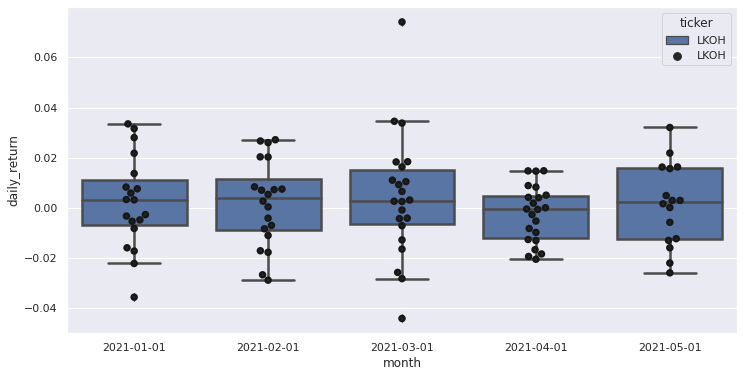
In the next article I will tell you about the Bollinger Bands indicator.