, Data Science, Python . Urban Grammar scikit-learn GPU, cuML cuDF RAPIDS.AI.
, k-, . , , .
, . , , .
— . — , . , . k- R. , Python clustergram — Python .
clustergram k-, scikit-learn ( Mini-Batch) RAPIDS.AI cuML ( GPU CUDA), Gaussian Mixture Model ( scikit-learn) scipy.hierarchy. , . API, sklearn, matplotlib, .
clustergram conda pip:
conda install clustergram -c conda-forge
pip install clustergram
(scikit-learn scipy cuML).
from clustergram import Clustergram
import urbangrammar_graphics as ugg
import seaborn as sns
import matplotlib.pyplot as plt
from sklearn.preprocessing import scale

sns.set(style='whitegrid')
, , .
, , — . , . :
iris = sns.load_dataset("iris")
g = sns.pairplot(iris, hue="species", palette=ugg.COLORS[1:4])
g.fig.suptitle("Iris flowers", y=1.01)

, setosa — , versicolor virginica , (, , ).
, , . . , , , . “ ”, , , , .
k-. , 1000 .
data = scale(iris.drop(columns=['species']))

cgram = Clustergram(range(1, 10), n_init=1000)
cgram.fit(data)

ax = cgram.plot(
    figsize=(10, 8),
    line_style=dict(color=ugg.COLORS[1]),
    cluster_style={"color": ugg.COLORS[2]},
)
ax.yaxis.grid(False)
sns.despine(offset=10)
ax.set_title('K-Means (scikit-learn)')

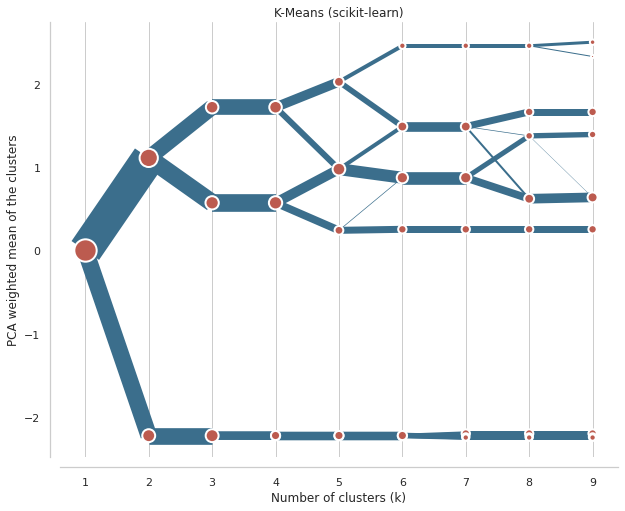
x . ( ), ( ). , , , . , .
, . . , - ? — . — . 3 4 , . , . , , Iris — .
, — .
fig, axs = plt.subplots(2, figsize=(10, 10), sharex=True)
cgram.silhouette_score().plot(
    xlabel="Number of clusters (k)",
    ylabel="Silhouette score",
    color=ugg.COLORS[1],
    ax=axs[0],
)
cgram.calinski_harabasz_score().plot(
    xlabel="Number of clusters (k)",
    ylabel="Calinski-Harabasz score",
    color=ugg.COLORS[1],
    ax=axs[1],
)
sns.despine(offset=10)

3–4 , .
, . , , Iris, .
penguins = sns.load_dataset("penguins")

g = sns.pairplot(penguins, hue="species", palette=ugg.COLORS[3:])
g.fig.suptitle("Palmer penguins", y=1.01)

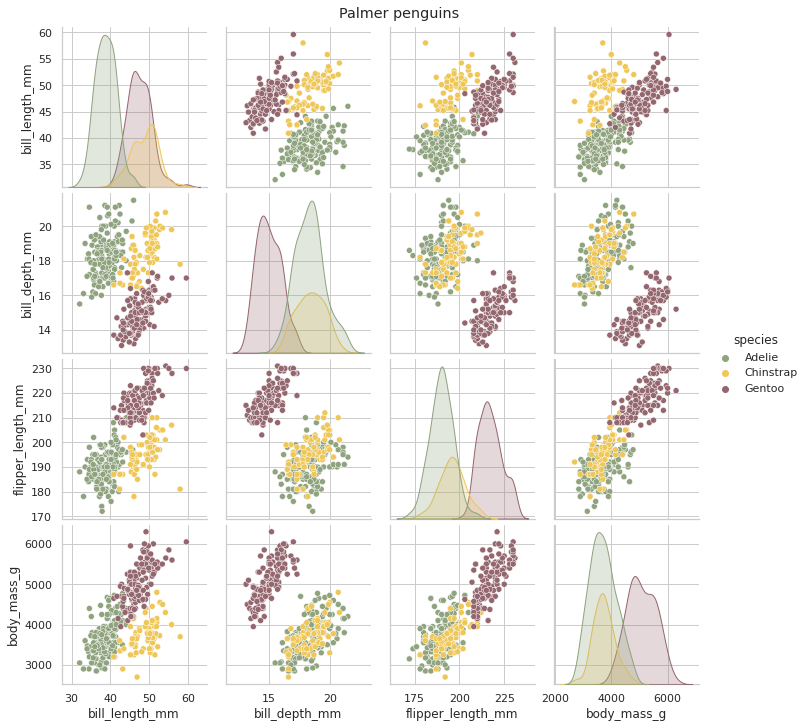
, , , . , . , , , , . .
data = scale(penguins.drop(columns=['species', 'island', 'sex']).dropna())

cgram = Clustergram(range(1, 10), n_init=1000)
cgram.fit(data)

ax = cgram.plot(
    figsize=(10, 8),
    line_style=dict(color=ugg.COLORS[1]),
    cluster_style={"color": ugg.COLORS[2]},
)
ax.yaxis.grid(False)
sns.despine(offset=10)
ax.set_title("K-Means (scikit-learn)")

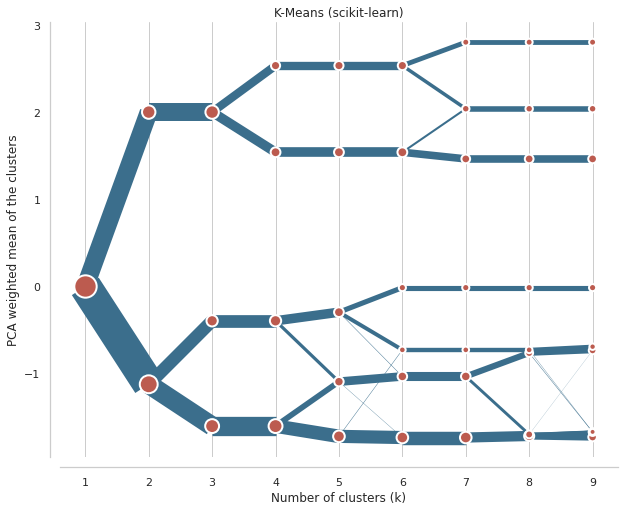
, . . , , , . , 4 ( , , ). , , , .
, ? , ... , . 2–3 3–4 . K , . - . , (Gaussian Mixture).
cgram = Clustergram(range(1, 10), n_init=100, method="gmm")
cgram.fit(data)

ax = cgram.plot(
    figsize=(10, 8),
    line_style=dict(color=ugg.COLORS[1]),
    cluster_style={"color": ugg.COLORS[2]},
)
ax.yaxis.grid(False)
sns.despine(offset=10)
ax.set_title("Gaussian Mixture Model (scikit-learn)")

, . , , .
. . . Clustergam , , . , Iris . , k-, . , , , [] .
clustergram conda install clustergram -c conda-forge pip install clustergram. : scikit-learn, cuML. , — , MIT.
, Jupyter GitHub. interactive binder . .
, . , , - . — , — Data Science, , .

, :
Data Analyst
Data Engineering
Fullstack- Python
Java-
QA- JAVA
Frontend-
C++
Unity
-
iOS-
Android-
Machine Learning
"Machine Learning Deep Learning"
" Data Science"
" Machine Learning Data Science"
"Python -"
" "
DevOps