The main problem of all classical algorithms for data analysis is their low applicability to practical problems. This also applies to clustering tasks.
In real (and also in scientific problems), it becomes necessary to cluster data of mixed type - for example, when half of the variables are numeric and half of the variables are categorical.
Separately, these tasks are solved in standard ways (for example, an article on hierarchical clustering of purely categorical data - https://habr.com/ru/company/otus/blog/461741/ ), however, solving the problem of clustering mixed data presents some difficulties, associated mainly with the complexity of calculating the distance between observations.
A moment of theory
Existing methods assume the distance calculation for Gower using the daisy (daisy (method = "gower")) function in the cluster package.
However, as the creators of the clustMixType package claim , this method is inapplicable when processing large amounts of data, and their package implements a different method
The theoretical foundations of the implemented clustering method were developed back in 1999 in the work of Z. Huang. Extensions to the k-means algorithm for clustering large data sets with categorical variables. Data Mining and Knowledge Discovery, 2: 283-304, 1998. doi: 10.1023 / A: 1009769707641. It is called the k-prototypes method and is based on the following distance formula:

Where

In fact, the distance is calculated by combining the sum of squares of the difference of numeric variables and the sum of the number of mismatched classes in categorical variables, multiplied by some parameter γ.
Thus, for the successful application of this method, two external parameters are required: k (the number of clusters) and γ (the importance of categorical variables; if γ = 0, then the distance is reduced to the classical Euclidean distance)
Back to practice
, (CollegeDistance AER). , :
score ( : )
fcollege ( : )
mcollege ( : )
urban ( : )
education ( : )
income ( : 25 000 ?)
#
library(tibble)
library(clustMixType)
library(AER)
data("CollegeDistance")
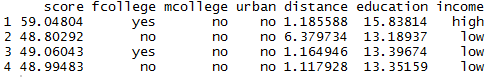
glimpse(CollegeDistance)
XX<-CollegeDistance[,c(3,4,5,7,10,12,13)] #
–
clus_2<-kproto(XX, k = 2) # k -
RStudio :

, , 0 , γ 84.15475 ( ). clus_2 :
clus_2$cluster # ,
clus_2$centers #

, , –
clus_2$size #

:
library(wesanderson)
par(mfrow=c(4,2))
clprofiles(clus_2, XX, col = wes_palette("Royal1", 2, type = "continuous"))

, :
-
-
-
- .
table(XX$income, clus_2$cluster)

, 482 1790 , – 883 1584 .
– γ ( γ ). lambdaest
lambdaest(XX, num.method = 1, fac.method = 1, outtype = "vector")

– γ
– γ
Es <- numeric(10)
for(i in 1:10){
kpres <- kproto(XX,lambda = c(0.01320599,3.03450559,4.21940823,2.79814318,0.18950893,0.31241193,2.43817959), k = i )
Es[i] <- kpres$tot.withinss
}
plot(1:10, Es, type = "b", ylab = "Objective Function", xlab = "# Clusters",
main = "Scree Plot")

, – 4 ( ; 6 9 – - ). :
Original article by the developers of the clustMixType package: https://journal.r-project.org/archive/2018/RJ-2018-048/RJ-2018-048.pdf