
YELP is an overseas network that helps people find local businesses and services based on feedback, preferences and recommendations. In the current articles, a certain analysis of it will be carried out using the Neo4j platform, related to graph DBMS, as well as the python language.
What we will see:
- how to work with Neo4j and large datasets using YELP as an example;
- how the YELP dataset can be useful;
- partially: what are the features in the new versions of Neo4j and why the book "Graph Algorithms" 2019 by O'REILLY is already outdated.
What is YELP and yelp dataset
The YELP network currently covers 30 countries, the Russian Federation is not yet included in their number. The Russian language is not supported by the network. The network itself contains a fairly voluminous amount of information about various kinds of enterprises, as well as reviews about them. Also, yelp can be safely called a social network, since it contains data about users who left reviews. There is no personal data there, only names. Nevertheless, users form communities, groups, or they can be further united into these groups and communities according to various criteria. For example, by the number of stars (stars) that have been assigned to the point (restaurant, gas station, etc.) that you have visited.
YELP describes itself as follows:
- 8,635,403 reviews
- 160,585 companies
- 200,000 images
- 8 megalopolises
1,162,119 recommendations from 2,189,457 users.
Over 1.2 million business paraphernalia: opening hours, parking, availability, and more.
Since 2013, Yelp has regularly hosted the Yelp Dataset competition, encouraging everyone to
explore and explore Yelp's open dataset.
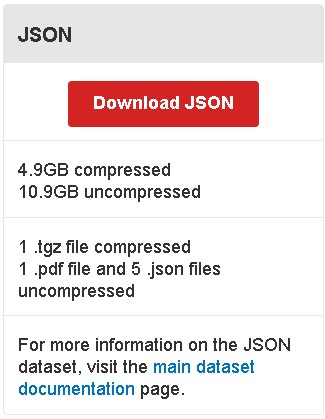
The dataset itself is available at the link The
dataset is quite voluminous and after unpacking it consists of 5 json files:
Everything would be fine, but only YELP uploads raw, unprocessed data and, to start working with them, preprocessing is required.
Installation and quick setup of Neo4j
For the analysis, Neo4j will be used, we will use the capabilities of the graph DBMS and their simple cypher language to work with the dataset.
About Neo4j as a graph database repeatedly written on Habre ( here and here for an article for beginners), so resubmit it makes no sense.
In order to start working with the platform, you need to download the desktop version (about 500Mb) or work in the online sandbox. At the time of this writing, Neo4j Enterprise 4.2.6 for Developers is available, as well as other, earlier versions for installation.
Further, the option will be used - work in the desktop version in the Windows environment (Neo4j Desktop 1.4.5, database versions 4.2.5, 4.2.1).
Despite the fact that the most recent version is 4.2.6, it is better not to install it yet, since all plugins used in neo4j have not yet been updated for it. The previous version - 4.2.5 will be enough.
After installing the downloaded package, you will need to:
- create a new local database, specifying user neo4j and password 123 (why exactly they will be explained below),
picture

- install the plugins you need - APOC, Graph Data Science Library.
picture

- check if the database starts and if the browser opens when you click on the start button
picture


* - enable offline mode so that the database does not earnestly try to suggest new versions.
picture

Loading data into Neo4j
If everything went smoothly with the installation of Neo4j, you can move on and there are three ways.
The first way is to go a long way from importing data into the database from scratch, including their initial cleaning and transformation.
The second way is to load the finished database from the dump and start working with it.
The third way is to load the finished database directly into the folder with the newly created database.
As a result, in all cases, you should get a database with the following parameters:

and the final scheme:
To go through the first path, it is better to read the article on medium first .
* Many thanks to TRAN Ngoc Thach for this.
And use a ready-made jupyter notebook (adapted by me for windows) - link .
The import process is not easy and takes quite a long time -

There are no problems with memory, even with only 8GB Ram, since batch import is used.
However, you will need to create a 10GB swap file, since when checking the imported data, jupyter crashes, there is a mention of this point in the above jupyter notebook.
The second way is easier.
Create a database, go to the folder with its neo4j-admin (each database has its own) and execute:
neo4j-admin load --from=G:\neo4j\dumps\neo4j.dump --database=neo4j --force
where G: \ neo4j \ dumps \ neo4j.dump is the path to the database dump.
The third way is the fastest and was discovered by accident. It implies copying a ready-made neo4j database directly to an existing neo4j database. Of the minuses (so far discovered) - it is impossible to backup the database using Neo4j (neo4j-admin dump --database = neo4j --to = D: \ neo4j \ neo4j.dump). However, this may be due to differences in versions - in version 4.2.1, the database was copied from version 4.2.5. In addition, artifacts appear on the general database scheme, which nevertheless do not affect its operation.
How this method is implemented:
- open the Manage tab of the database where the import will be made
picture


- go to the folder with the database and copy the data folder there, overwriting possible matches
picture

In this case, the database itself, where the copy was made, should not be started.
- Restart Neo4j.
And this is where the login-password that was previously used (neo4j, 123) will come in handy to avoid conflicts.
After starting the copied database, a database with a yelp dataset will be available:

Watching YELP
You can study YELP both from the Neo4j browser, and by sending queries to the database from the same jupyter notebook.
Due to the fact that the database is graphical, the browser will be accompanied by a pleasant visual picture on which these graphs will be displayed.
Starting to get acquainted with YELP, it is necessary to make a reservation that the database will contain only 3 countries US, KG and CA:

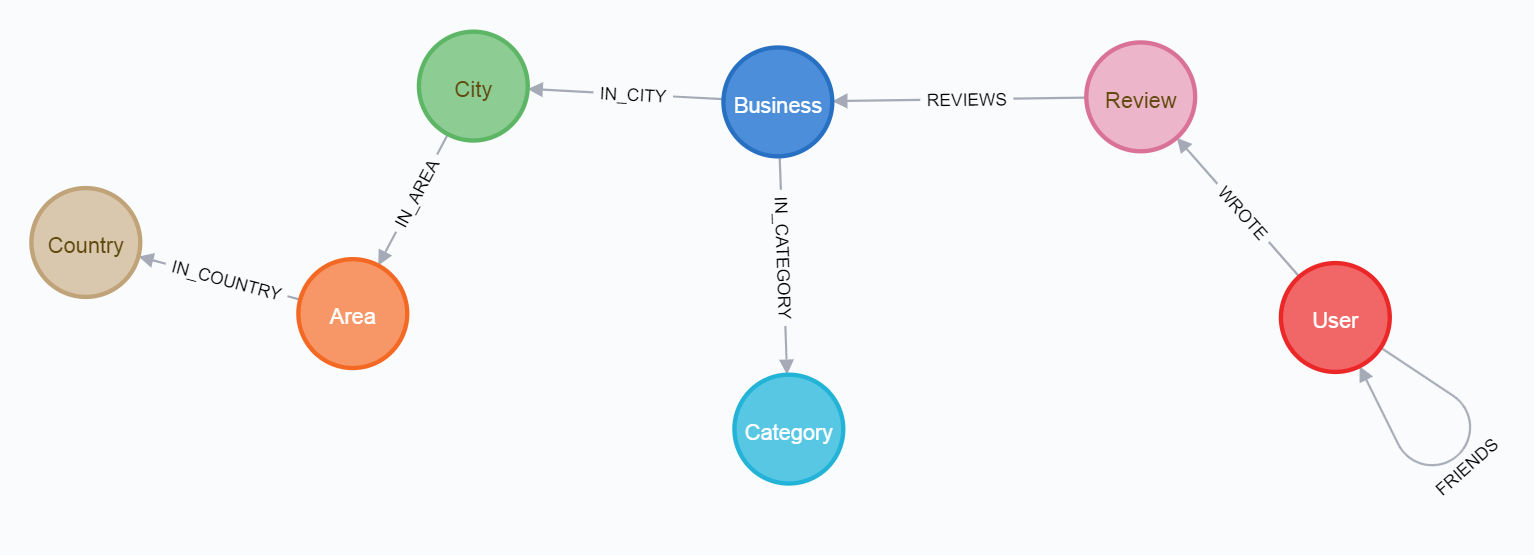
You can view the database schema by writing a request in the cypher language in the neo4j browser:
CALL db.schema.visualization()
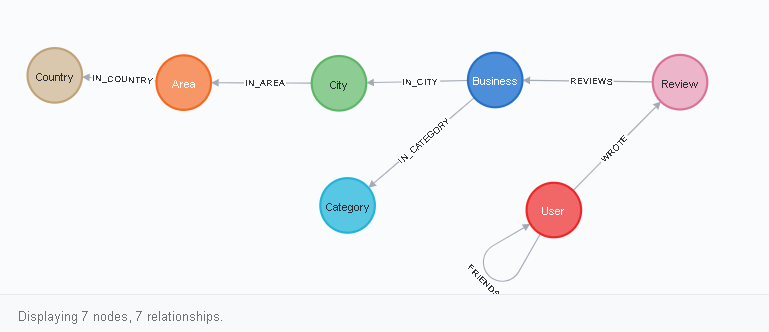
How to read this diagram? Everything looks like this. The User node has a link to itself of the FRIENDS type, as well as a WROTE link to the Review node. Rewiew, in turn, has a REVIEWS connection with Business, and so on. You can see this visually after clicking on one of the vertices (node labels), for example, on User: the

database will select any 25 users and show them:

If you click on the corresponding icon directly on the user, then all direct links coming from him will be shown, and so as connections for User of two types - FRIENDS and REVIEW, then all of them will appear:
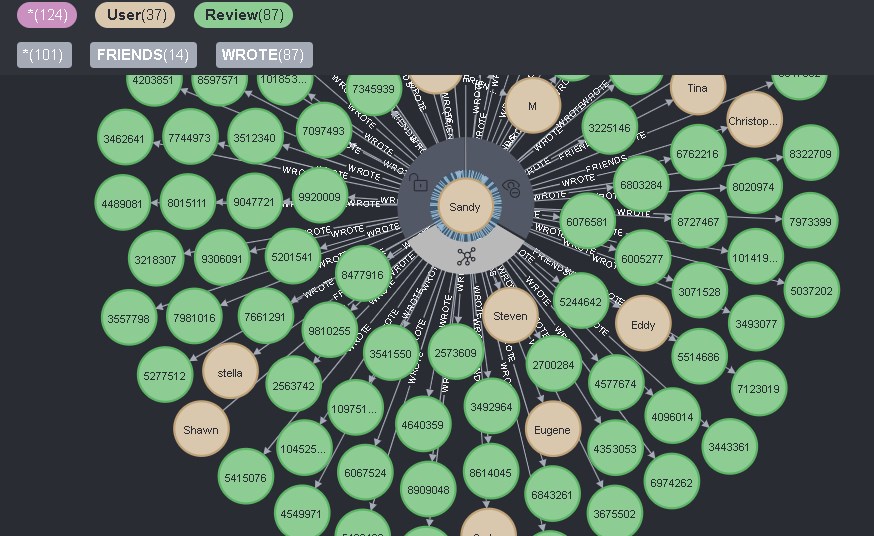
This is convenient and inconvenient at the same time. On the one hand, you can see all the information about the user with one click, but at the same time, you cannot remove unnecessary information with this click.
But there is nothing to worry about, you can find this user and only all his friends by id:
MATCH p=(:User {user_id:"u-CFWELen3aWMSiLAa_9VANw"}) -[r:FRIENDS]->() RETURN p LIMIT 25

In the same way, you can see what reviews a given person wrote:

YELP stores reviews already from 2010! Doubtful usefulness, but nonetheless.
To read these reviews, you need to switch to the text view by clicking on A -

Let's look at the place that Sandy wrote about 10 years ago and find it on yelp.com -

Such a place really exists - www.yelp.com/biz/cafe-sushi- cambridge ,
and here is Sandy herself with her own review - www.yelp.com/biz/cafe-sushi-cambridge?q=I%20was%20really%20excited
picture

Python queries in Neo4j db from jupyter notebook
It will partially use information from the mentioned free book "Graph Algorithms" 2019 from O'REILLY. Partly because the syntax in the book is outdated in many places.
The base with which we will work must be launched, while there is no need to launch the neo4j browser itself.
Importing libraries:
from neo4j import GraphDatabase
import pandas as pd
from tabulate import tabulate
import matplotlib
matplotlib.use('TkAgg')
import matplotlib.pyplot as plt
DB connection:
driver = GraphDatabase.driver("bolt://localhost", auth=("neo4j", "123"))
Let's count the number of vertices for each label in the database:
result = {"label": [], "count": []}
with driver.session() as session:
labels = [row["label"] for row in session.run("CALL db.labels()")]
for label in labels:
query = f"MATCH (:`{label}`) RETURN count(*) as count"
count = session.run(query).single()["count"]
result["label"].append(label)
result["count"].append(count)
df = pd.DataFrame(data=result)
print(tabulate(df.sort_values("count"), headers='keys',
tablefmt='psql', showindex=False))
Output:
+ ---------- + --------- +
| label | count |
| ---------- + --------- |
| Country | 3 |
| Area | 15 |
| City | 355 |
| Category | 1330 |
| Business | 160585 |
| User | 2189457 |
| Review | 8635403 |
+ ---------- + --------- +
It seems to be true, in our database there are 3 countries, as we saw earlier through the neo4j browser.
And this code will count the number of links (edges):
result = {"relType": [], "count": []}
with driver.session() as session:
rel_types = [row["relationshipType"] for row in session.run
("CALL db.relationshipTypes()")]
for rel_type in rel_types:
query = f"MATCH ()-[:`{rel_type}`]->() RETURN count(*) as count"
count = session.run(query).single()["count"]
result["relType"].append(rel_type)
result["count"].append(count)
df = pd.DataFrame(data=result)
print(tabulate(df.sort_values("count"), headers='keys',
tablefmt='psql', showindex=False))
Output:
+ ------------- + --------- +
| relType | count |
| ------------- + --------- |
| IN_COUNTRY | 15 |
| IN_AREA | 355 |
| IN_CITY | 160585 |
| IN_CATEGORY | 708884 |
| REVIEWS | 8635403 |
| WROTE | 8635403 |
| FRIENDS | 8985774 |
+ ------------- + --------- +
I think the principle is clear. Finally, let's write a request and render it.
Top 10 Vancouver Hotels with the Most Reviews
# Find the 10 hotels with the most reviews
query = """
MATCH (review:Review)-[:REVIEWS]->(business:Business),
(business)-[:IN_CATEGORY]->(category:Category {category_id: $category}),
(business)-[:IN_CITY]->(:City {name: $city})
RETURN business.name AS business, collect(review.stars) AS allReviews
ORDER BY size(allReviews) DESC
LIMIT 10
"""
#MATCH (review:Review)-[:REVIEWS]->(business:Business),
#(business)-[:IN_CATEGORY]->(category:Category {category_id: "Hotels"}),
#(business)-[:IN_CITY]->(:City {name: "Vancouver"})
#RETURN business.name AS business, collect(review.stars) AS allReviews
#ORDER BY size(allReviews) DESC
#LIMIT 10
fig = plt.figure()
fig.set_size_inches(10.5, 14.5)
fig.subplots_adjust(hspace=0.4, wspace=0.4)
with driver.session() as session:
params = { "city": "Vancouver", "category": "Hotels"}
result = session.run(query, params)
for index, row in enumerate(result):
business = row["business"]
stars = pd.Series(row["allReviews"])
#print(dir(stars))
total = stars.count()
#s = pd.concat([pd.Series(x['A']) for x in data]).astype(float)
s = pd.concat([pd.Series(row['allReviews'])]).astype(float)
average_stars = s.mean().round(2)
# Calculate the star distribution
stars_histogram = stars.value_counts().sort_index()
stars_histogram /= float(stars_histogram.sum())
# Plot a bar chart showing the distribution of star ratings
ax = fig.add_subplot(5, 2, index+1)
stars_histogram.plot(kind="bar", legend=None, color="darkblue",
title=f"{business}\nAve:{average_stars}, Total: {total}")
#print(business)
#print(stars)
plt.tight_layout()
plt.show()
The result should look like this - the

X - axis represents the hotel's star rating, and the Y-axis represents the total percentage of each rating.
How YELP dataset can be useful
Among the advantages are the following :
- a fairly rich information field in terms of content. In particular, you can just collect reviews with 1.0 or 5.0 stars and spam any business. H'm. A little in the wrong direction, but the vector is clear;
- the dataset is large, which creates additional pleasant difficulties in terms of testing the performance of various data mining platforms;
- the presented data have a certain retrospective and, in principle, it is possible to understand how the enterprise has changed, based on the reviews about it;
- the data can be used as benchmarks for businesses, given that addresses are available;
- users in the dataset often form interesting interconnected structures that can be taken as they are, without forming users into an artificial social. network and not collecting this network from other existing social networks. networks.
Cons :
- only three countries are represented out of 30 and there is a suspicion that this is not completely,
- reviews are stored for 10 years, which can distort and often spoil the characteristics of an existing business,
- there is little data about users, they are impersonal, therefore, recommendation systems based on the dataset will clearly lame,
- FRIENDS links use directed graphs, that is, Anya is friends -> Petya. It turns out that Petya is not friends with Anya. This can be solved programmatically, but it's still inconvenient.
- the dataset is laid out "raw" and requires considerable effort to preprocess it.
Neo4j
Neo4j is dynamically updated and the new version of the interface used in Neo4j Desktop 1.4.5 is not very convenient, in my opinion. In particular, there is a lack of clarity in terms of information about the number of nodes and links in the database, which was in previous versions. In addition, the interface for navigating through the tabs when working with the database has been changed and you also need to get used to it.
The main nuisance in the updates is the integration of graph algorithms into the Graph Data Science Library plugin. They were previously named neo4j-graph-algorithms .
After the integration, many algorithms changed their syntax significantly. For this reason, studying the 2019 Graph Algorithms book by O'REILLY can be difficult.
Yelp database dump for neo4j - download...