(assuming normal distribution)
The problem of determining the equality of means under the condition of equal variances is a classical problem of mathematical statistics, which is solved in technical schools and universities. However, MS as a science is very similar to a swamp - when you try to jump to the side from a bump of a classically solved problem, you can get bogged down or drown altogether.
The problem under consideration is one of these. In fact, caring mathematicians have already developed about two dozen different statistical tests for solving such problems, which raises a question from the category of "which one to use"
A preliminary study (the text of the study is available on GitHub ) showed that, depending on the specific combination of mean values, variance, and the specifics of the problem statement, almost any of the tests considered in the article "Cavus, M., Yazici, B. Testing the equality of normal distributed and independent groups' means under unequal variances by doex package / The R Journal. 2020. No. 2 (12). P. 134-155 " .
To solve this problem, a procedure was developed that allows determining the best statistical test for each specific case. It will be demonstrated using the example of the GrowthDJ database containing data on economic growth. Let us test the assumption about the equality of the average values of economic growth (variable gdpgrowth) depending on the availability of high-quality data in countries (variable inter )
The first stages of the study are checking the normality of distributions and finding descriptive statistics:
library("tibble")
library("AER")
library("WRS2")
library("doex")
data("GrowthDJ")
XX<-na.omit(GrowthDJ)
library("psych")
describeBy(XX$gdpgrowth, XX$inter)
shapiro.test(XX[XX$inter=='yes',6])
shapiro.test(XX[XX$inter=='no',6])
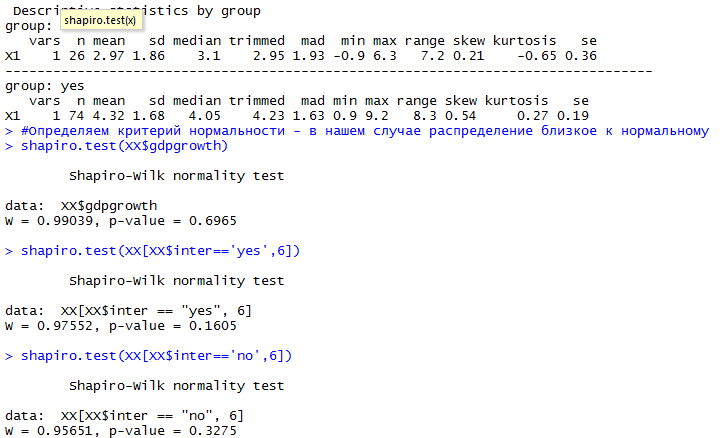
We get that our data is distributed normally, which means that the tests can be applied
Verification method
Set two means and two variance values (based on available data by group)
( 70 ). – № 1 № 1, – № 1 № 2, – № 2 № 2.
0.01. p- 0.01, , 0.01 – . . p- 0.01, , 0.01 – . 100 , .
( , ):
accuracy ( );
selectivity ( , );
precision ( );
recall ( , );
FOR ( );
F- ( precision recall, ).
( .R )
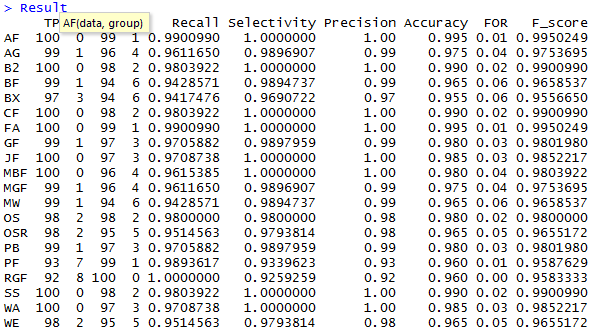
, :
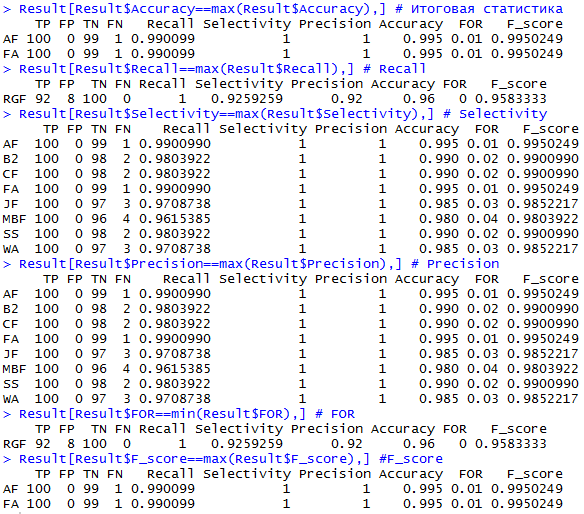
, AF FA- ( , F-score
- (.. ), RGF-
- (.. ), 8 (AF,BA,CF,FA,JF,MBF,SS,WA)
, 8
, RGF-
- AF- (Approximate F-test)

0.0003 -