At about 1:30 pm, the load on the search for aviation and for railway tickets sharply increased. Somewhere at this moment, Russian Railways announced interruptions to the website and the application, and we began to urgently pour additional instances of backends in all data centers.
But in fact, the problems started earlier. At about 8 am, monitoring sent an alert about the fact that on one of the database replicas we have something suspiciously many long-lived processes. But we missed it, considered it not very important.
Introductory
Our infrastructure has grown significantly over almost twenty years of development. Applications live on three platforms - the old php code in a monolith , the first version of microservices is on a platform with self-made orchestration, the second, strategically correct, is OKD, where go, php and nodejs services live. Around all this, dozens of mysql bases with a binding for HA - the main "garland" serving the monolith, and many master-hotstandby pairs for microservices. In addition to them, memkesh, kafkas, mongas, radishes, elastics, are also far from a single copy. Nginx and envoy as frontproxy . The whole thing lives in three network locations and we proceed from the assumption that the loss of any of them does not affect users.
-: mysql
We have three loaded products. The schedule of trains, where there is just a lot of input traffic. The railway schedule for long-distance trains and the purchase and booking of railway tickets - there is a lot of traffic and the search is more difficult. Aviation with very difficult searches, multi-stage cache, a lot of options due to transfers and forks "plus or minus 3 days". A long time ago, all three products lived only in a monolith, and then we began to slowly move individual parts into microservices. The first ones to be dismantled were the electric trains, and, despite the fact that usually the peak in May falls on them, the new architecture is very convenient and easy to scale to the growth of the load. In the case of aviation, most of the monolith was stolen, and right at the moment of day P, A / B testing of the geography sagest had been going on for a week. We compared two versions of the implementation - a new one,on elasticsearch, and the old mysql. At the time of its launch, on April 15, they had already caught a bunch of problems, but then they were quickly conceived, corrected the code and decided that it would not fire again.
Shot. It should be noted that the old version is its own implementation of full-text search and ranking on mysql. Not the best solution, but time-tested and mostly working. Problems begin when any of the tables is heavily fragmented, then all queries with its participation begin to slow down and heavily load the system. And, obviously, at 8 am we crossed this fragmentation threshold, which was reported by the alert. The standard reaction to such a rare, but still expected situation is to take a dull replica out of the load (with our proxying layer from proxysql, this is easy to do), then run optimize + analyze and then return it back. Taking into account the power reserve during normal times under normal load, this does not lead to any problems. But here, in a quiet time, we did not process this alert.
13:20
Around this time, the news about the May holidays and non-working days sounds.
Peak traffic around 13:30
As we later found out, just a few minutes after the announcement of the additional weekend (which is not a weekend, but a “weekend”), traffic began to grow. The load went abruptly. At the peak it was 2.5 - 3 times from the norm, and this continued for several hours.
We were almost immediately bombarded with “emergency alerts” - alerts of the criticality level “wake up and fix”. First of all, it was an alert about the growth of 50 * errors that we send to clients from our frontproxy. On a level below, an alert for database connection errors triggered and in the logs we saw something like this: "DB: Max connect timeout reached while reaching hostgroup 102 after 3162ms". Plus alerts about the lack of capacity on the three groups of application servers of the old monolithic platform. Alert storm in its purest form.
The thought about the reasons came almost instantly, even before entering the schedule with incoming requests - the news about the "vacation" had already flashed in the internal correspondence in the chats.
Having come to their senses a little in a situation of almost complete Achtung, they began to react. Scale application servers, deal with errors at the interface between application and base. We quickly remembered the alert that had been “burning” in the morning and found our old acquaintances from the geography sadge in the processlist of the ailing remark. We contacted the avia team, and they confirmed that the traffic growth in the last days of April, which has not even been close for the past 15 years, is real. And this is not an attack, not some kind of balancing problem, but natural live users. And under their lively requests, our already overloaded replica became completely unwell.
Alexey, our DBA, took the replica out of the load, nailed long-lived processes and followed the standard table optimization procedure. This is all fast, a couple of minutes, but during this time, under such traffic, the remaining replicas got even worse. We understood this, but we chose it as the least of evils.
Almost in parallel, at about 13:40, new application servers began to be poured, realizing that this load is not something that will not go away quickly on its own, but rather can grow, and the process itself for the monolithic part is not very fast.
Base manipulation helped for a while. From about 1:50 pm to 2:30 pm, everything was calm.
Second peak - around 14:30
At that moment, the monitoring informed us that the Russian Railways website was down. Well, that is, in fact, he said that the train backends got worse, and we learned about Russian Railways later, when the news came out . In realtime it looked like this for us.

The load seems to be related to interruptions on the Russian Railways website
Unfortunately, trains mostly still live in a monolith and can only be scaled at the application level by adding new backends. And this, as I wrote above, is a slow procedure and difficult to accelerate. Therefore, all that was left was to wait until the already started automatics worked. In microservices, everything is much simpler, of course, but the move itself ... although that's a different story.
The wait was not boring. In about 5 minutes, the bottleneck of the system in some still not entirely clear way "pushed" from the application layer to the database layer, either to the base itself, or to proxysql. And by 14:40, we had completely stopped writing to the main mysql cluster. What exactly happened there, we have not yet figured out, but changing the master to hotstandby reserve helped. And after 10 minutes we returned the record. Around the same time, they decided to forcibly transfer the entire load from the sadget to the elastic, sacrificing the results of the AB campaign. How much it helped, they also did not realize, but it certainly didn’t get any worse.
15:00
The recording came to life, it seems that everything should be fine, and on the replicas and on proxysql in front of them, the load is normal. But for some reason, errors during read requests from the application to the database do not end. In about 15-20 minutes of sticking into charts on different layers and searching for at least some patterns, we realized that errors come from only one proxysql. Restarted it and the errors were gone. The root cause was dug up much later, with a detailed analysis of the failure. It turned out that during the last emergency, a week before, during the start of the AB campaign about sagest, proxysql did not correctly close connections to one of the replicas of the garland, which was then manipulated. And on this instance of proxysql, we stupidly ran into a lack of ports for outgoing traffic. This metric, of course, is going to, but it never occurred to us to hang up an alert on it. Now it is already there.
15:20
All products were restored, except for trains.
15:50
The last train backends were extended. Usually it takes not two hours, but an hour, but here they themselves messed up a little in a stressful situation.
As often happens, it was repaired in one place, broken in another. Backends began to accept more connections, front-proxies began to drop client requests less due to overflow of upstreams, as a result, internal interservice traffic increased. And there was an authorization service. This is a microservice, but not in OKD, but on an old platform. There scaling is simpler than in monolith, but worse than in OKD. We lifted it for about 15 minutes, twisting the parameters several times and adding capacities, but in the end it also worked.
16:10
Hooray, everything is working, you can go to lunch.
Beautiful pictures
They are beautiful because they are not fully informative, but the axes have not been tested by the Security Council.
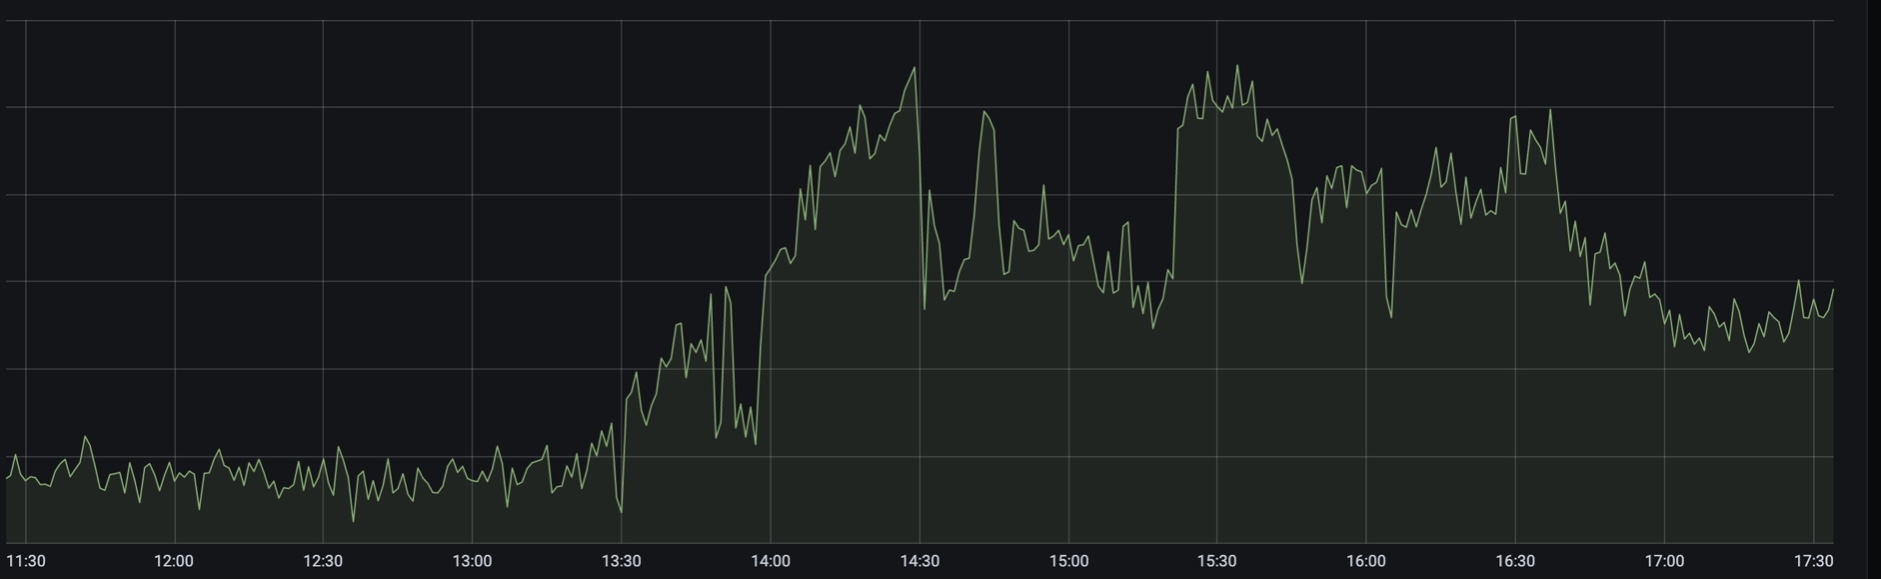
Graph of the 500s:

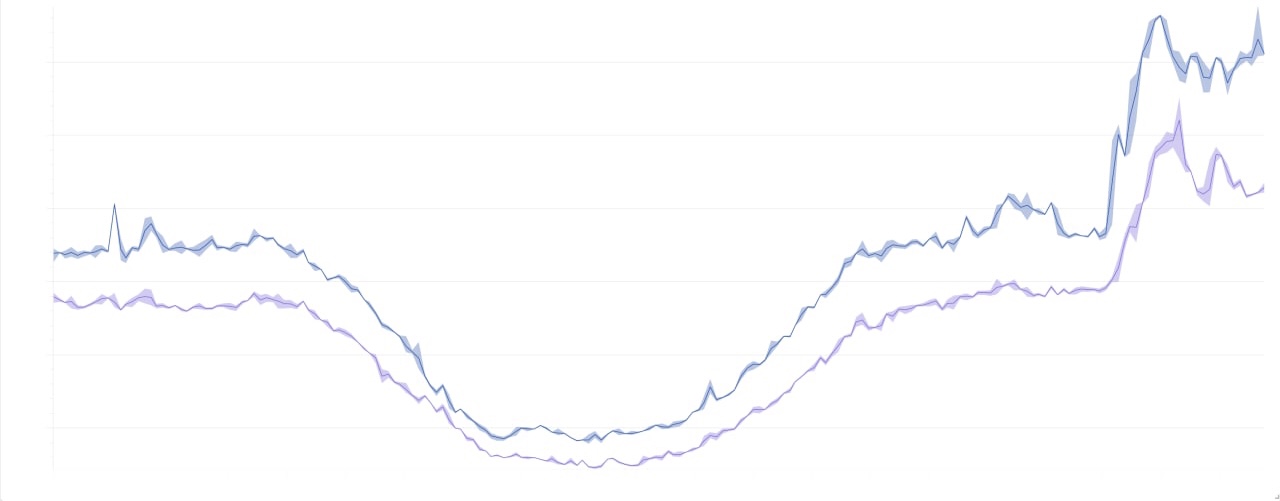
The general picture of the load for 2 days:
Conclusions from the captain
- Thank you for not tonight.
- You need to do something about alerts. There are already a lot of them, but, on the one hand, it is still sometimes not enough, and on the other hand, some are sold out, including because of the quantity. And the cost of support increases with each new alert. In general, there is still an understanding of the problem, but there is no strategic solution. It is hiding somewhere at the junction of processes and tools, we are looking for. But tactically, we have already zipped a couple of alerts.
- . , - proxysql , . , .
- , OKD . .
- . , , , .