There are many machine learning systems out there today. Technology is booming. Different vendors of solutions offer different options for solving the problem. Most likely, for different areas and solutions, you need to choose different ones. It is impossible to tell which technologies have the greatest potential without making appropriate comparisons. But in order for the topic to be really interesting, you need to take something that does not depend on the region of the study. Something common for the whole country.
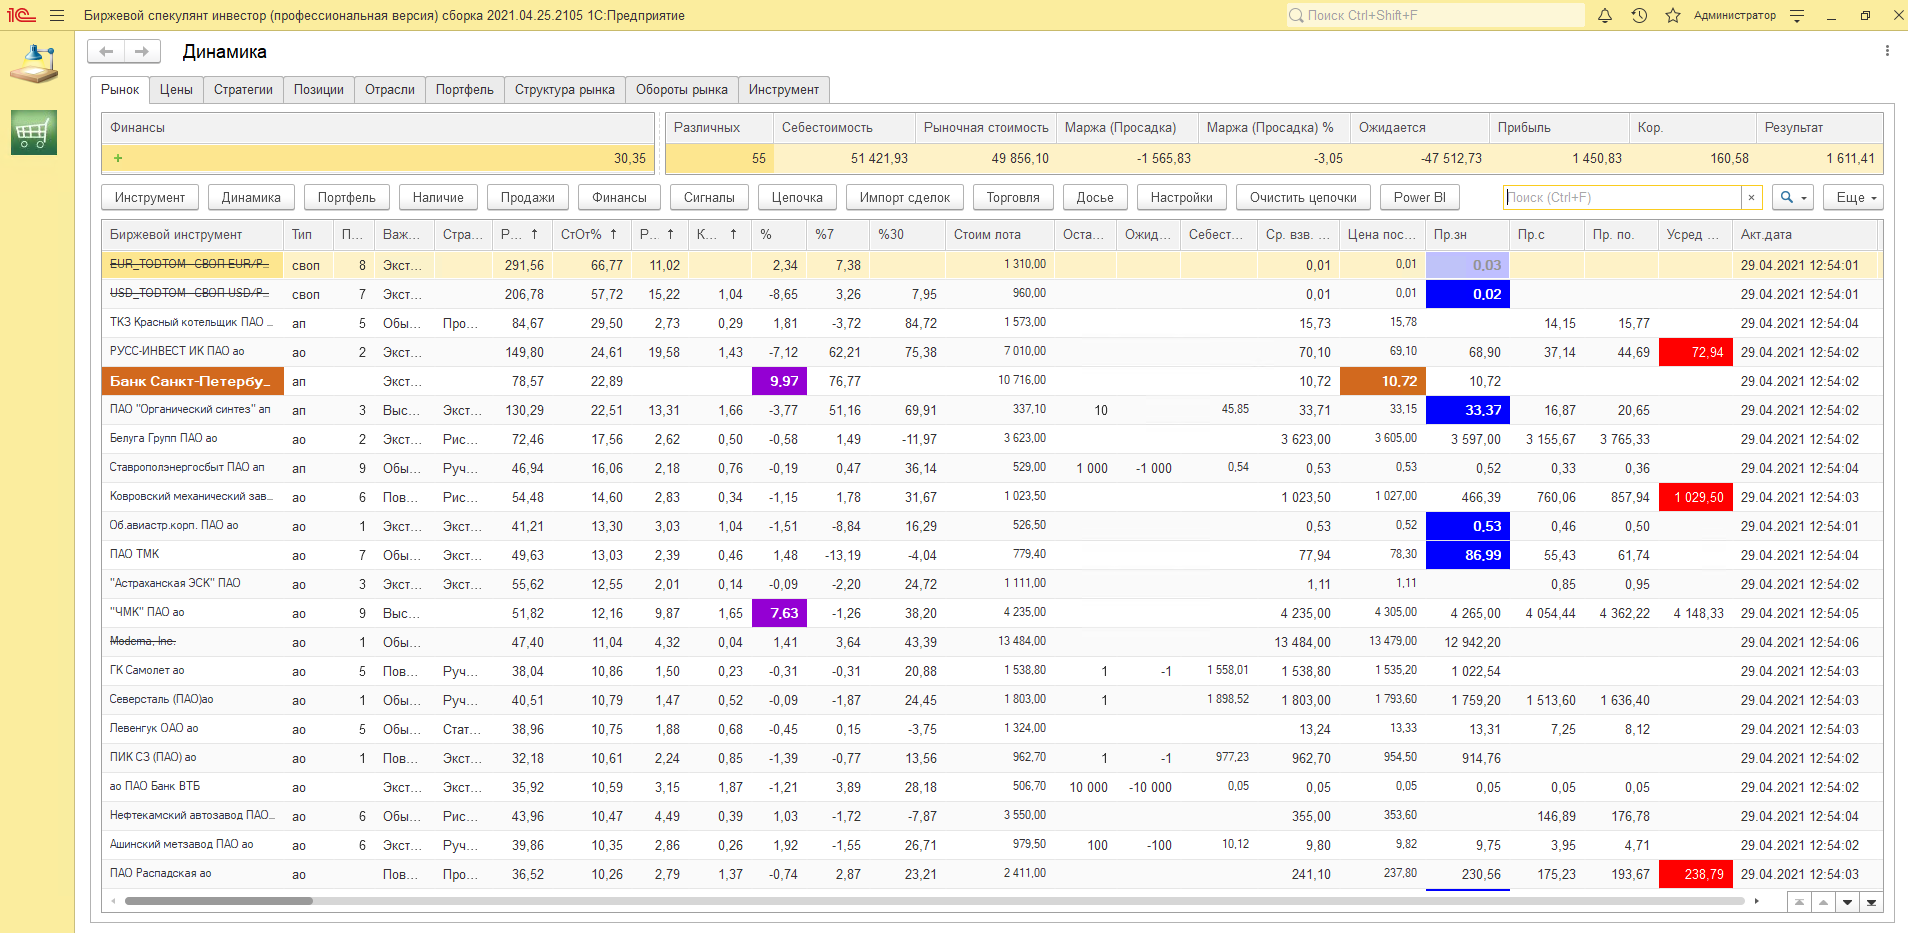
Let's take as a basis the problem of forecasting the price of shares of companies on the Moscow Exchange. If we consider each exchange instrument as a separate entity, whose life develops independently of other exchange instruments, then the analysis methods for each instrument must be selected differently.
In order to assess which forecasting methods are suitable or not suitable for each instrument, we need to store information about forecasting options for each exchange instrument. There are several forecasting options in the 1C platform. Let's create a mechanism for storing information about the applicability / or non-applicability of each option.

In order to assess how accurately the forecasts created by the system come true, the simplest option, based on the historical information we have, is to build a forecast of the system for a specific date, and then compare it with real historical data. Example: we have accumulated historical data on share prices on the Moscow Exchange for the last year. Imagine that today is January 15, 2021 and build a forecast for the closing price of an exchange instrument for January 16, 2021. And then we will compare the received forecast with real data which was on January 16th. Let's carry out this analysis for a longer interval and get the probability of forecast triggering. More precisely, the number of cases when the forecast came true or did not come true.
Typical 1C forecasting tools allow you to get a forecast either as a certain value exactly equal to the number, or the value of the price range "from ... to".
Suppose that we are faced with the task of predicting a certain value of the closing price by days on the Moscow Exchange in a growing market.
In the case when the 1C forecast returns unambiguous knowledge, we will take it. And in the case when the forecast returns the range "from ... to" we will consider, as the forecast value, the middle of the range. In this case, we will assume that the predicted price was lower than the actual historical price as a successful forecast. Those. for example, the paper opened at a price of 100 rubles. The 1C forecast was that it would close in the evening for 150 rubles. And the real historical closing price was 151 rubles (more than 150 rubles).
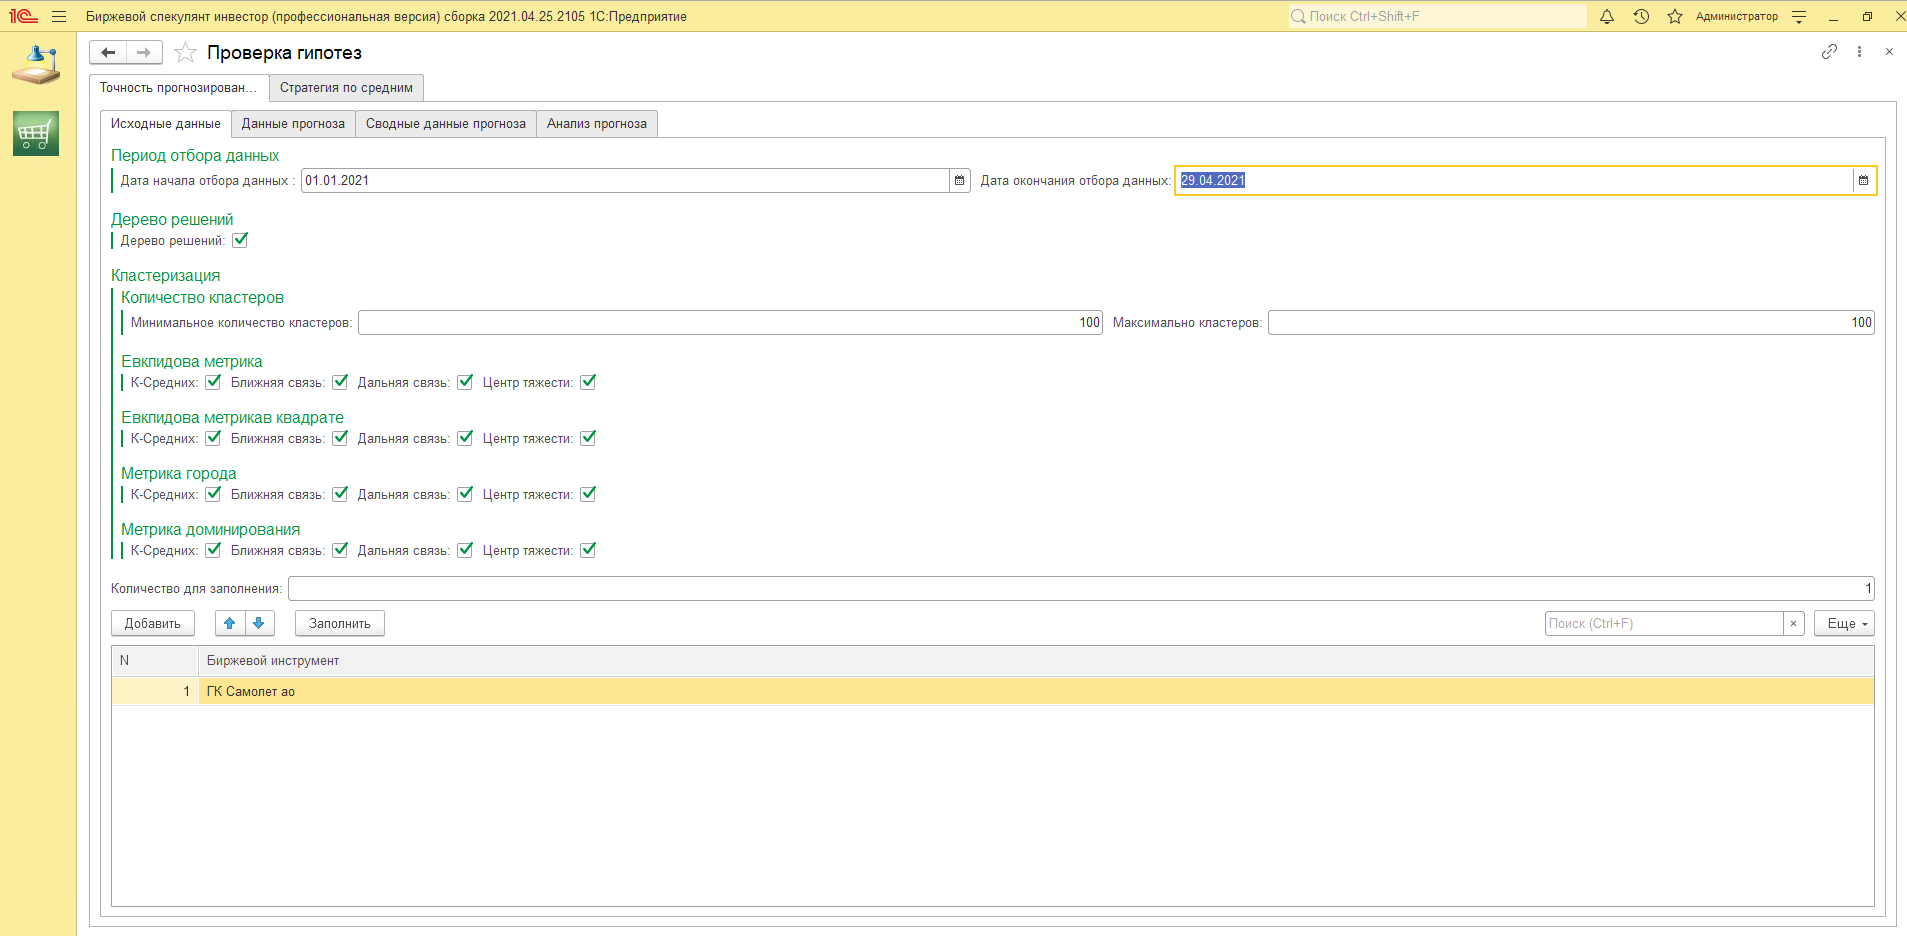
In the processing specially created for these purposes, we will set the initial settings for the analysis: Analysis period, analyzed methods and analyzed instrument / instruments.
We will receive data for each analyzed day.


In order to get the probability of forecast triggering, we group the data by the number of cases and define the probability as: the number of positive triggerings of the forecast to the total number of analysis attempts.

The obtained analysis shows that most forecasting methods for this instrument are triggered with a fairly high probability. We have to determine the threshold value, which we will consider as a criterion for selecting forecasting strategies. For the selection criterion of 90%, we get a picture of suitable forecasting strategies, as in the figure below.

Although, in general, the probability of 80% is also a fairly good criterion, and then the picture of suitable strategies will be, as in the figure.

In general, for this tool, the picture of the applicability of typical forecasting strategies looks like in the figure.

Of course, analyzing each tool in manual mode is an exciting activity, but then the idea comes to make the analysis automatically a routine task. In order to store the results of this analysis, we need a register of information.

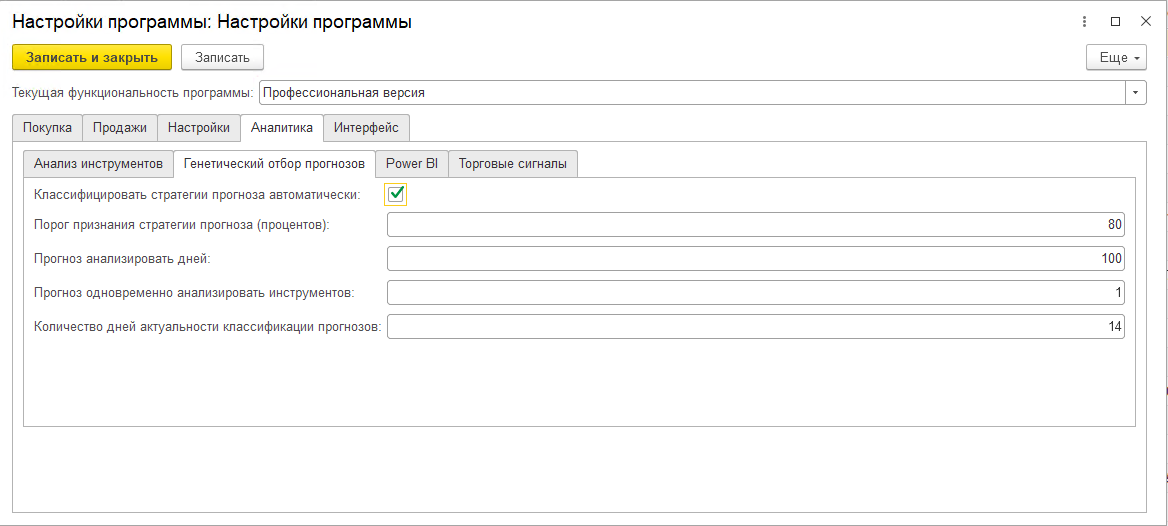
And in order to set up a scheduled task, you will need constants (settings).
Of course, the applicability or inapplicability of this mechanism can be argued for a long time. But it is interesting to watch the process. In fact, each Exchange instrument turned out to be a kind of “live”. Everyone lives their own life. For some, life is predictable or partially predictable. The lives of others at the moment are difficult to analyze.


But in general, it is not easy to observe price movements, but getting a forecast is much more exciting.
Details can be found in the documentation
Well, what can I say: people are arranged this way, they want to know what will happen ...