Recently, we added an analytics tool from the partner company LiveAction to our Cisco stand, which we are now testing with might and main. Why does SD-WAN need any special analytics at all? Firstly, routing in such a network is much more complicated than in a traditional network, and it is important for the administrator to see what is happening with the traffic, taking into account the whole variety of settings. Secondly, SD-WAN is about ensuring the quality of application work, which means you need to have tools for analyzing the quality of these applications.
I'll tell you how these solutions work in pairs and how to set everything up.
How analytics work in SD-WAN
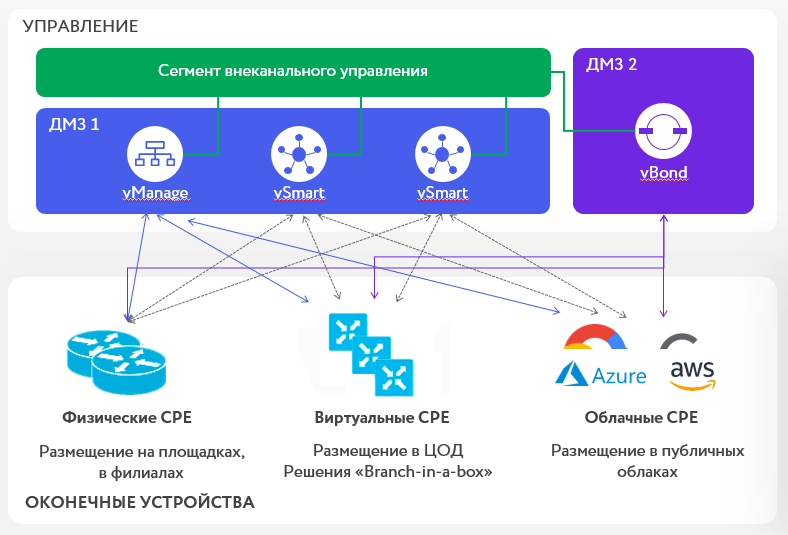
Let me remind you that the operation of the Cisco SD-WAN network is determined by a set of management components: vManage manages configurations and collects data for monitoring the network
vSmart sends routing information and traffic control policies
vBond connects all components of the solution together
SD-WAN routers receive routing information using the proprietary OMP protocol ... On a traditional network, the route always looks like "network 192.168.4.0/24 is accessible through gateway X". In the case of OMP, everything is somewhat unusual, for example, like this:
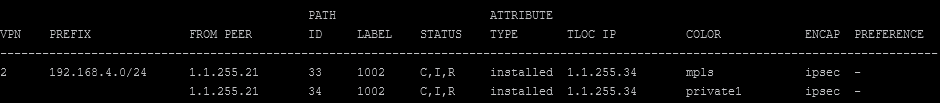
In fact, the conclusion above means “the network 192.168.4.0/24 is accessible through a router with the identifier 1.1.255.21, through two types of transport (MPLS and Private1), and the traffic transmitted there must be packed in IPSEC. All these bells and whistles are necessary to provide SD-WAN functionality.
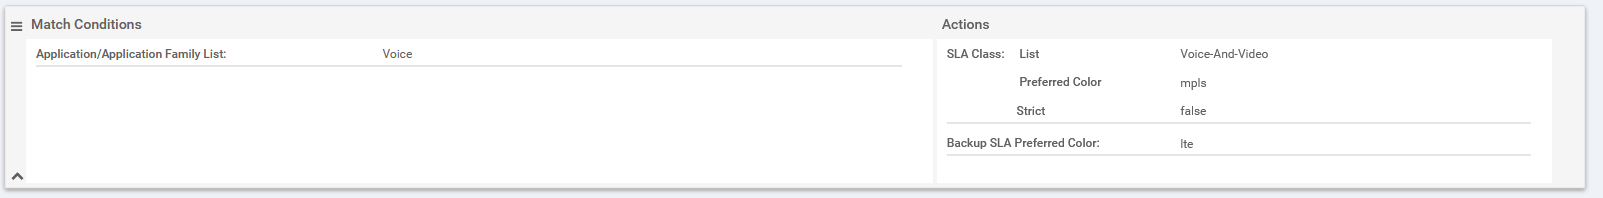
In addition to routes, there are also policies that determine the choice of the mode of transport, for example, "Transmit voice traffic via MPLS, if MPLS does not provide the required quality, switch to LTE." Like this:
It becomes difficult to understand where the traffic of a particular application will go at a particular point in time. You can check what exactly we have configured using the Simulate Flows tool in vManage

But besides this, I want to understand how the traffic of this application went through the network in the last, say, week, taking into account the fact that the quality of the channels sometimes dropped, and the traffic volumes changed. Was it worth it to pass this traffic along this path, or is it worth revising the policy? This is where LiveAction analytics helps.
LiveAction is installed as a server or a cluster of servers, integrates with vManage via API, receives a list of routers and their configuration data from there, and then polls them via SNMP and receives data via cFlowd (similar to NetFlow).
Integration
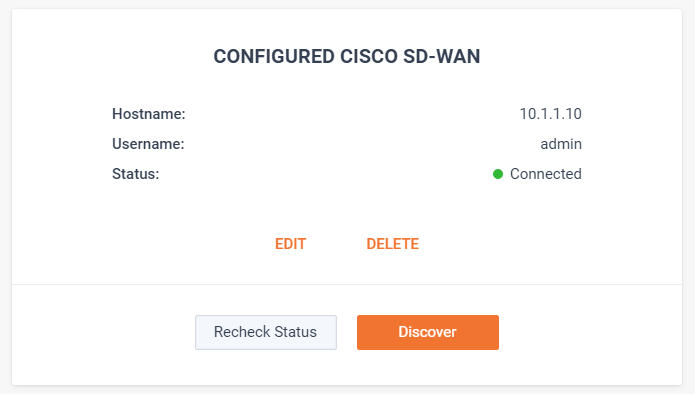
We contacted vManage via the API:
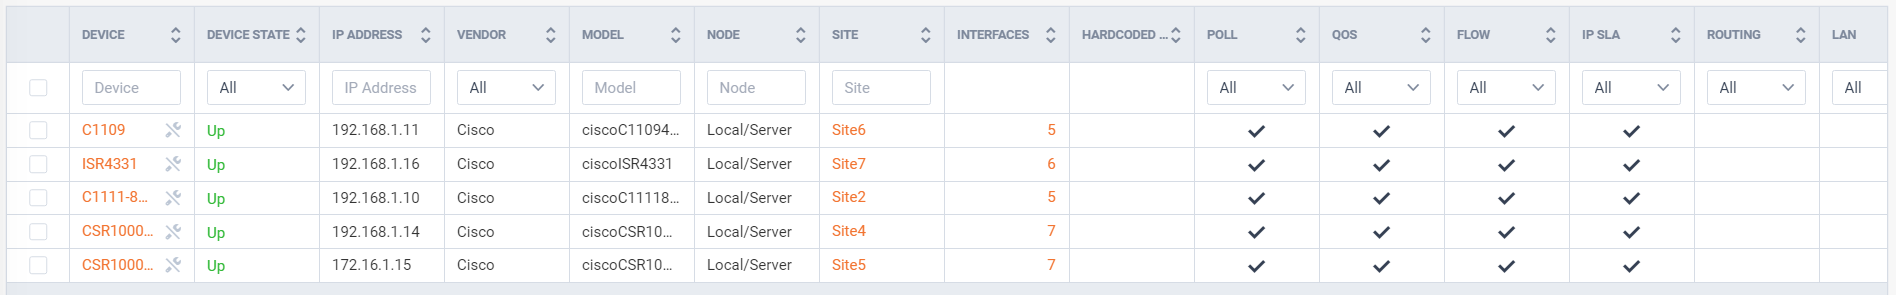
Received a list of devices:
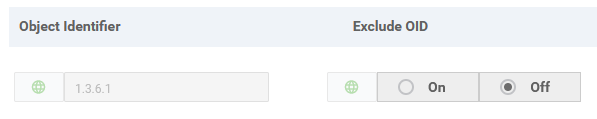
Allowed access to them via SNMP (Standard Internet OID, added to the SNMP template in vManage):
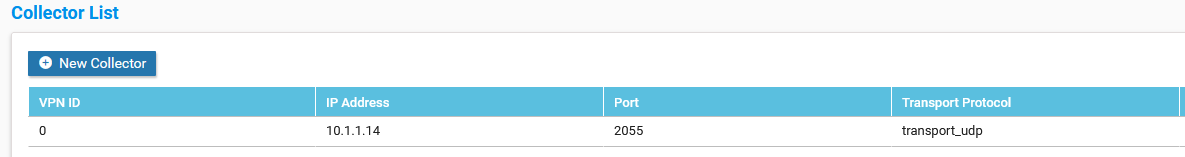
Configured sending cFlowd using the vManage policy:
And we get information about the network in LiveAction, for example, here in This representation:
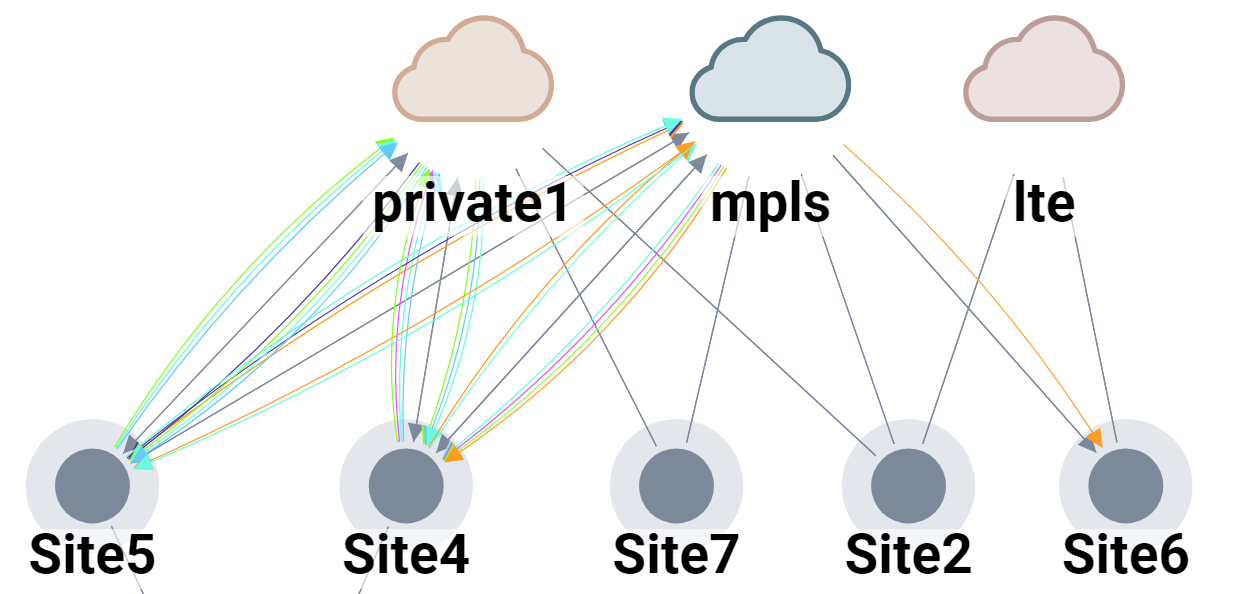
Arrows represent application-specific traffic flows. You can click on each of them and see the details of traffic flows,
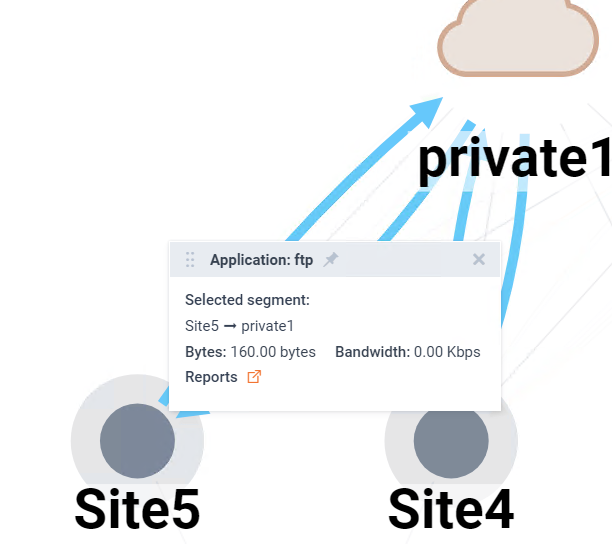
as well as, if necessary, generate a custom report, for example, this one for traffic between two sites:

Look deeper
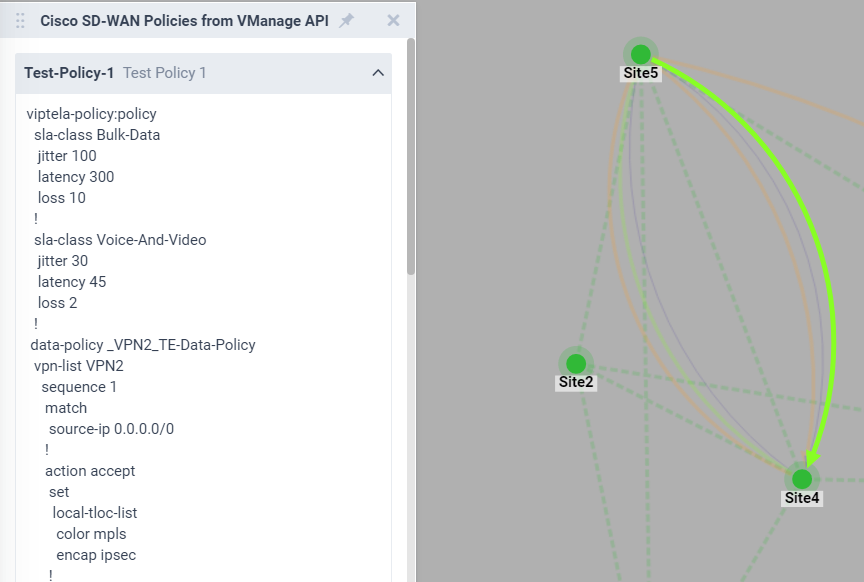
By clicking on the traffic flow on the diagram, the system is able to pull up the policies that affect it from vManage, again through the API:
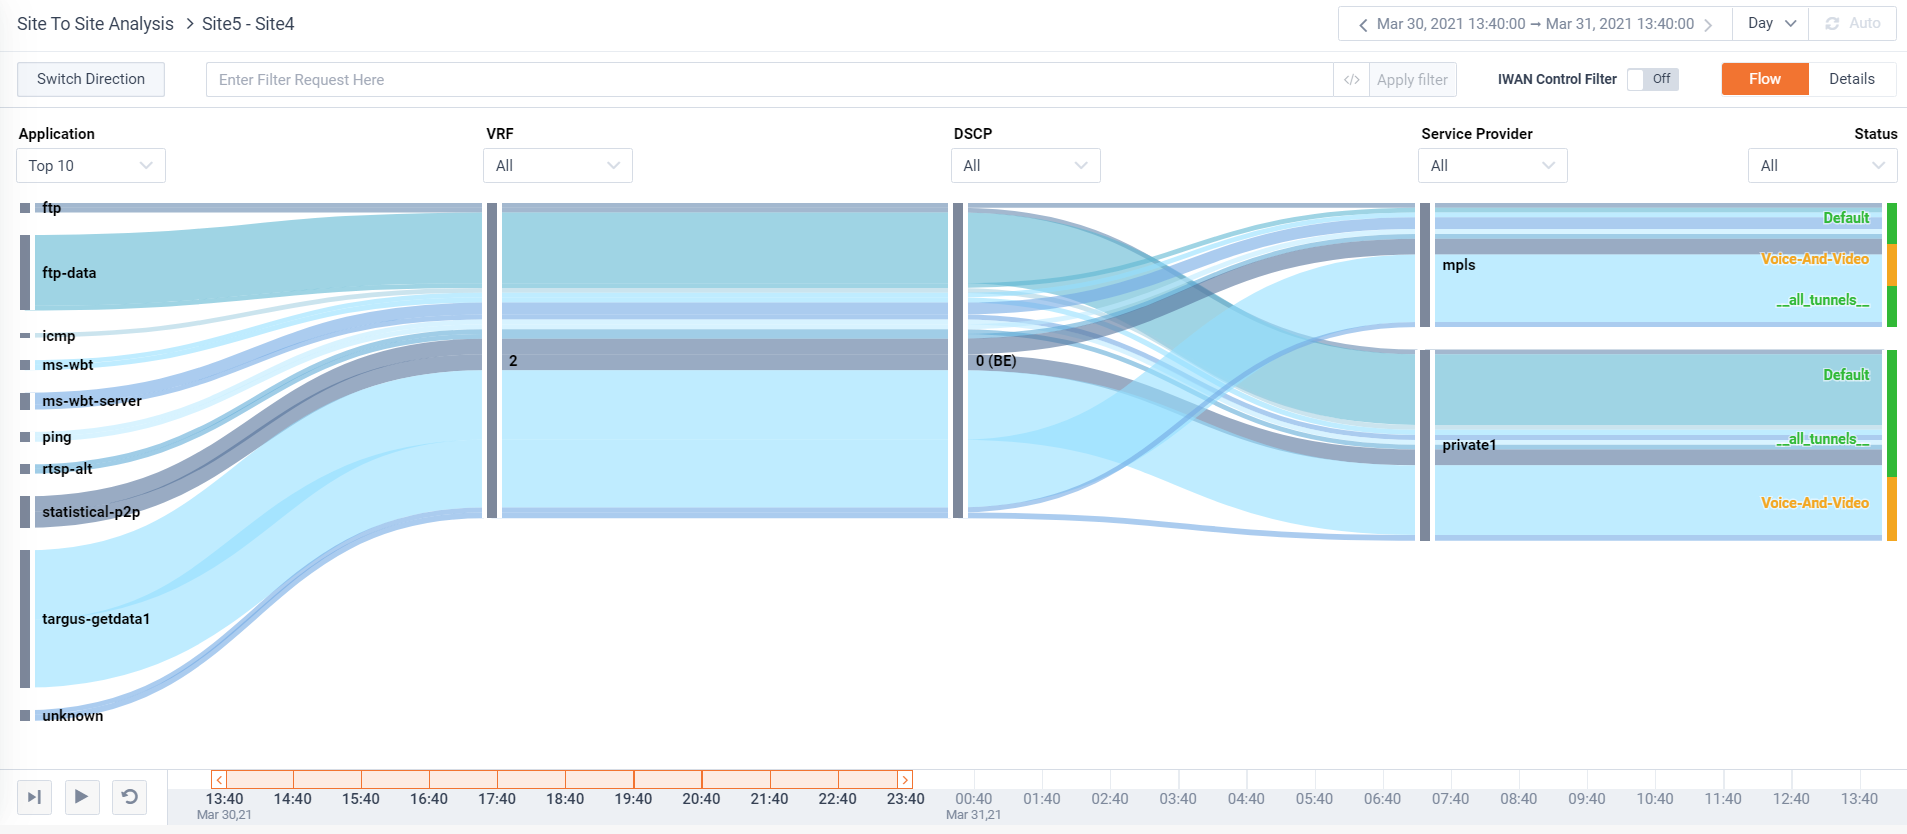
Well, in order to see what actually happened with the traffic of an application at a particular moment in time, there is such a diagram:
From it you can see that, for example, FTP-Data traffic from VRF 2 was transmitted with the DSCP 0 tag through a transport named Private1. At the bottom there is a slider that allows us to determine the time interval of interest to us and the "Play" button to see how the behavior of the router has changed over time. Thus, you can not only make sure that the traffic of an application was transmitted the way we wanted it, but also investigate any incidents in the operation of a network application that took place in the past. For example, if three days ago, from 12:00 to 12:30, our video conferencing did not work well, you can see that for some reason we transmitted its traffic through the wrong channel and without the required DSCP tag.
You can display a list of traffic flows between two sites in the form of a table:

And then go into a specific stream and see the path of its passage together, say, with the load of interfaces, CPU and memory of devices participating in the data transfer:
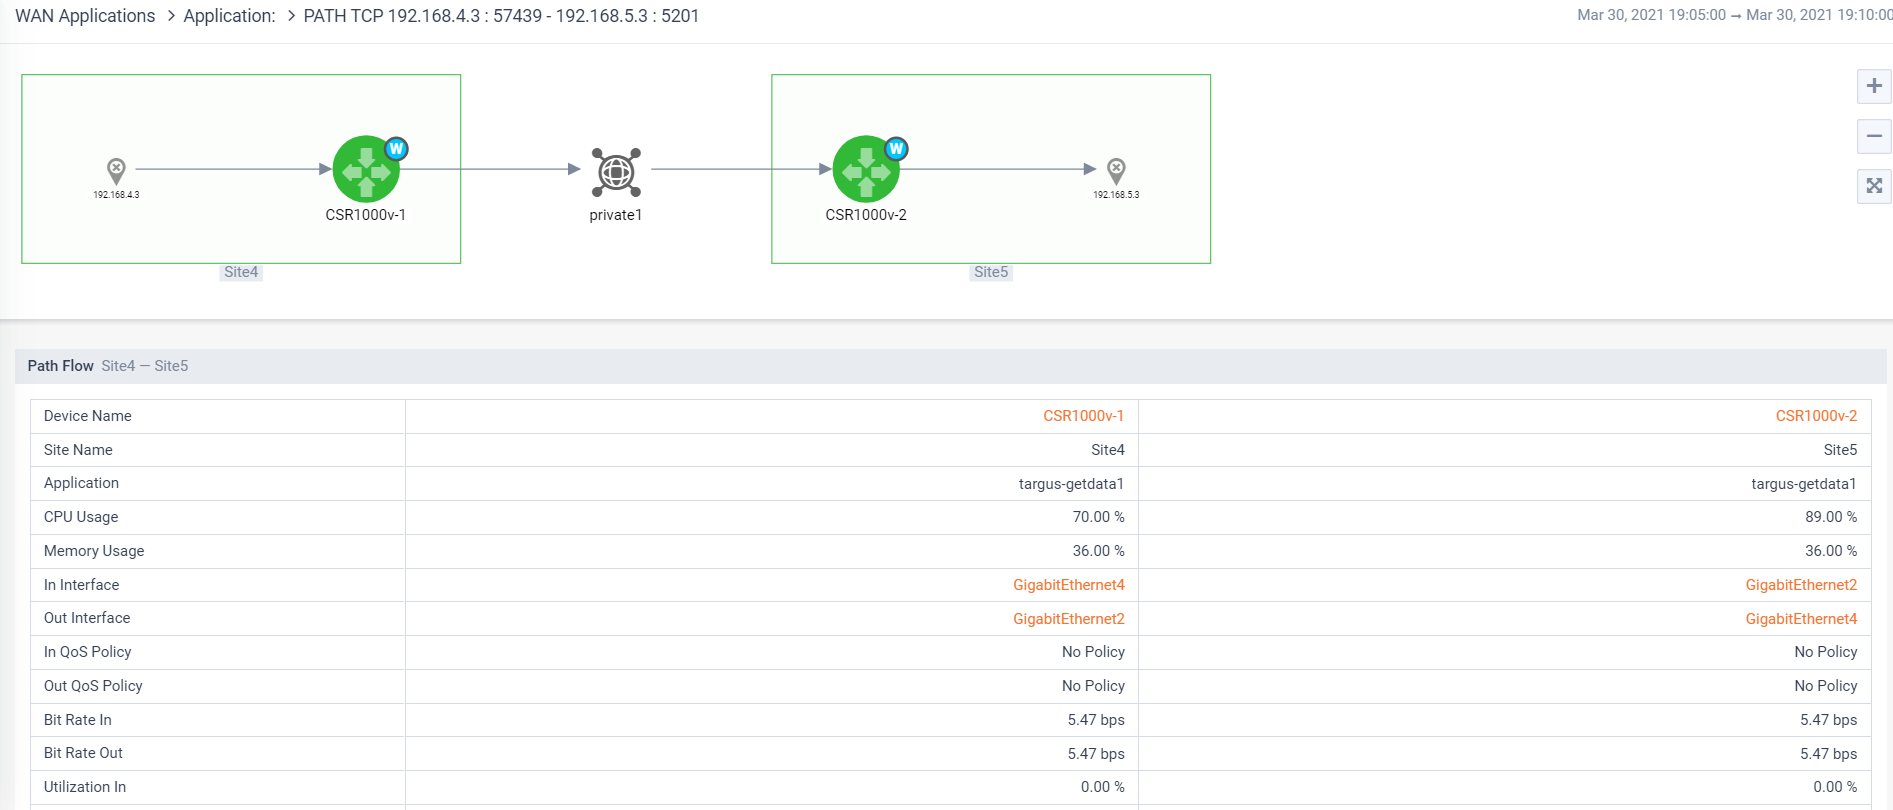
Thus, it is possible to establish, for example, that at the time of data transfer one of the interfaces or the CPU of one from devices.
And even deeper
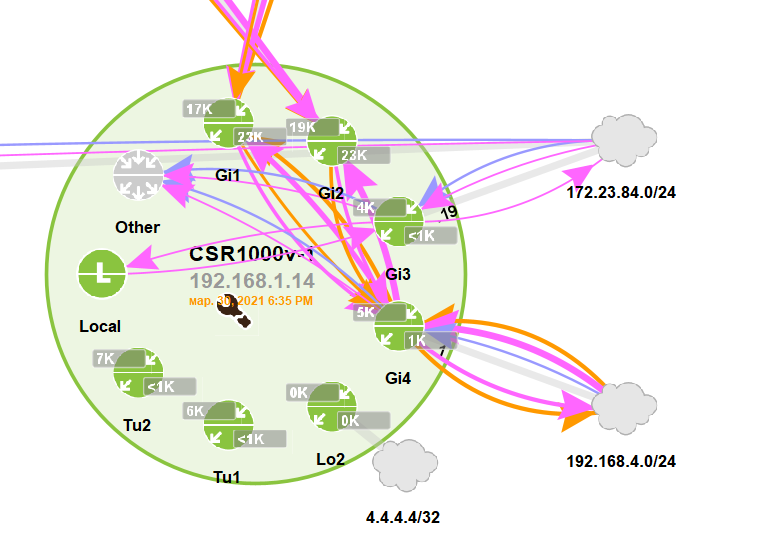
In addition to the web interface, LiveAction has an engineering console. It allows you to see traffic flows even within the same device. For example, this is how the Cisco CSR1000v router looks like:
For each device, you can watch the so-called Historical Playback - how the traffic flows changed over time:

Dashboards
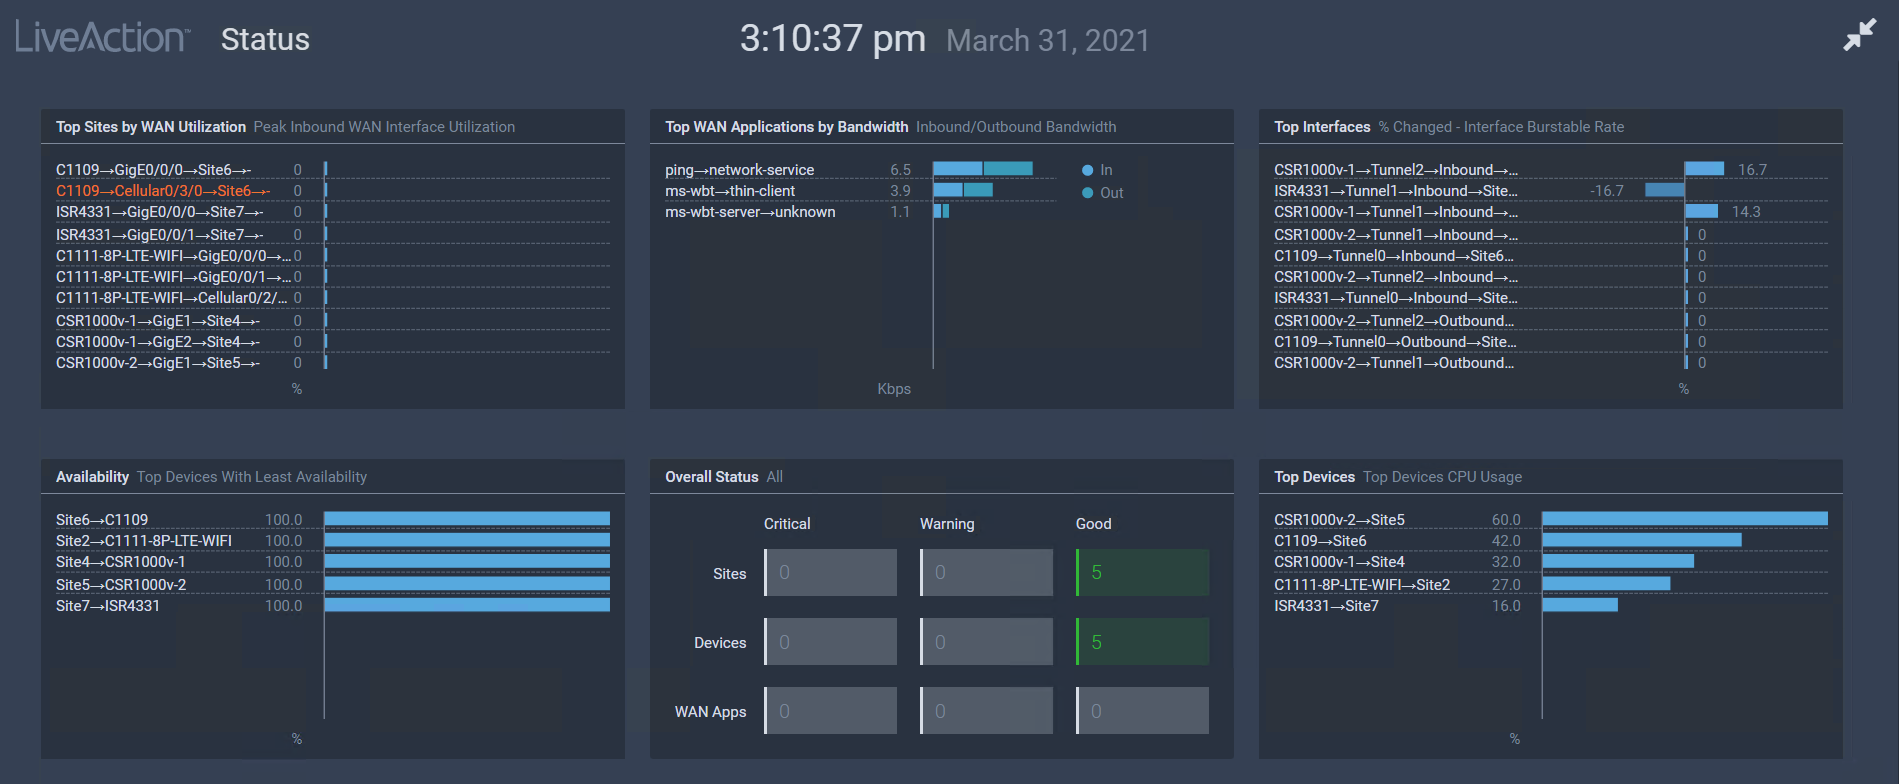
For the current monitoring of the SD-WAN network in LiveAction, pre-configured and customizable dashboards are available using widgets. There are about 30 different widgets available, you can create your own. Here is an example of a ready-made dashboard for tracking the performance of SD-WAN tunnels:

For any dashboard, you can make a permanent link and display it in a contrasting form on the plasma panel in the NOC:
Why LiveAction is useful at the testing stage
Our experience with the Cisco SD-WAN solution shows that for its successful testing and implementation, it is especially important to understand what kind of traffic is walking through the network, what routes and in what volumes. Traditional networks focused on connectivity - “connect sites A, B, C to data centers”. The most that could be done to ensure the quality of specific applications is shaping traffic and distributing it into QoS queues.
By the way, SD-WAN solves the connectivity problem faster and easier than traditional networks, but its main feature is adaptation to the requirements of network applications. We can transfer real-time traffic from one channel to another, measuring the delay and jitter. This is how it works. For traffic that is critical to losses, we apply error correction or transmit it simultaneously over two channels, while heavy and non-critical traffic is loaded onto cheap channels. The analytics system allows you to see which applications are transmitting traffic over the network and assign them to one class or another. Moreover, this can be done not only after the implementation of SD-WAN, but also before, at the testing stage:
- Set LiveAction and collect primary data from the network
- Select for testing SD-WAN sites, the traffic pattern on which is most representative for the current state of the network
- Make assumptions about which policies will improve the quality of data transfer
- Install SD-WAN routers and configure policies in the test SD-WAN segment as per assumption
- Using LiveAction, analyze the results of work and adjust policies. See for yourself and demonstrate to stakeholders how to improve the quality of data transmission
- Get a network-ready SD-WAN configuration.
Summary. Benefit from analytics on an already running SD-WAN network
For those who have already implemented the SD-WAN solution from Cisco, the analytics system will help:
- Monitor how telecom operators comply with the SLA and what quality they give out on their communication channels in general;
- See problems in critical applications before their users start complaining;
- Correctly adjust the network to the work of new applications that are being implemented;
- Find errors in settings made by network maintenance specialists faster;
- To understand how much better the available bandwidth of communication channels has become used, and therefore to evaluate the effectiveness of migration to SD-WAN in money.
LiveAction is a cool, advanced solution that will allow you to squeeze out the maximum network performance and the greatest return on your investment in a capital solution like SD-WAN. At the same time, of course, the network operation process should be built from the management point of view - a system of requests, investigation of the causes of emerging problems, development planning. If the engineers operating the network work “on call” and put out fires chaotically, it is not a fact that it will help them.