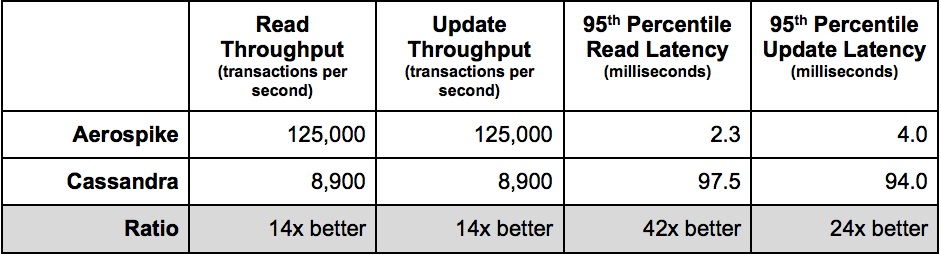
By an amazing coincidence, Scylla (hereinafter SC) also beats CS easily, which proudly announces right on its home page:

Thus, the question naturally arises, who will fence whom, the whale or the elephant?
In my test, the optimized version of HBase (hereinafter referred to as HB) works with CS on an equal footing, so here it will not be a contender for victory, but only insofar as all our processing is based on HB and I want to understand its capabilities in comparison with the leaders.
It is clear that HB and CS are free of charge, but on the other hand, if you need X times more hardware to achieve the same performance, it is more profitable to pay for software than to allocate a floor in the data center for expensive heating pads. Especially considering that if we are talking about performance, then since HDDs, in principle, are not able to give at least some acceptable speed of Random Access reads (see " Why HDD and fast Random Access reads are incompatible "), which in turn means buying SSD, which in the volumes required for a real BigData, is quite an expensive pleasure.
So, the following was done. I rented 4 servers in the AWS cloud in the i3en.6xlarge configuration where each on board:
CPU - 24 vcpu
MEM - 192 GB
SSD - 2 x 7500 GB
If someone wants to repeat it, we immediately note that it is very important for reproducibility to take configurations where the total volume of disks (7500 GB). Otherwise, the disks will have to be shared with unpredictable neighbors, which will surely spoil your tests, as they probably seem to be a very valuable load.
Next, I rolled out SC using the constructor , which was kindly provided by the manufacturer on its own website. Then I uploaded the YCSB utility (which is almost a standard for comparative database testing) for each cluster node.
There is only one important nuance, in almost all cases we use the following pattern: read the record before changing + write the new value.
So I modified update as follows:
  @Override
  public Status update(String table, String key,
                       Map<String, ByteIterator> values) {
    read(table, key, null, null); // << added read before write
    return write(table, key, updatePolicy, values);
  }
Then I started the load simultaneously from all 4 hosts (the same ones where the database servers are located). This is done deliberately, because sometimes clients of some databases consume more CPU than others. Given that the size of the cluster is limited, I would like to understand the overall efficiency of the implementation of both the server and client parts.
The test results will be presented below, but before we move on to them, it is worth considering a few more important nuances.
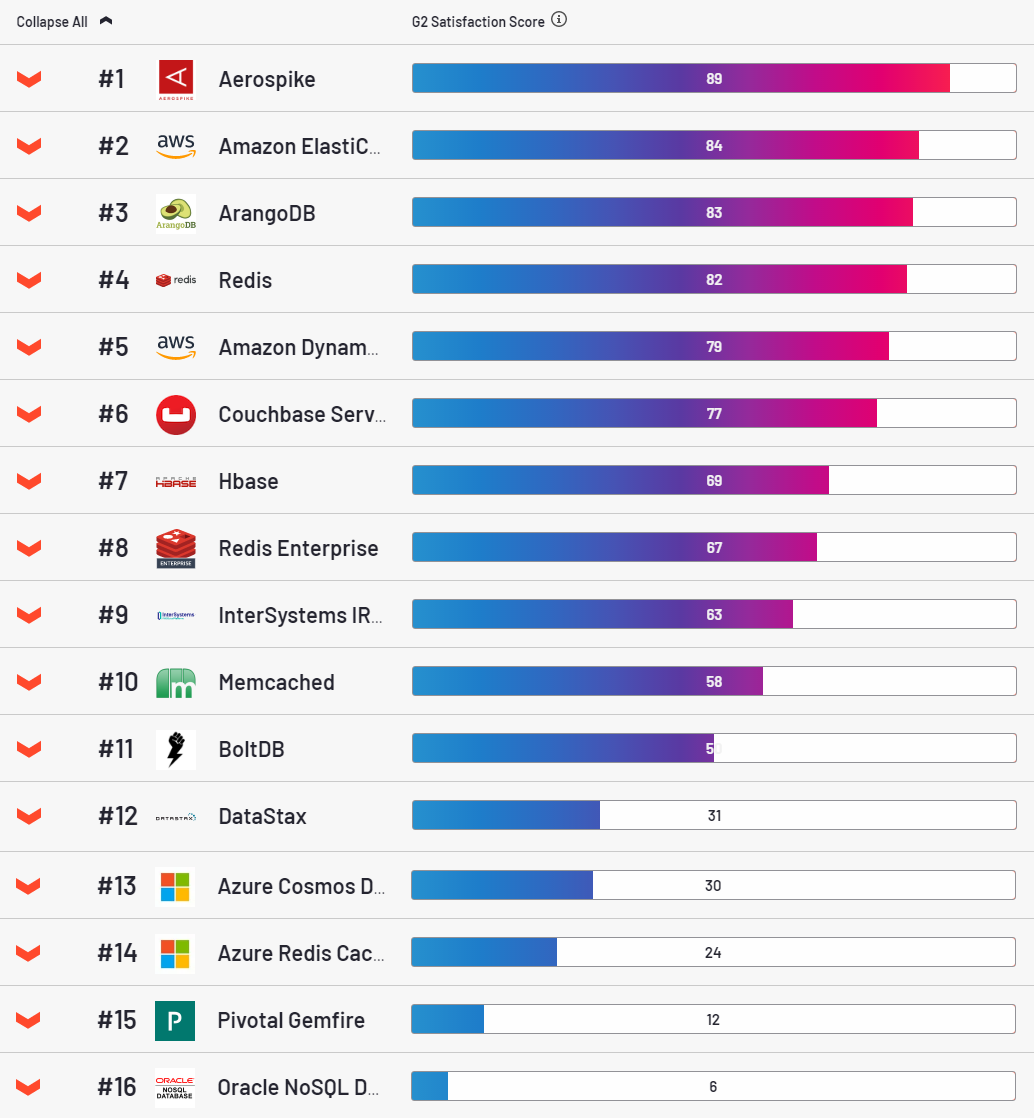
As for AS, this is a very attractive database, the leader in the customer satisfaction category according to the g2 resource.
Frankly, I somehow liked it too. It is put simply, with this scriptrolls out into the cloud quite easily. Stable, it is a pleasure to configure. However, it has one very big drawback. For each key, it allocates 64 bytes of RAM. It seems a little, but in industrial volumes it becomes a problem. A typical entry in our tables is 500 bytes. It was this amount of value that I used in almost * all tests (* why almost will be said below).
Since we store 3 copies of each record, it turns out that to store 1 PB of clean data (3 PB of dirty data), we will have to allocate only 400 TB of RAM. Moving on ... no what ?! Wait a second, is there anything you can do about it? - we asked the vendor.
Ha, of course you can do a lot of things, bend your fingers:
- ().
- .1, .
- all-flush. — , . , , entreprise ( trial-).
Okay, now let's deal with HB and we can already consider the test results. To install Hadoop, Amazon provides the EMR platform, which makes it easy to roll out the cluster you need. I only had to raise the limits on the number of processes and open files, otherwise it crashed under load and replaced hbase-server with my optimized assembly (details here ). The second point, HB shamelessly slows down when working with single requests, this is a fact. Therefore, we only work in batches. In this test, batch = 100. There are 100 regions in the table.
Well, and the last moment, all databases were tested in the "strong consistency" mode. For HB, it's out of the box. AS is available only in the enterprise version (i.e. it was enabled in this test). SC ran in write consistency = all mode. Replication factor is everywhere 3.
So, let's go. Insert in AS:
10 sec: 360554 operations; 36055.4 current ops / sec;
20 sec: 698872 operations; 33831.8 current ops / sec;
...
230 sec: 7412626 operations; 22938.8 current ops / sec;
240 sec: 7542091 operations; 12946.5 current ops / sec;
250 sec: 7589682 operations; 4759.1 current ops / sec;
260 sec: 7599525 operations; 984.3 current ops / sec;
270 sec: 7602150 operations; 262.5 current ops / sec;
280 sec: 7602752 operations; 60.2 current ops / sec;
290 sec: 7602918 operations; 16.6 current ops / sec;
300 sec: 7603269 operations; 35.1 current ops / sec;
310 sec: 7603674 operations; 40.5 current ops / sec;
Error while writing key user4809083164780879263: com.aerospike.client.AerospikeException $ Timeout: Client timeout: timeout = 10000 iterations = 1 failedNodes = 0 failedConns = 0 lastNode = 5600000A 127.0.0.1:3000
Error inserting, not retrying any more. number of attempts: 1Insertion Retry Limit: 0
Oops, you're definitely a
Okay, let's continue. We start loading 200 million records (INSERT), then UPDATE, then GET. Here's what happened (ops - operations per second):
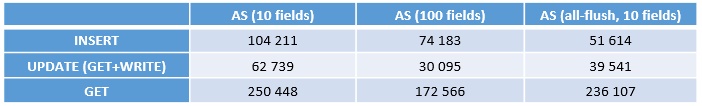
IMPORTANT! This is the speed of one node! There are 4 of them in total, i.e. to get the total speed, you need to multiply by 4.
The first column is 10 fields, this is not an entirely fair test. Those. this is when the index is in memory, which is unattainable in a real BigData situation.
The second column is packing 10 records into 1. there is already real memory savings, exactly 10 times. As you can clearly see from the test, this trick is not in vain, the performance drops significantly. The reason is obvious, each time to process one record, you have to deal with 9 adjacent ones. Overhead is shorter.
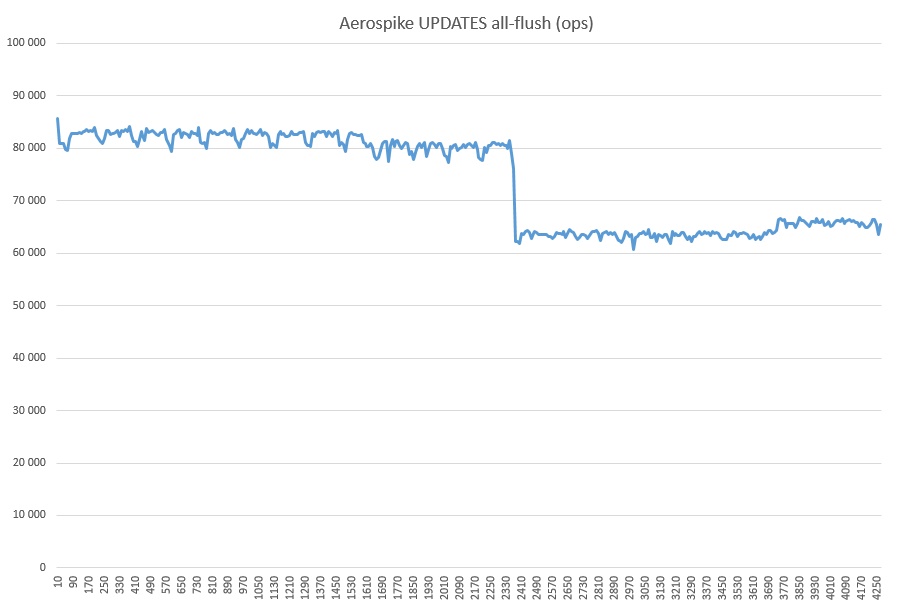
And finally all-flush, here is about the same picture. Flush inserts are worse, but the key Update operation is faster, so further we will only compare with all-flush.
Actually, let's not pull the cat, right away:

Everything is generally clear, but what should be added here.
- AS , .
- SC - , :

Perhaps somewhere there is a jamb with the settings or that bug with the kernel surfaced, I don't know. But I set up everything from and to the script from the vendor, so the moped is not mine, all questions are for him.
You also need to understand that this is a very modest amount of data and on large volumes the situation can change. During the experiments, I burned several hundred bucks, so the enthusiasm was enough only for a long-run leader test and in a mode limited to one server.
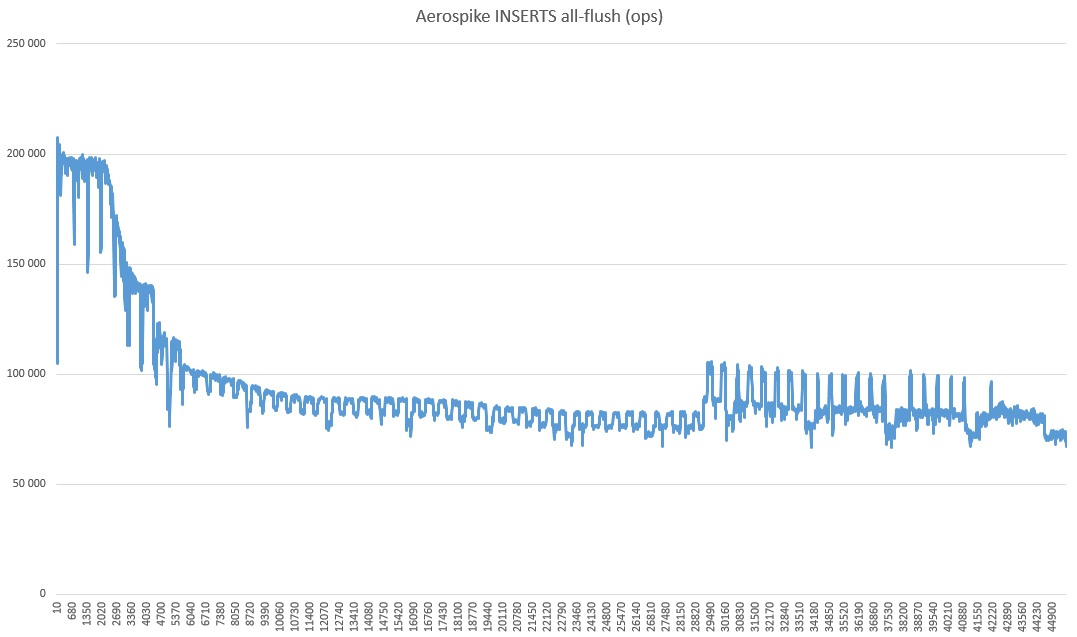
Why it has subsided so much and what kind of revival in the last third is a mystery of nature. You can also notice that the speed is radically higher than in the tests, slightly higher. I suppose this is because the strong consistency mode is turned off (since there is only one server).
And finally, GET + WRITE (on top of over three billion records flooded with the test):
What kind of drawdown is this, I don’t guess in my heart. No extraneous processes were started. Perhaps it has something to do with the SSD cache, because utilization was 100% during the entire AS test in all-flush mode.

That's all. The conclusions are generally clear, more tests are needed. It is desirable for all the most popular databases under the same conditions. In the internet this genre is somehow not very much. And it would be good, then the base vendors will be motivated to optimize, and we will deliberately choose the best ones.