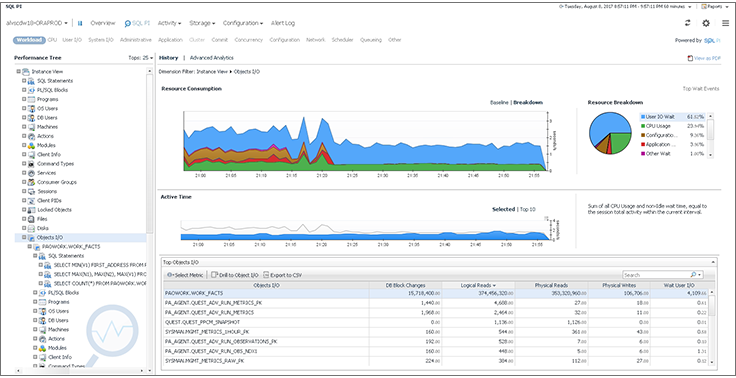
In addition, the tool allows you to compare the performance of the database in different periods of time (for example, before and after release), as well as to compare the performance of different instances.

We invite you to register for the webinar , which will take place on April 7 at 11:00 Moscow time... You will learn about the possibilities of the solution, use cases, licensing and will be able to ask questions of interest. If you are unable to attend the webinar, in any case, leave your contact details, we will send you a recording after the event. Below the cut is a description of the solution's functionality and a few screenshots.
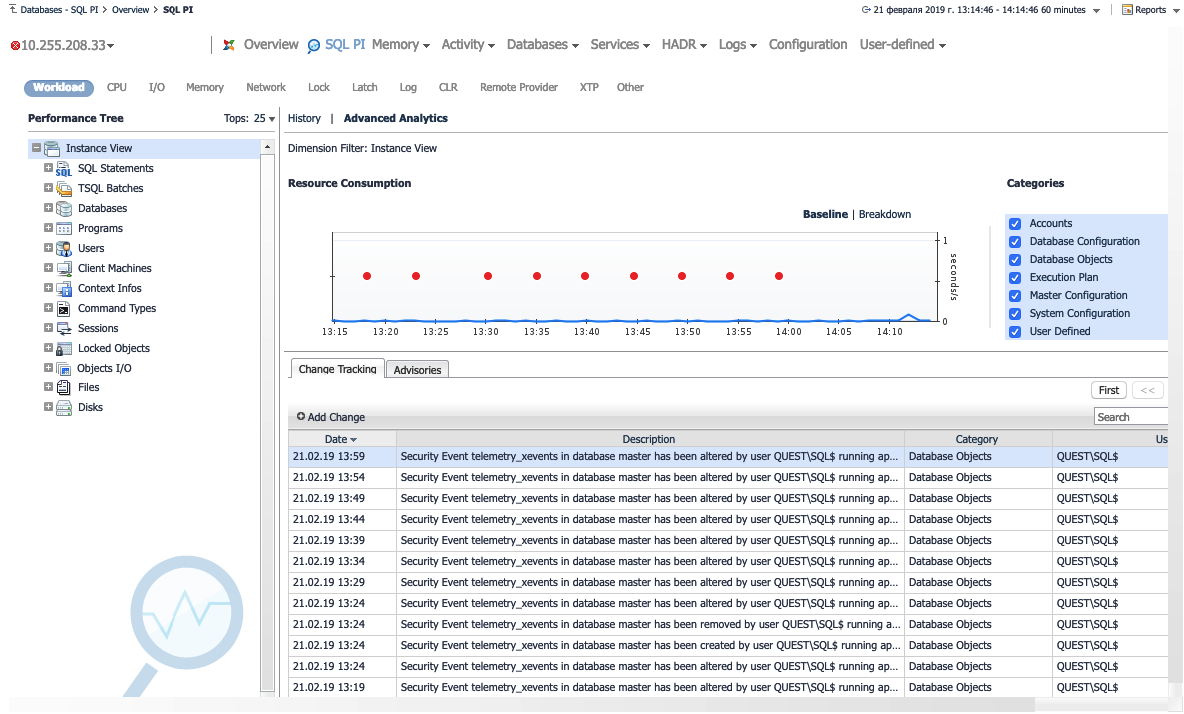
A key feature of SQL Server monitoring in Foglight for Databases is the Performance Investigator tool, which performs multidimensional analysis of database performance in terms of databases, long queries, sessions, users, executable scripts, workstations and applications. In the screenshot below, in the tree-like menu, you can view the performance of the database in several sections. In addition, Foglight captures changes to the database configuration, Execution Plan and other components.

In a previous article, we shared an example of how to diagnose the following issues in Foglight:
- Search for the source of blocking;
- Comparison of database settings "before and after" with reference to performance metrics;
- Search for changes in the database structure, due to which performance has decreased.
There are an abundance of similar cases with diagnostics in the solution.
To learn more about Foglight for Databases, you can also read our other articles:
How not to turn into a dragonfly if you have many different databases
Interfaces for monitoring the performance of popular databases in Foglight for Databases
Subscribe to our Facebook group and Youtube channel .