By the nature of my work, I am always between different departments - I do not even have a signature in my email who I am, because I myself do not know who I am. I recently automated the delivery of performance metrics SQL server with PROD to developers.
Specific information (SQL performance metrics) is not important, you can do this for any information, and even draw graphs. Charts are sent by mail and look something like this in the mail window in outlook:
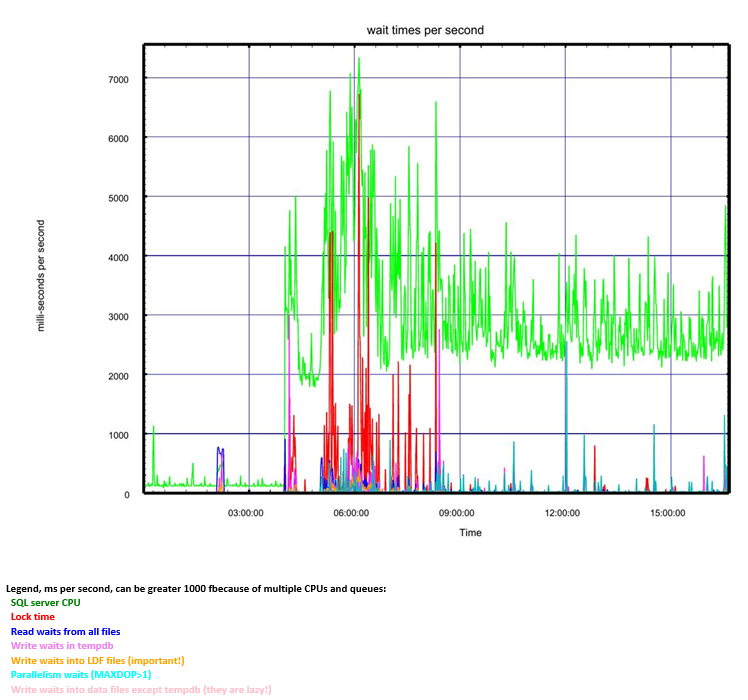
But before I go any further, let's give the floor to my imaginary opponent, the hipster zoomer, here he is in a hurry to speak out:

Man! Mail charts? What, seriously? Web interface, interactivity, Grafana - "no, haven't heard"? You would also draw graphics with asterisks in a letter, ASCII art.
Of course, my imaginary opponent is absolutely right in an ideal, imaginary world. Any pink unicorn flying there will confirm this to you. However, if we are not in a startup, but in a bloody enterprise, then everything is not so rosy.
-, PRODUCTION Enterprise (, CA PAM , copy/paste ). - , , .
-, , Grafana? , . " SQL PROD ". -, , ( security team) .
, on-prem, , . AWS ( PROD), , Department Billing Code, . , . Enterprise , - .
, email . , Grafana , screenshots. - . , ( - Junk )
connectivity (, , , ), , deploy (Jenkins, Octopus etc). - . , :

" - " (c) , Jenkins server, Job:
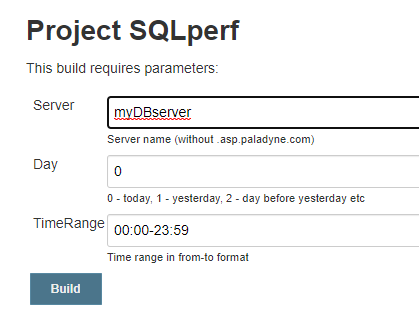
Jenkins powershell (, powershell Linux!) . performance , . :
makeChart $find @('3Read latency, microseconds','2Write Latency, microseconds') 'IO latency' 'Time' 'Times in microseconds' 'latency'
$find data set, . . makeChart:
# Xgraph colors
# 2 = red, 3 = blue, 4 = green, 5 = violet, 6 = orange, 7 = yellow, 8 = pink, 9 = cyan
function makeChart($ds, $cols, $title, $titleX, $titleY, $pngname)
{
	Out-File -FilePath $workfile -Force -Encoding ascii
	"Title = $title" | Add-Content $workfile
	"title_x = $titleX" | Add-Content $workfile
	"title_y = $titleY" | Add-Content $workfile
	$maxval = 0
	foreach ($c in $cols)
		{
		$colname = $c.Substring(1)
		$colch = $c[0]
		"color = $colch" | Add-Content $workfile
		$secf = -1
		foreach ($r in $find) {
			$val = $r[$colname]
			if ($val -gt $maxval) { $maxval = $val }
			if ($secf -lt 0) { $secf = $r.sec }
			$secl = $r.sec
			"$secl $val" | Add-Content $workfile
		}
	"NEXT" | Add-Content $workfile
  }
  $maxval = $maxval * 1.03
- . ? Xgraph. 90 , , Unicode (-Encoding ascii). - , ! , . Xgraph:
&D:\Apps\Xgraph\bin\xgraph.exe $workfile -pdf -hms -x_range $secf $secl -y_range 0 $maxval -out_file $pdf
, y, x ( ), (-hms) ... pdf . attachment, , . Poppler pdf png.
&D:\Apps\poppler\bin\pdftoppm -png $pdf $pngname
:
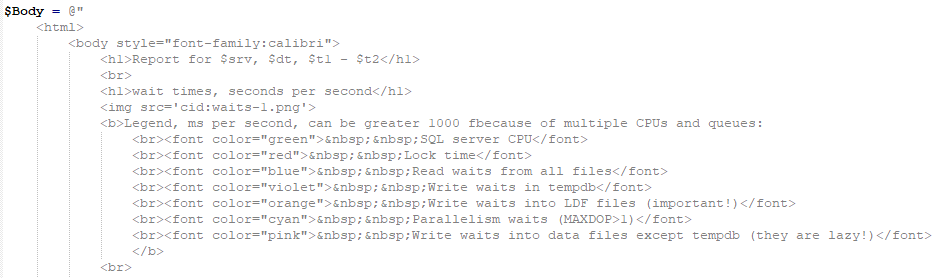
Here's extreme programming again - we have the bare and clean HTML of the post spill - no CSS, no javascript, and no anything at all. Please note that png has '-1' in its name, this is the first page (it is the only one in this case).
There is one more utility of a similar plan, it allows you to draw graphs according to their text description: graphviz . It can already directly output to png and jpg:

This is an example, as in another job I return the lock graph to users.