
Every year the line between man and machine is getting thinner. Of course, the level of "Deus Ex" is still far away, but now there are various kinds of prostheses, augmentation and other devices that work in close connection with the user's nervous system. One of the clearest examples of such futurism is NCI (neurocomputer interface), which ensures the exchange of information between the brain and the computer. The problem is that for the full-fledged operation of the NCI, a minor upgrade is required on the part of the user - the implantation of electrodes into the brain. It sounds much sinister than it actually is, but not everyone considers this method to be the most effective. Scientists at the California Institute of Technology (USA) have developed a system that reads brain activity using a non-invasive method based on ultrasound. How exactly the created device works,What did the scientists manage to see in the brains of the test subjects, and how accurate is this development? We will find answers to these questions in the report of scientists. Go.
Basis of research
The essence of the neurocomputer interface is quite simple - reading the neural activity of the human brain in order to understand its intentions. The information obtained can be used as signals to control neuroprosthetic devices. Exaggeratedly speaking, with the help of NCI, a person can control both a mouse cursor (without the mouse itself) and an electronic prosthesis with the power of thought.
It is in the field of prosthetics that this technology attracts the most attention. Since it is not always possible to use prostheses that read signals from nerve endings in the contact area or signals of muscle activity. LCI allows you to do without peripheral intermediaries and directly connect the user (that is, the brain) and the device.
The most modern neural interfaces are based on intracortical (within the cerebral cortex) electrophysiology, which provides direct access to the electrical signals of neurons with excellent temporal resolution. The problem with this technique is the need to implant electrodes, which is done through open brain surgery. It is obvious that such procedures have serious consequences in the form of chronic tissue damage and destruction of the implant material. In addition, invasive electrodes are difficult to scale and have a limited sample density and therefore cannot capture whole brain activity.
A logical solution to this problem is the development of a non-invasive method of connecting the device to the brain. One of the options is non-invasive electroencephalography (EEG), which has been under development since 1973. However, EEG performance is limited by the topographic representation of the activity of large brain volumes and the dispersion of the volume conductance signal through various tissues and bones.
In the work we are considering today, scientists propose an alternative in the form of NCI based on functional ultrasound imaging (fUS from functional ultrasound). fUS allows visualization of regional changes in blood volume using ultrafast Doppler angiography. This method provides excellent spatial-temporal resolution (<100 μm and 100 ms) and high sensitivity (speed ~ 1 mm / s) with a large field of view (several centimeters, which is quite a lot for such devices).
fUS was developed back in 2011. Since then, it has been frequently used to visualize neural activity during epileptic seizures, process olfactory stimuli, and perform behavioral tasks in rodents. Experiments have also been carried out with pigeons, ferrets and primates. In addition, fUS is 5-10 times better in terms of space-time resolution and sensitivity compared to fMRI (from functional MRI, i.e. functional MRI), due to which you can get much more information about the activity of the brain.
In the course of the study, experiments were carried out with two experimental monkeys: one was trained to perform saccades (sharp eye movements) to focus on an object (track figures on the screen), and the second was trained to perform certain movements from memory (control a lever). In practical experiments, scientists read neurovascular activity over the posterior parietal cortex (PPC for posterior parietal cortex ) through a minimally invasive cranial window.
Why exactly the posterior parietal cortex? This area is an association zone located between the visual and motor cortex regions. She is actively involved in high-level cognitive functions, including spatial attention, multisensory integration, and sensorimotor transformations for movement planning. The PPC itself can be divided into functionally specific subareas: lateral intraparietal area (LIP from lateral intraparietal area ) - eye movement planning (when we are going to look at something); parietal region of capture (PRR from parietal reach region ) - planning the movement of the capture of an object (when we are going to pick up something).
Scientists note that fUS allows you to simultaneously visualize both sub-regions (LIP and PRR), i.e. they will be within one frame (approximate slice volume 12.8 x 13 x 0.4 mm). In addition, because PPC encodes high-level aspects of motion planning, it is a unique source of control signals before actual motion.
Preparation for research
A miniature transducer (transducer) with a linear array of 128 elements (15 MHz) was installed epidurally (over the dura mater) through the cranial window. This sensor has provided fUS images that serve as the basis for the analysis of neurovascular signals in PPC related to the task at hand. The transducer provided a spatial resolution of 100 x 100 µm in the plane, a slice thickness of ~ 400 µm, covering a plane with a width of 12.8 mm and a penetration depth of 16 mm.
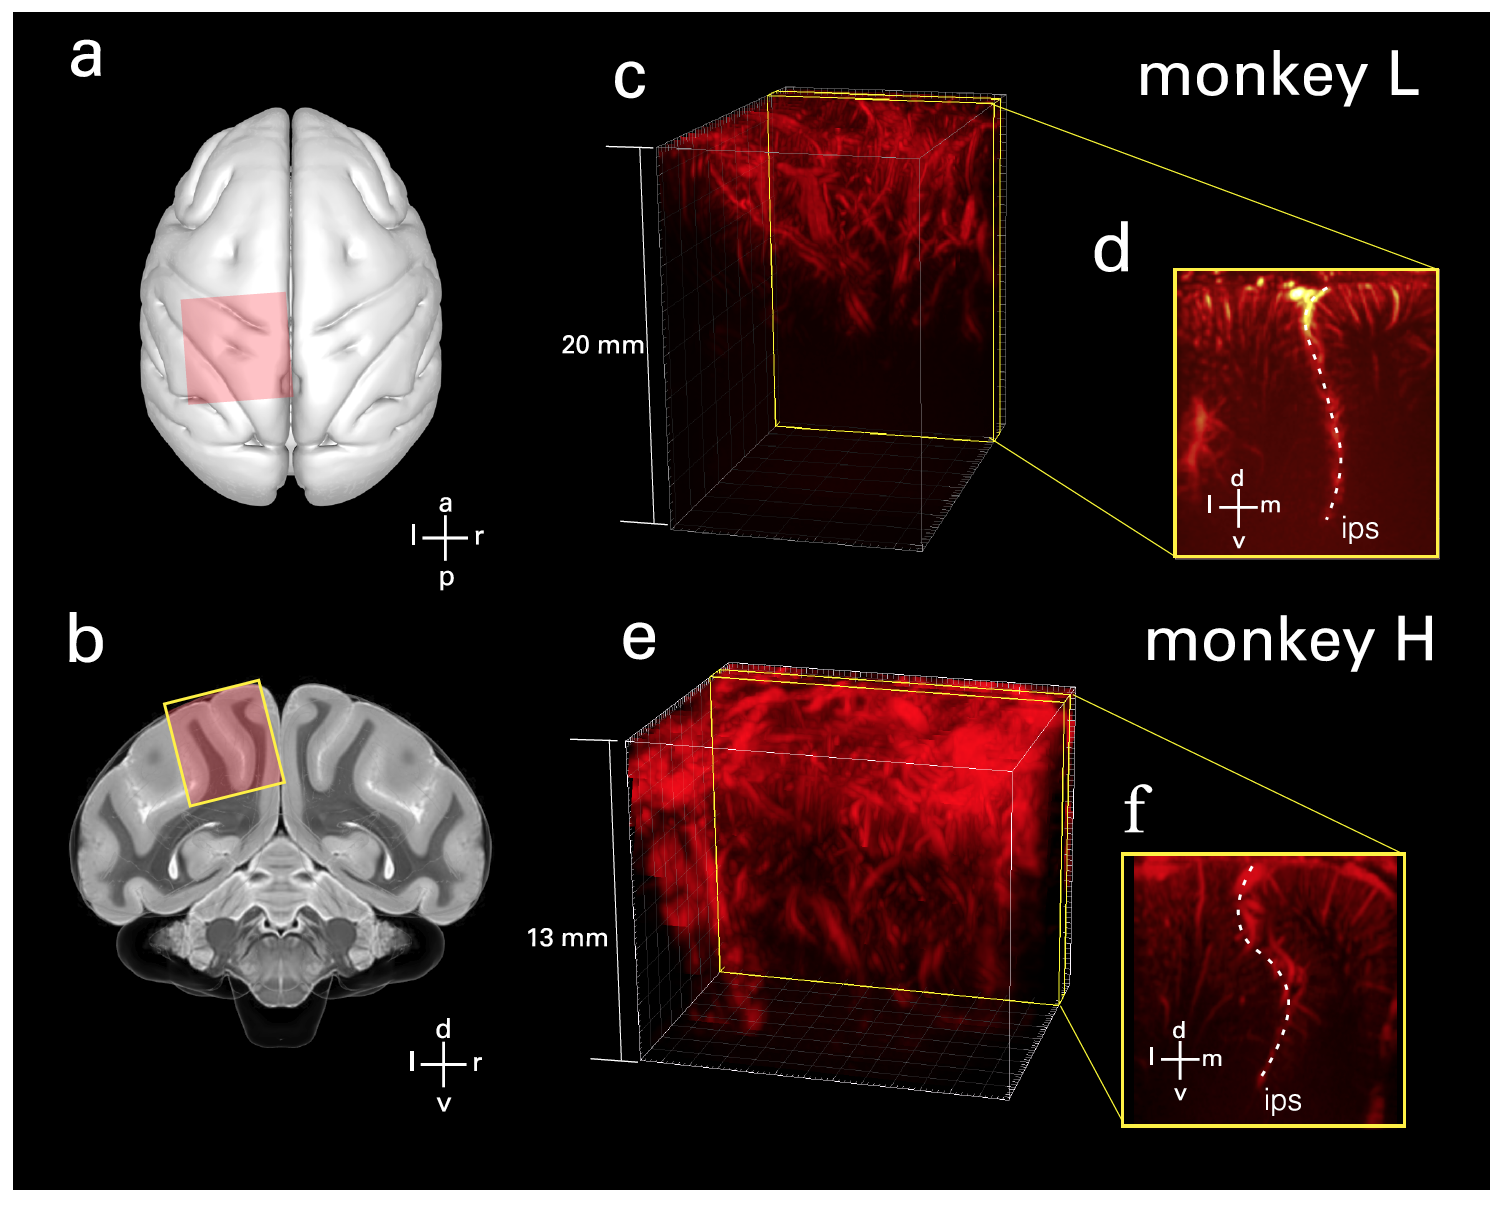
Image # 1 The
probe was positioned perpendicular to the surface in a coronal orientation on the dura mater over the PPC ( 1a and 1b ). Further, from the available volumes, the planes of interest were selected ( 1c- 1f ).
Specifically, planes were selected that displayed behaviorally-tuned hemodynamic (blood movement) activity and captured both the lateral and medial sides of the intraparietal sulcus (IPS from intraparietal sulcus ; sensory-motor coordination) in a single image. This made it possible to assess the roles of several areas of the brain simultaneously. And the geometry of the ultrasound image allowed access to the cortical areas in the grooves.
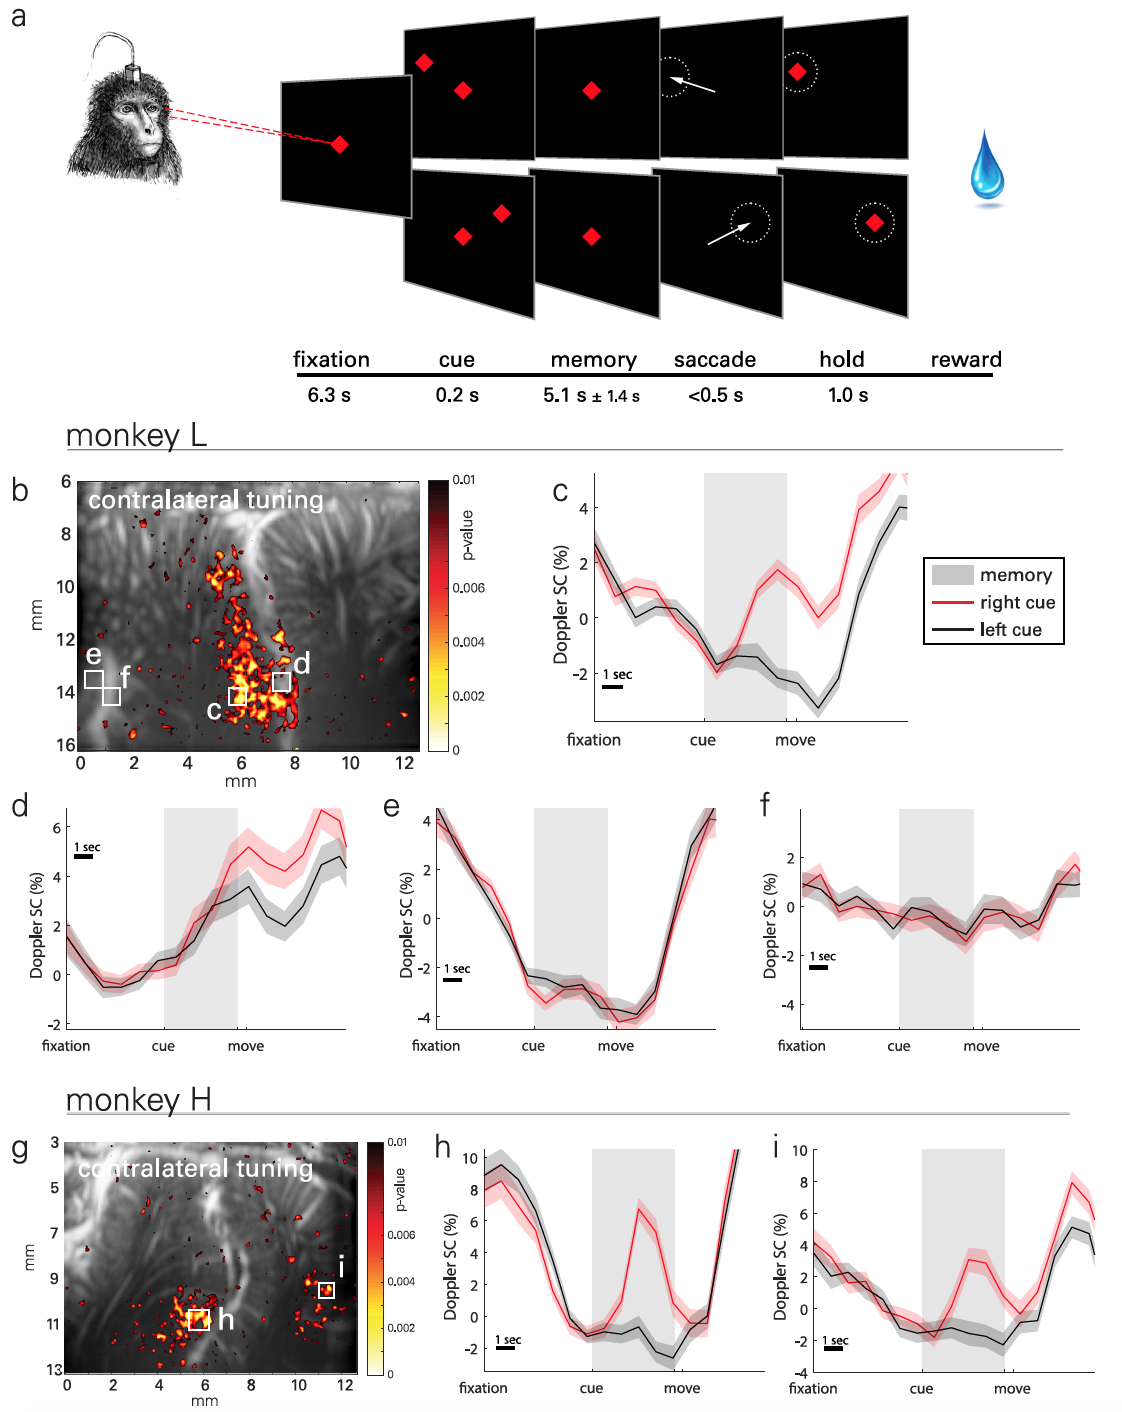
Image No. 2
The essence of practical experiments was that the monkeys had to memorize the location of the object located on the left or right side of the screen and perform the movement after the object in the center of the screen went out ( 2a ). The memorization phase was long enough (5.1 ± 1.4 s) to record transient hemodynamics. In total, data were collected from 30 test runs performed over 18 days. Up to 5 runs were performed each day, each of which included 30-minute randomly generated goals for one task.
To visualize the spatio-temporal patterns of lateralized activity in PPC ( 2b ), statistical parametric maps were used based on the Student's t-test ( example of calculating Student's t-test ).
The result observed associated with tasks medium (ERA from the event-related average ) changes in cerebral blood volume (CBV of cerebral blood volume ) of the localized regions of size 100 x 100 mm ( 2c - 2f ). Photo 2g shows a typical map of the activity of the second subject, and 2h - 2i of his ERA.
Signals of neurovascular activity were observed on the lateral side of the IPS, that is, in the LIP, for both animals. However, the ERA waveforms were similar between subjects in this area.
High sensitivity and spatial-temporal resolution fUS allow distinguishing functions between adjacent regions on a scale of hundreds of microns, for example, within PPC sub-regions such as LIP.
For example, the second LIP region ( 2d ) also shows contralateral attunement, but the difference in activity arises later in the memorization period and persists during movement and between experiments.
One subject (monkey H) showed a similar directional response in the medial parietal region (MP from medial parietal ) on the medial wall of the hemisphere. But in monkey L, no such effect was found, since in her case the location of the probe was optimized for the LIP region, and not the MP, which in this case was off-screen. However, this setting further confirms the role of MP in directional eye movement.
Signal decoding process
Before considering the results of practical experiments, scientists are reminded that the main task of NKI is to predict the forthcoming proposed action using brain signals. To understand whether fUS visualization helps to achieve this task, the prediction of the direction of the subject's upcoming eye movement was carried out on the basis of one test run.
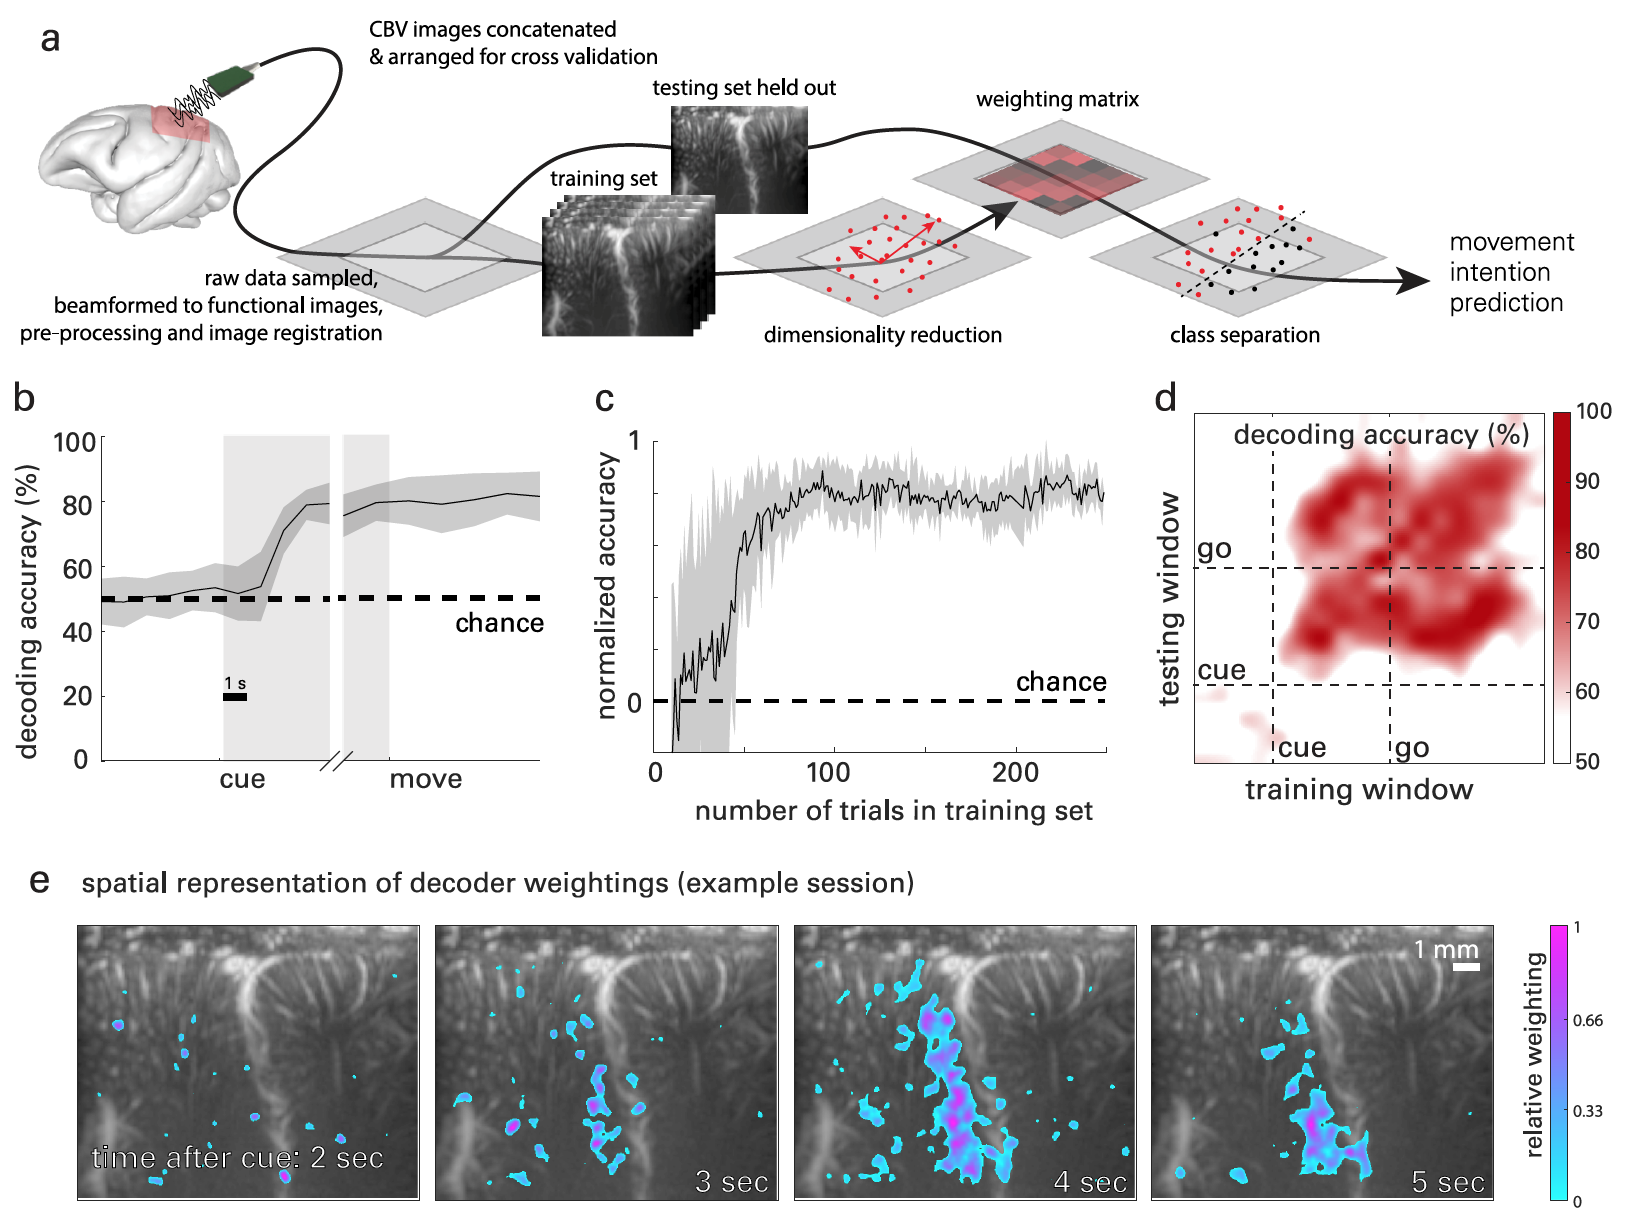
Image # 3
Figure 3a shows a graphical interpretation of the brain signal decoding process based on fUS data. Classwise principal component analysis (CPCA ) was used to reduce dimensionality * data, but retaining enough components to obtain> 95% of the variance in the data.
Dimension reduction * is a data transformation process when the number of variables is reduced by obtaining the main variables.Next, ordinary least squares regression (OLSR ) was used to regress the PCA-transformed data before the actual execution of the motion.
To analyze the temporal evolution of the PPC signals associated with the execution of the task, the direction of movement in time was deciphered through the stages of each experimental approach: fixation (looking at the central object), memorization, and movement.
For each time point, all previous data from both training and test data were used. For example, at t = 2 s, it was necessary to include all data in the training and testing datasets in t = from 0 to 2 s.
The resulting curves ( 3b ) show the accuracy at the level of randomness during the fixation phase, minor changes during the storage phase, and stable decoding accuracy during the movement phase.
During the memorization phase, decoder accuracy reached 2.08 s ± 0.82 s after the subject received the direction signal, but before the actual movement. In the future, the accuracy of the decoder only increased.
Reanalysis removed all data from the training set. This made it possible to determine the amount of data required to achieve maximum decoding accuracy ( 3c). After 27 test runs, the accuracy of the decoder became such that data from only 10 training runs were needed for the subsequent prediction and classification of motion. The maximum level of decoder accuracy was achieved after 75 test runs.
In other words, the scientists were able to minimize the amount of data required to accurately recognize brain signals, while the level of accuracy of this process remained quite high.
Additionally, an analysis was carried out to determine what information is contained in the brain signals used by the decoder. For this, the method of dynamic decoding was used, which requires data for a period of 1 second to train the decoder. Further, the assumed direction was decoded from the data windows with a duration of 1 s throughout the entire test run. That is, the decoder had to understand what the monkey was going to do by analyzing the data of a period of only 1 second.
As a result, an array of nxn precision values was obtained, where n is the number of time windows checked. 3d shows the accuracy for each learning / decoding combination.
Test results
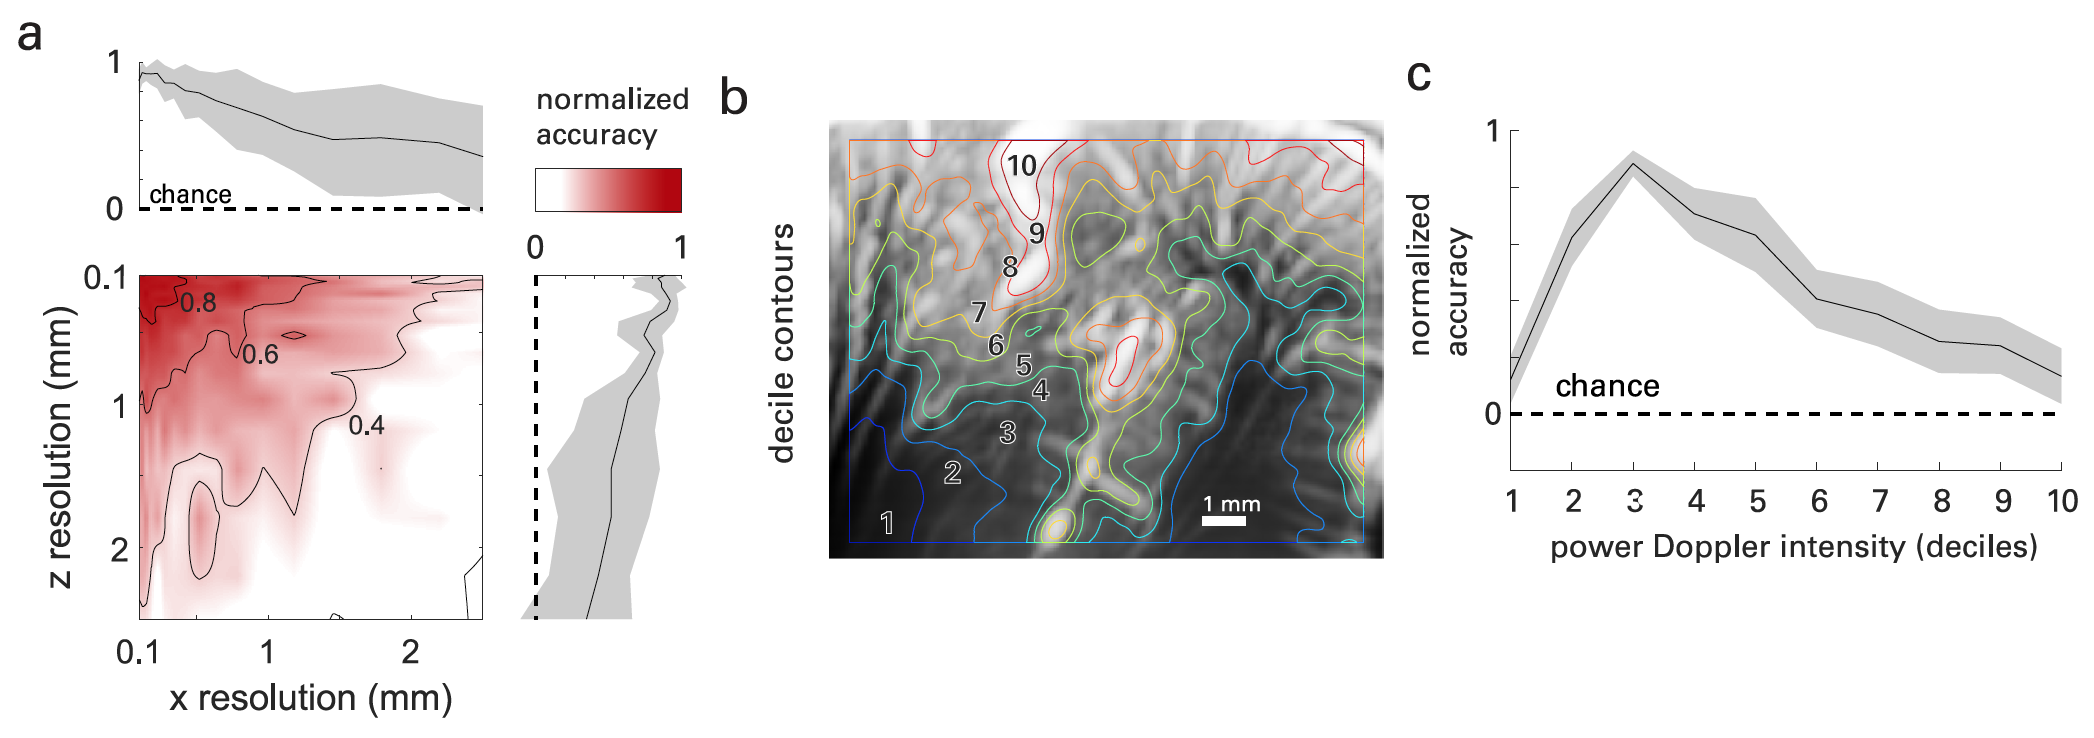
Image # 4
fUS imaging provides high spatial-temporal resolution and sensitivity, in contrast to the fMRI method. This provides data on neurovascular dynamics on a previously inaccessible scale.
It was easy enough to check this. If we change the dimensions (in x - that is, along the surface of the probe and in z - that is, in the depth of the image) of the images obtained during the experiments, then the decoding accuracy will decrease with the increase in the size of the voxels ( 4a ).
Recent studies have shown that functional hyperemia begins in a vascular region called the primary unit. This section includes parenchymal arterioles (small arteries in front of capillaries) and capillaries, that is, vessels with a diameter of <50 μm. Hence, the blood flow velocity increases in the lower capillaries and upper arterioles.
With this in mind, the scientists decided that most of the functional information used for decoding would be found in vessels with subresolution (<100 μm) in the image plane. To test this hypothesis, vascular fUS maps of the brain were (spatially) segmented by ordering voxels according to their mean Doppler intensity and segmenting them by deciles * ( 4b ).
The decile * characterizes the distribution of the values of the population, in which nine decile values divide it into ten equal parts. Any of these ten parts is 1/10 of the total.While deciles 1–2 mainly involve the subcortical regions, deciles 3–8 involve the cortical layers, where the more superficial layers show a higher average intensity. Deciles 9 and 10 were mainly confined to the vasculature of the primary units (large arteries, usually on the cortical surface and in the sulci). On 4c shows the resulting accuracy of the decoding according to the Doppler power intensity.
Analysis of the data showed that neurovascular activity during a task, as measured by fUS, exists primarily in the anatomy of the vessels located in the cerebral cortex. That is, the greatest contribution to the cortical fUS signals was made by axial flow velocities in the range from 2 to 10 mm / s, which corresponds to vessels with a diameter <50 μm, i.e. namely arterioles and capillaries.
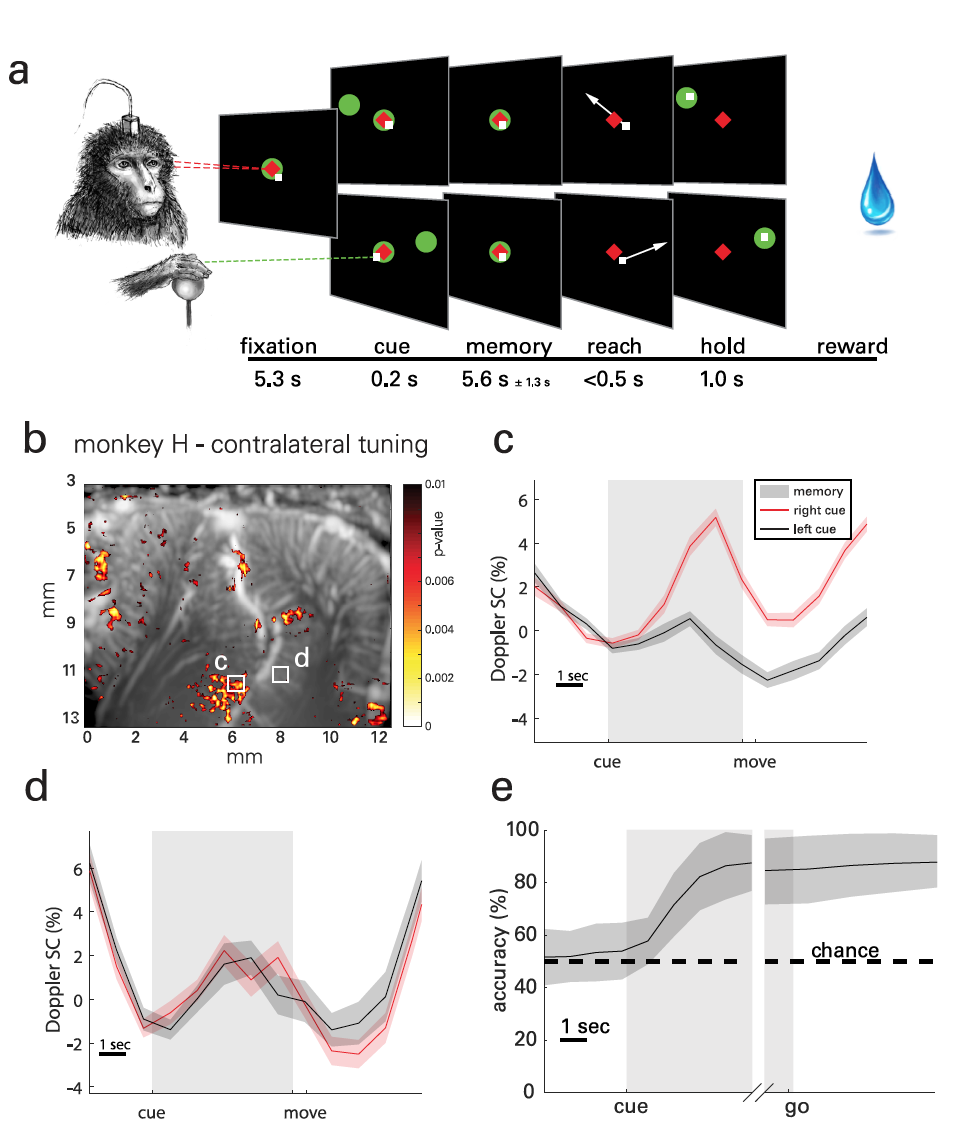
Image # 5 Finally
, another test was performed in which the subject had to operate a lever while looking at objects on the screen ( 5a ). This task was in many respects similar to the saccades task, but the animal's gaze remained fixed throughout the test, including during the phases of fixation, memorization, and execution of the movement.
ERAs (task-related mean changes) on the lateral side of the intra-parietal sulcus in the putative LIP (intra-parietal region) identify populations relevant to predicting direction of movement ( 5b - 5c ). Populations on the medial side in the putative parietal retention area (PRR) do not exhibit these characteristics, but exhibit a bilateral attunement to actual movement ( 5d ).
These results are consistent with electrophysiological recordings in which PRR neurons as a population encode both hemispheres, while LIP neurons encode mainly the contralateral space.
The decoding accuracy and its temporal evolution were similar to those observed in experiments with saccades ( 5e ). Specifically, cross-validated target decoding accuracy ranged from 72.96% to 94.64% over a 30 minute test. The average accuracy for all experimental sessions was 88.54%.
For a more detailed acquaintance with the nuances of the study, I recommend that you look into the report of scientists .
Epilogue
Neurocomputer interfaces, despite the futuristic concept, are becoming more real every year. Their functionality, characteristics and capabilities are expanding, as is the range of possible applications. However, as with any relatively new technology, problems cannot be avoided.
One of the main problems in the implementation of a full-fledged NKI is the need for an invasive connection. Few people want to switch channels, for example, if it requires opening the skull and inserting a couple of electrons into the brain. And it's not even about the inconvenience of such a head "accessory", but about the dangers it carries. The invasive method of connecting the NKI leads to systematic violations of the tissue structure and destruction of the material of the device itself.
The solution to this problem is functional ultrasound imaging (fUS), which allows you to track brain activity in these areas with incredible accuracy with a resolution of up to 100 microns. And this is really impressive, given that the size of one neuron is approximately 10 microns.
The authors of this technique claim that their brainchild is much more productive than other methods. The implanted electrodes can very accurately measure the activity of the brain at the level of individual neurons, but require direct contact with the brain. fMRI (functional MRI) does not require implantation and can show whole-brain activity at once, but the equipment for this method takes up an entire room. Electroencephalography also does not require the introduction of electrodes, but its spatial resolution is extremely low. But the fUS method, according to scientists, is devoid of the above disadvantages.
The principle of fUS is based on the blood flow in the brain. When activity in an area of the brain increases, blood flow to it increases. fUS allows this to be monitored by providing high-resolution dynamics of brain blood flow in space and time. Analysis of blood flow data allows you to find out which areas are active at a particular point in time.
The fUS accuracy at this stage of development is very close to the method with implanted electrodes. But unlike the latter, fUS does not need full implantation. To work with electrodes, it is necessary to open the dura mater located under the skull and insert the electrodes directly into the brain. In the case of fUS, a small window capable of transmitting ultrasound is sufficient. At the moment, this window is made by opening the skull, but without any intervention in the brain itself. This option is significantly less invasive, and therefore less dangerous.
In the future, scientists intend to continue to improve fUS in order to achieve even greater accuracy, as well as conduct experiments on people who, due to brain injuries, underwent trepanning of part of the skull bones.
Thanks for your attention, stay curious and have a great weekend, guys! :)
A bit of advertising
Thank you for staying with us. Do you like our articles? Want to see more interesting content? Support us by placing an order or recommending to friends, cloud VPS for developers from $ 4.99 , a unique analogue of entry-level servers that we have invented for you: The Whole Truth About VPS (KVM) E5-2697 v3 (6 Cores) 10GB DDR4 480GB SSD 1Gbps from $ 19 or how to divide the server correctly? (options available with RAID1 and RAID10, up to 24 cores and up to 40GB DDR4).
Is Dell R730xd 2x cheaper in Maincubes Tier IV data center in Amsterdam? Only we have 2 x Intel TetraDeca-Core Xeon 2x E5-2697v3 2.6GHz 14C 64GB DDR4 4x960GB SSD 1Gbps 100 TV from $ 199 in the Netherlands!Dell R420 - 2x E5-2430 2.2Ghz 6C 128GB DDR3 2x960GB SSD 1Gbps 100TB - From $ 99! Read about How to build the infrastructure of bldg. class with the use of Dell R730xd E5-2650 v4 servers at a cost of 9000 euros for a penny?