
How in the 1940s was it possible to record the output of your 3 millionth analog computer at high speed when the results of its operation are visible only on analog meters? This problem was faced by a team at Georgia Institute of Technology responsible for a computer that was used to study the properties of AC power grids. They came up with a clever solution - hack the control panel and connect a special drawing table to it.
What is it?
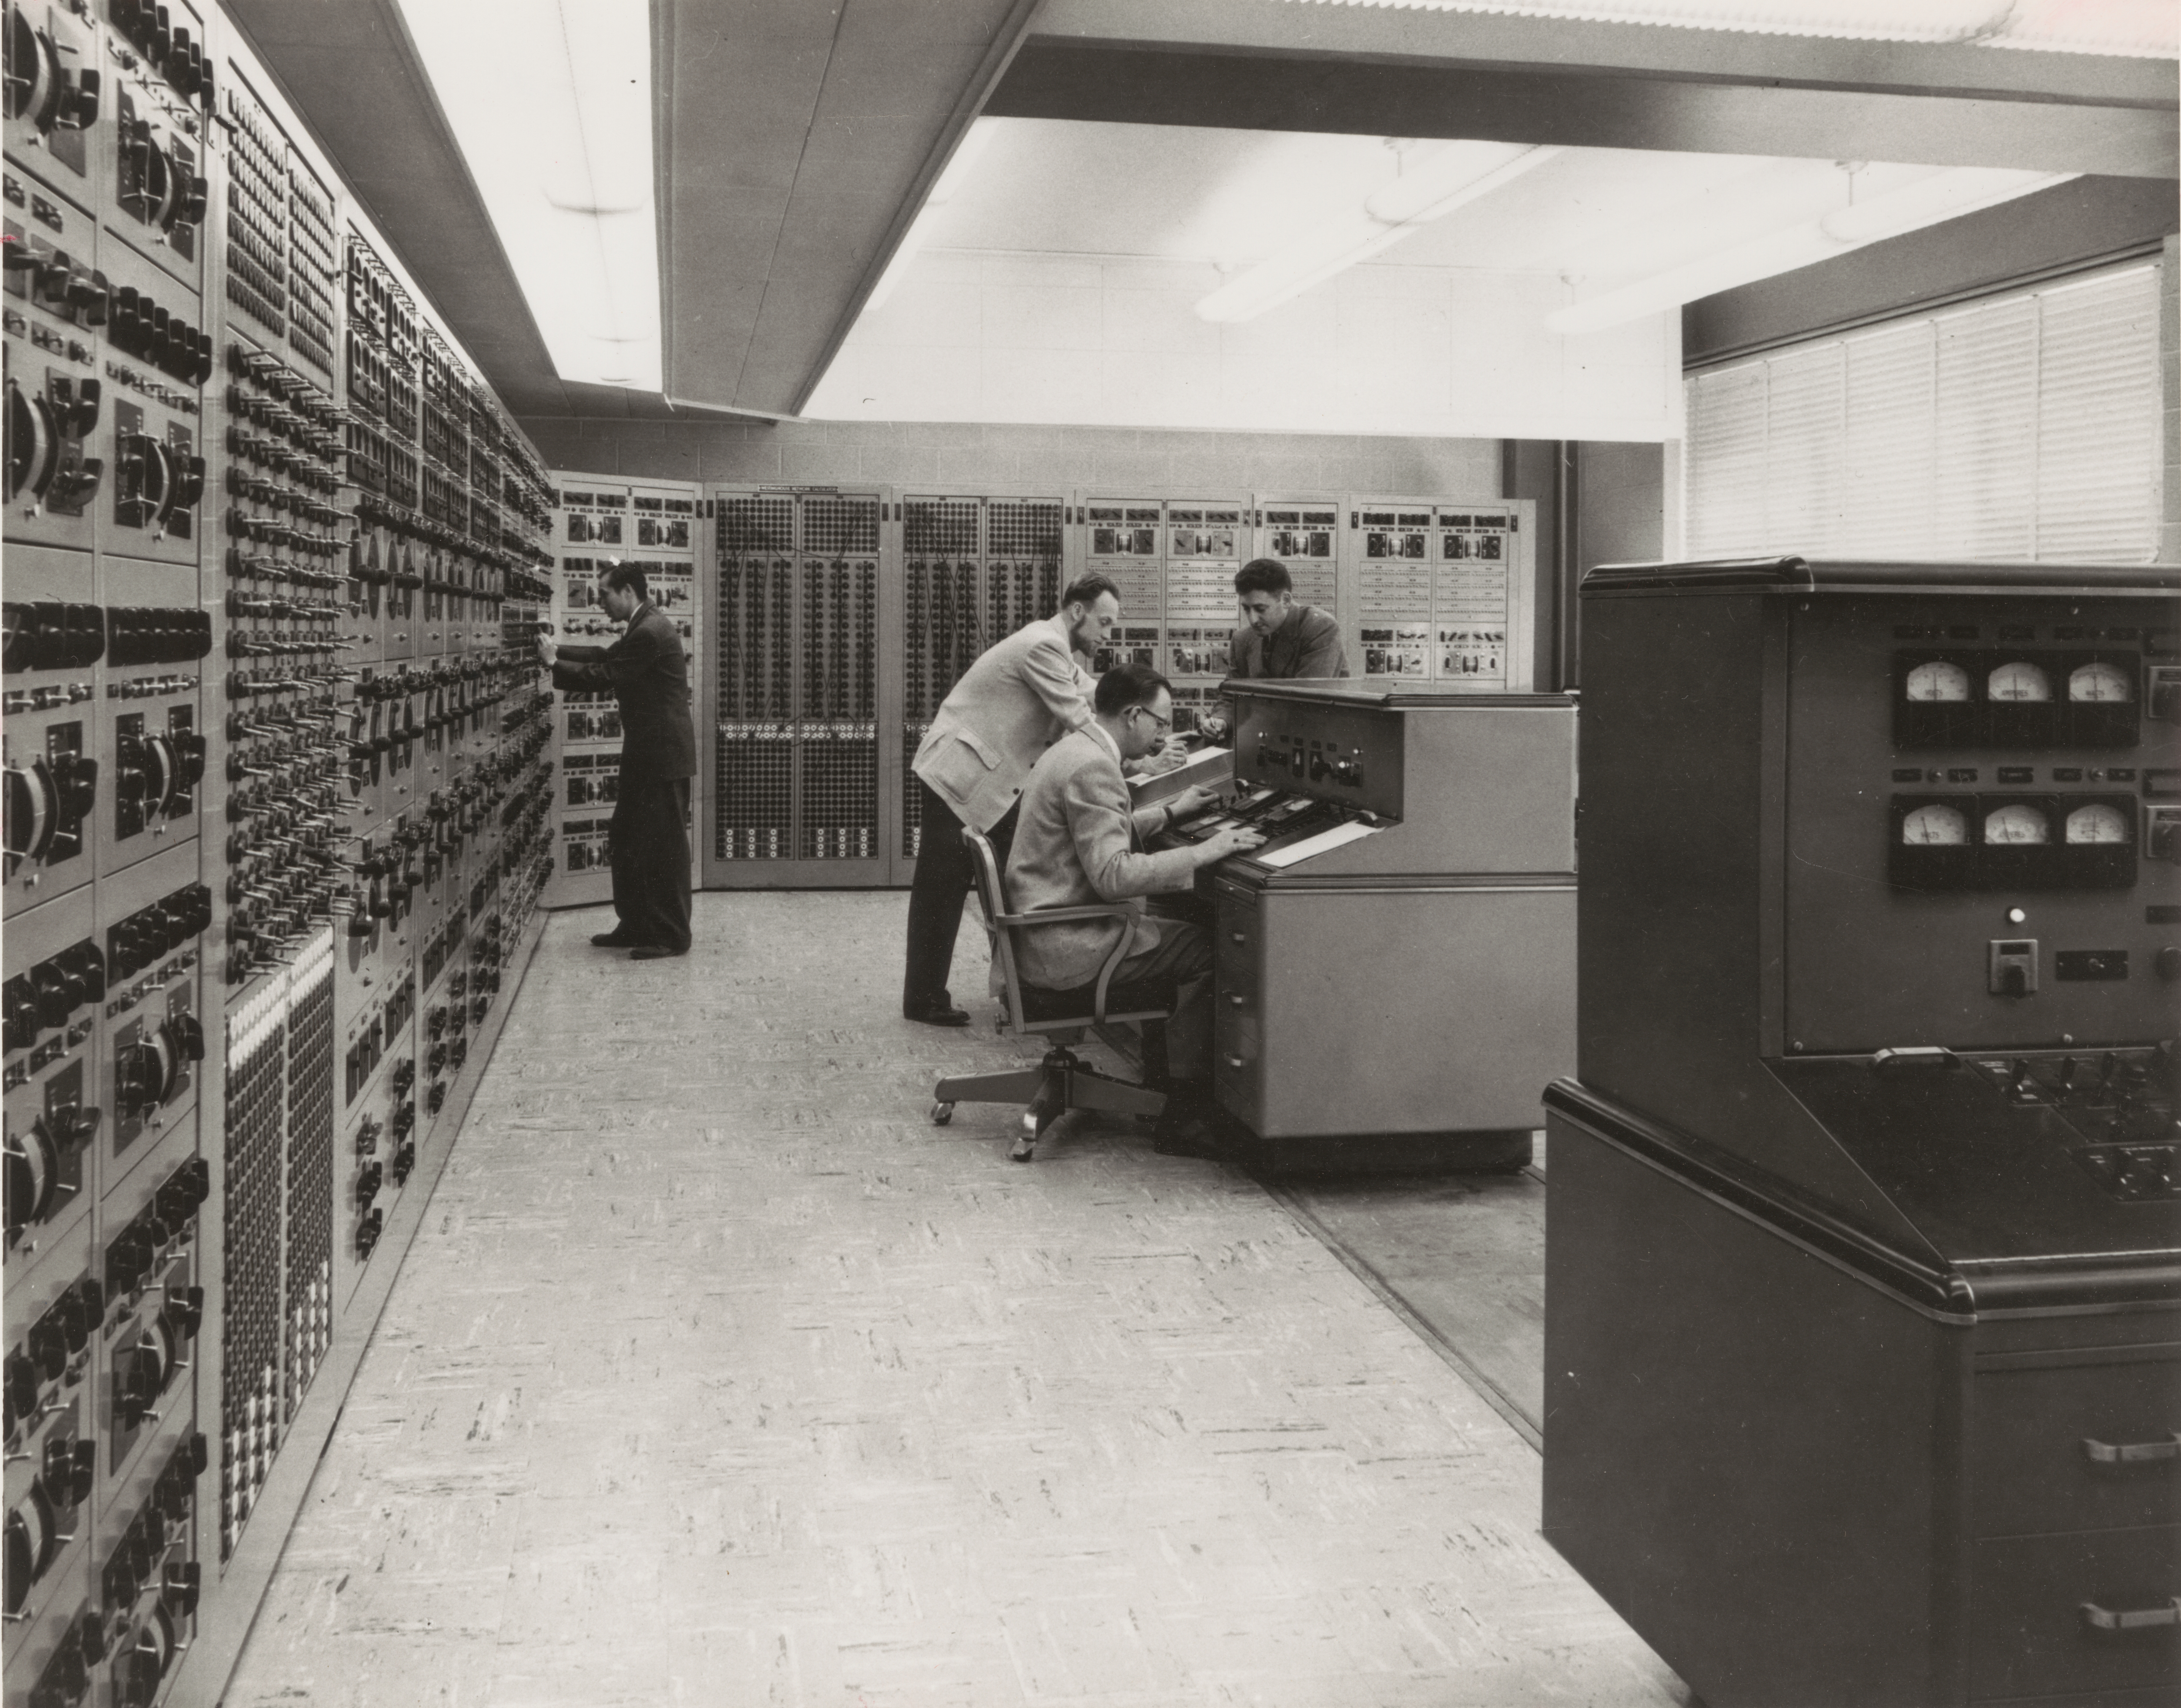
What kind of beast is this - an analog computer? Similar machines were developed during and after World War II. Strictly speaking, it would be more correct to class them as scale models than to call them real computers. Although they were quite flexible, they were mainly designed to simulate power transmission networks. The theory of their operation is quite extensive, but for measurements, a scale model of real multiphase power transmission networks operating on one phase and a frequency of 400 Hz was simply built.
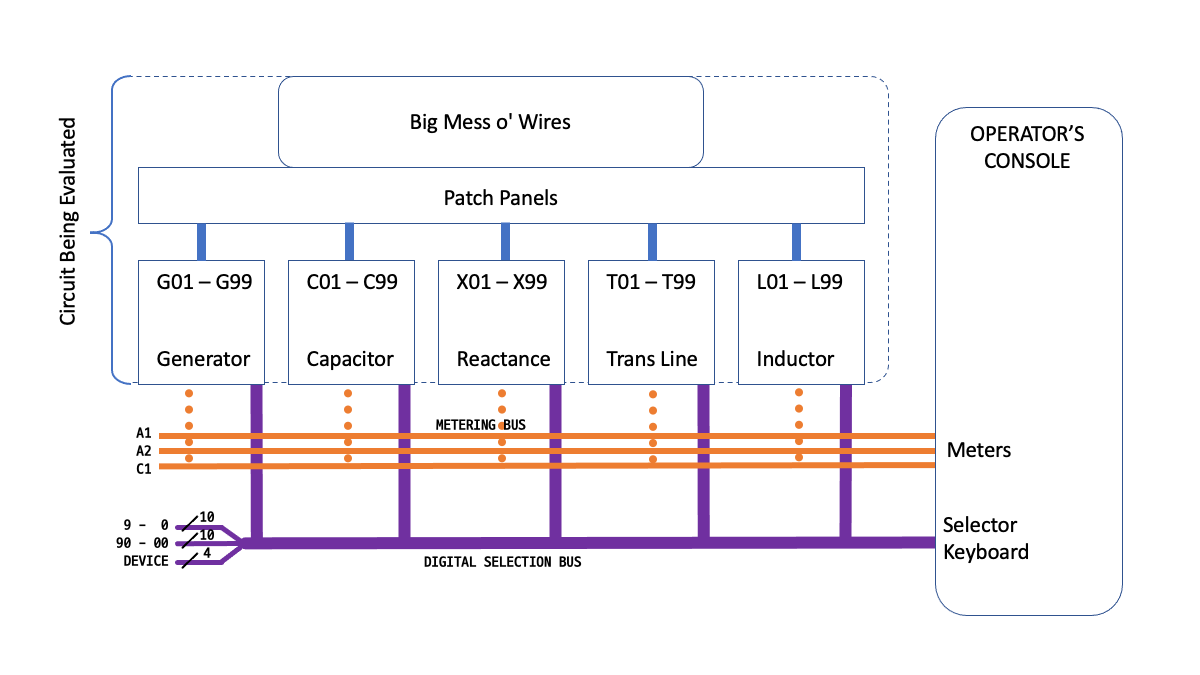
Engineers "programmed" the machine by connecting the necessary circuit elements (capacitors, inductors, transmission lines, generators, etc.) on large patch panels. After that, a 10 kW generator located in the basement was started up, and the simulation began to work.
Part-time work
In the early 1980s, my first challenge in college was to restore one of these machines to working order. It was bought by Georgia Power in 1947 and donated to the Georgia Institute of Technology. There she worked practically without interruption for several decades. Then for a while it was used as a teaching aid, and transported a couple of times. When I entered the game, it had not been used for a long time and was in a deplorable state.
Surprisingly, it turned out to be quite easy to repair. It was necessary to replace the patch panels, since all the insulation on them was dry and cracked. From the switches and contacts of all elements of the electrical circuit, it was necessary to remove the dirt that had accumulated there for decades. For several semesters, this quiet basement was my refuge. I used it when I needed to sit in silence, study, or read. Sometimes I amused myself by running the machine to calculate some of the problems from the textbook on calculating AC networks.
The working process
After the generator was started and stabilized at the desired frequency, the simulated network could be monitored by connecting the measuring circuits of the operator's console to any element of the circuit. This was done by pressing a button with the appropriate designation on the keyboard, which looked like an old mechanical adder (perhaps it was). Almost immediately, data on the current, voltage and power consumption of the element appeared on the devices. The quantities were compound, so both the quantity and the phase were shown on the meters.
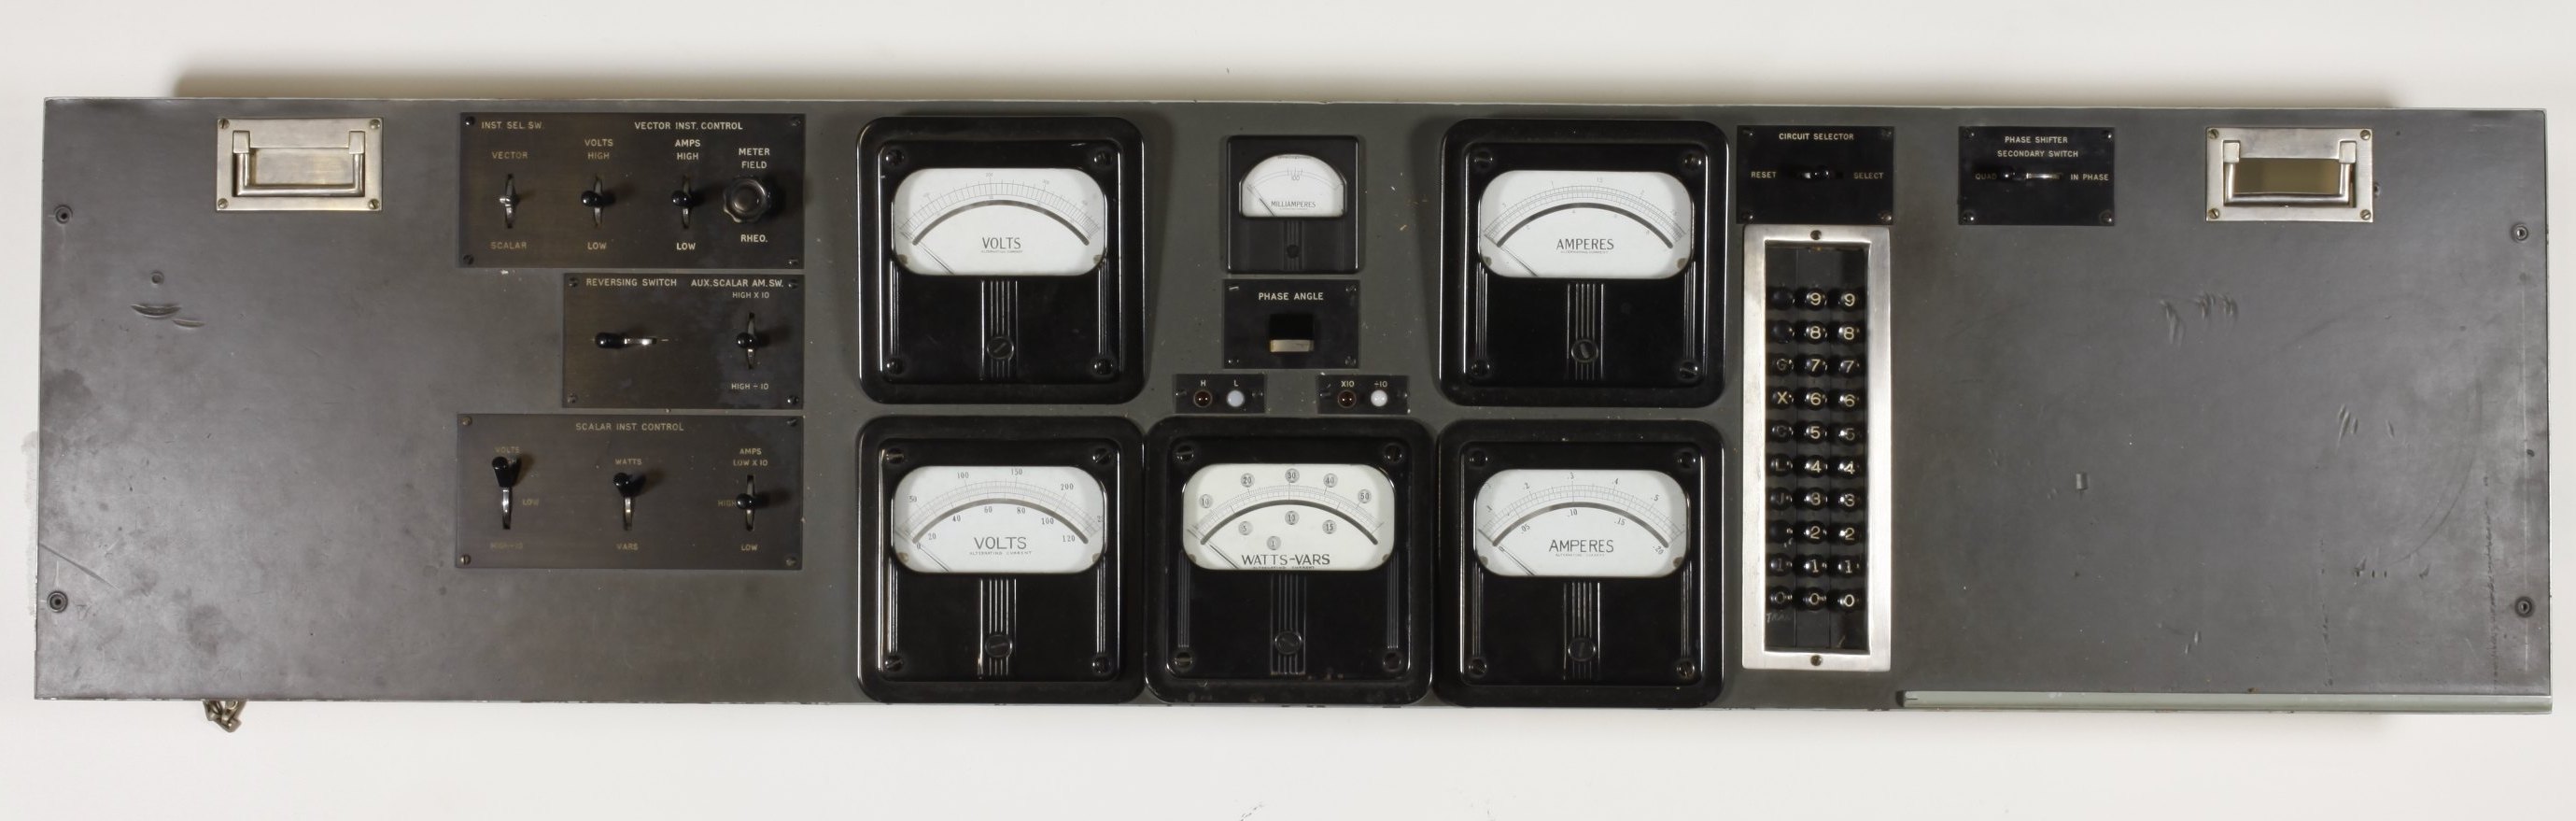
Control panel
Operators received the result of simulations by sequentially going through all the necessary circuit elements. After each measurement, they paused to write down the numbers in a notebook and then move on to the next item.
Interestingly, this whole system was one passive circuit with no active components. Of course, it had relays for connecting measuring instruments, and the generator provided energy. But besides that, all this reading of data from the console was no different from how if a technician with a multimeter walked around the entire circuit and manually took readings. One exception was that one of the measuring instruments was powered by an electronic tube amplifier. However, it was only used for one type of measurement - in my opinion, it was VARS. Even with the amplifier turned off, the machine was fully operational and useful.
We can do better
The team decided to improve the calculator to make it easier for engineers to record and interpret the results. They wanted to draw the results directly on the diagram, setting up a special table next to the operator's console.
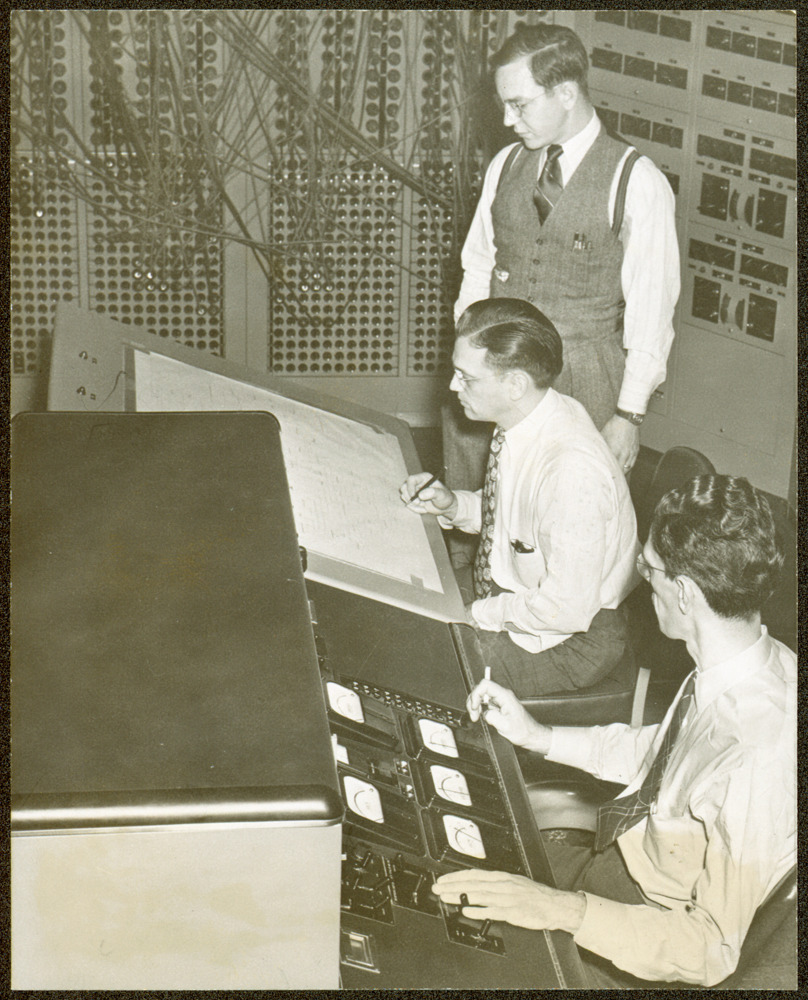
Recording Simulation Results
The table top was like nothing you've ever seen. She rose in the manner of the hood of a car, she even had a support. The lid was metal, with a clear plastic coating to keep the surface smooth. A mesh of holes was made in the lid, which could be accessed from below. Upon closer inspection, it was seen that it was connected to the ground by a flexible pigtail of wires.
Inside the table was a grid of hundreds of carefully labeled pins. Each of the elements of the circuit had its own pin - from C1 to C99, from L1 to L99, and so on. Engineers buried themselves in the main console keyboards and connected to the desired logic signals. They were redirected to circuits located inside the table, with the result that the contacts were brought out to a panel with pins.
Also inside the table was a jumble of wires. Each wire had a pin connector on one side and a small light bulb on the other. Each of the bulbs could be carefully inserted into any of the holes in the cover, with the result that one end of its filament was grounded. The wire could then be connected to any pin on the panel, which closed the loop at the other end of the string.

Drawing table appearance
A new preparation procedure was now required to obtain data from the simulation. It was necessary not only to connect to the corresponding elements of the circuit, but also to connect all the indicator lamps. The paper with the diagram image was fixed on the table with adhesive tape. Dozens of light bulbs with wires were installed in the right places. Each light bulb was connected to a hole under the corresponding element of the circuit, depicted on paper. Then the wire was connected to the desired pin on the panel. For example, a wire from a light bulb connected to the hole located under the image of capacitor C16 was connected to pin C16 on the panel, etc.
After all this rat nest of wires was connected, the table top was closed and used as a regular drawing table. The network analyzer was launched, and one operator on the console sequentially walked through each of the elements of interest, reading the readings from the devices. The second operator, sitting at the table next to the console, wrote the readings directly on the diagram, using the highlighted circles under each of the elements. Today this whole system reminds me of the crude predecessor of modern GUI SPICE simulators, where you can hover over or click on the desired item and get "measured" values.
Old schemes
I found a diagram of a meter selection scheme in a patent filed in 1940. It seemed to me very interesting - at least because the style and symbols for designating elements are different from today. Today you will not find such a large number of relays in the diagrams. The meaning of the device is quite easy to understand by studying the circuit a little. It is, in fact, a bus for working with decimal indicators for 24 wires, with support for the output of units and tens. In place for the indication of hundreds, only four wires are visible instead of ten. They are used to select the category of a circuit element - power supply, capacitor, etc. The address bus is controlled from the keyboard, and the RESET button releases the "drivers".

My buddies and I once rummaged in drawers, and found an old article about Herbert Peters - a brilliant engineer from Westinghouse, who was transferred to the Georgia Institute of Technology with a network analyzer, and as a result, he lived in Atlanta all his life. Peters appears to have been a shining representative of old-school hardcore engineers. We imagined him in his bow tie bending over the computer in thought, periodically brushing away the cigarette ash falling on the console.
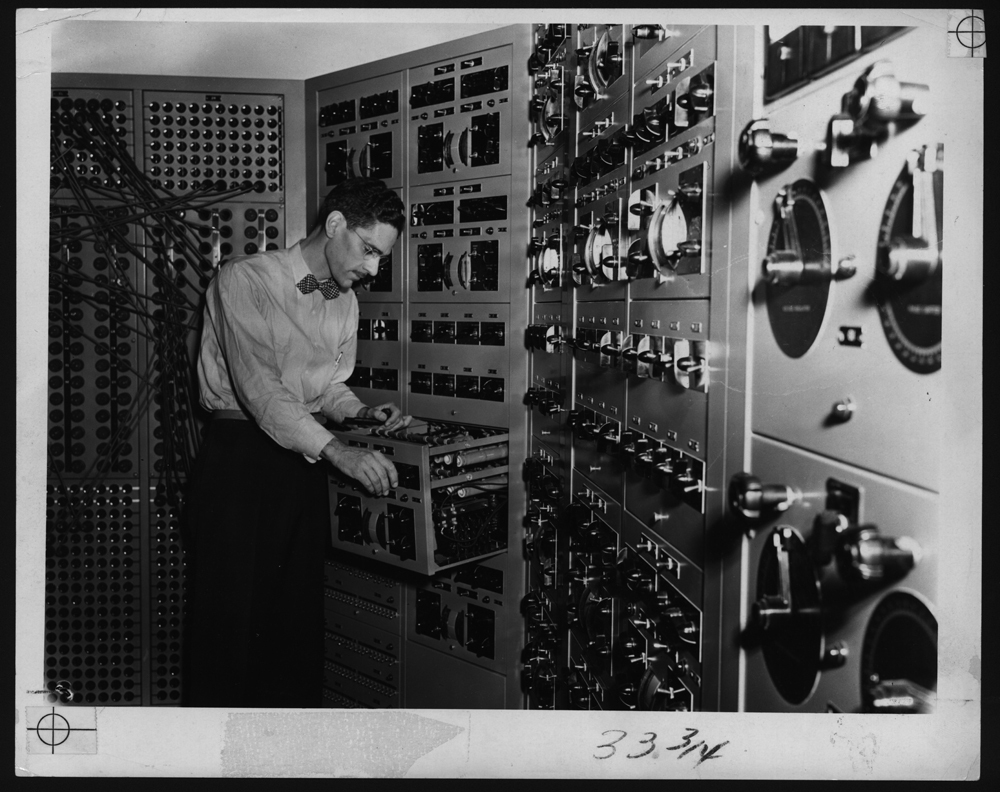
Herbert Peters at work
Personally, I am not familiar with him, but I heard that after I graduated from the institute, he returned there as a consultant. He stumbled upon a transistor amplifier that I had been making for many months trying to replace an old broken vacuum tube amplifier. Without hesitation, he threw my device in the trash and repaired the old amplifier in less than an hour. I remember this story every time I have to develop some kind of transistor amplifier.
I heard that shortly after I graduated from college in 1985, half of the network analyzer was thrown out of the basement in order to occupy the area with something else. Its main part survived - just some elements of the diagram were cut in half. And a few years ago we got rid of these remnants. Today, only gradually fading photographs are left of him, a 10 kW generator in the basement, and wonderful memories of the users of this machine.