In a way, this article is a continuation of our article on sizing on Habré . But real-life examples appeared here, so if there is a need for some kind of continuity, start with that article, and then come back here. All the details are under the cut.
This article is based on Benchmarking and sizing your Elasticsearch cluster for logs and metrics on the Elastic blog. We modified it a little and dropped the examples with cloud-based Elastic.
Elasticsearch cluster hardware resources
The performance of an Elasticsearch cluster depends mainly on how you use it and what runs under it (in the sense of the hardware). The hardware is characterized by the following:
Vault
The vendor recommends using SSDs wherever possible. But, obviously, this is not possible everywhere, so hot-warm-cold architecture and Index Lifecycle Management (ILM) are at your service.
Elasticsearch does not require redundant storage (you can do without RAID 1/5/10), log or metric storage scenarios usually have at least one replica for minimal fault tolerance.
Memory
The memory on the server is divided into:
JVM Heap. Stores metadata about cluster, indexes, segments, segments, and document field data. Ideally, you should allocate 50% of the available RAM for this.
OS cache. Elasticsearch will use the remaining available memory to cache data, which will dramatically improve performance by preventing disk reads during full-text searches, document value aggregations, and sorting. And don't forget to disable swap (swap file) to avoid flushing the contents of RAM to disk and then reading from it (this is slow!).
CPU
Elasticsearch nodes have so-called. thread pools and thread queues that use the available computing resources. The number and performance of CPU cores determine the average speed and peak throughput of data operations in Elasticsearch. Most often these are 8-16 cores.
Network
Network performance - both bandwidth and latency can significantly affect communication between Elasticsearch nodes and communication between Elasticsearch clusters. Please note that by default, a node availability check is performed every second, and if a node does not ping for 30 seconds, it is marked as unavailable and is shut down from the cluster.
Sizing an Elasticsearch cluster by storage volume
Storing logs and metrics usually requires a significant amount of disk space, so it is worth using the amount of this data to initially determine the size of our Elasticsearch cluster. Below are a few questions to understand the data structure that needs to be managed in a cluster:
- How much raw data (GB) will we index per day?
- How many days will we keep the data?
- How many days are in the hot zone?
- How many days are in the warm zone?
- How many replicas will be used?
It is advisable to put 5% or 10% on top and so that 15% of the total disk space always remains in stock. Now let's try to count this case.
Total data size (GB) = Number of raw data per day (GB) * Number of days of storage * (Number of replicas + 1).
Total storage (GB) = Total data (GB) * (1 + 0.15 storage space + 0.1 additional storage).
Total number of data nodes = OKRVVERH (Total amount of data (GB) / Amount of memory per data node / Ratio of memory: data). In the case of a large installation, it is better to keep one more additional node in stock.
Elastic recommends the following ratios of memory: data for different types of nodes: hot → 1:30 (30 GB of disk space per gigabyte of memory), warm → 1: 160, cold → 1: 500). OKRVVERKH - surround to the nearest larger integer.
An example of calculating a small cluster
Let's assume that ~ 1 GB of data arrives every day, which needs to be stored for 9 months.
Total data (GB) = 1 GB x (9 months x 30 days) x 2 = 540 GB
Total storage (GB) = 540 GB x (1 + 0.15 + 0.1) = 675 GB
Total number of data nodes = 675 GB / 8 GB RAM / 30 = 3 nodes.
Example of calculating a large cluster
You get 100 GB per day, and you will store this data for 30 days in the hot zone and 12 months in the warm zone. You have 64 GB of memory per node, of which 30 GB is allocated for the JVM Heap and the remainder for the OS cache. The recommended ratio of memory: data for the hot zone is 1:30, for the warm zone - 1: 160.
So, if you get 100 GB per day and need to store this data for 30 days, we get:
Total amount of data (GB) in the hot zone = (100 GB x 30 days * 2) = 6000 GB
Total Hot Zone Storage (GB) = 6000 GB x (1 + 0.15 + 0.1) = 7500 GB
Total Hot Zone Data Nodes = OKRVUPH (7500 / 64/30) + 1 = 5 nodes
Total data (GB) in the warm zone= (100 GB x 365 days * 2) = 73,000 GB
Total storage (GB) in the warm zone = 73,000 GB x (1 + 0.15 + 0.1) = 91,250 GB
Total number of data nodes in the warm zone = OKRVVERKH (91 250/64/160) + 1 = 10 knots
Thus, we got 5 knots for the hot zone and 10 knots for the warm fruit. For the cold zone, similar calculations, but the memory ratio: the data will already be 1: 500.
Performance tests
Once the size of the cluster has been determined, it needs to be confirmed that the math works under real-world conditions.
This test uses the same tool that Elasticsearch engineers use, Rally . It's easy to deploy and run and is fully customizable, so multiple scripts (tracks) can be tested.
To make it easier to analyze the results, the test is divided into two sections: indexing and search queries. The tests will use data from Metricbeat tracks and web server logs .
Indexing
Testing answers the following questions:
- What is the maximum throughput for indexing clusters?
- How much data can be indexed per day?
- Is the cluster larger or smaller than the appropriate size?
This test uses a 3-node cluster with the following configuration for each node:
- 8 vCPU;
- HDD;
- 32GB / 16 heap.
Indexing Test # 1
The dataset used for the test is Metricbeat data with the following characteristics:
- 1,079,600 documents;
- Data volume: 1.2 GB;
- Average document size: 1.17 KB.
Next, there will be several tests to determine the optimal packet size and the optimal number of threads.
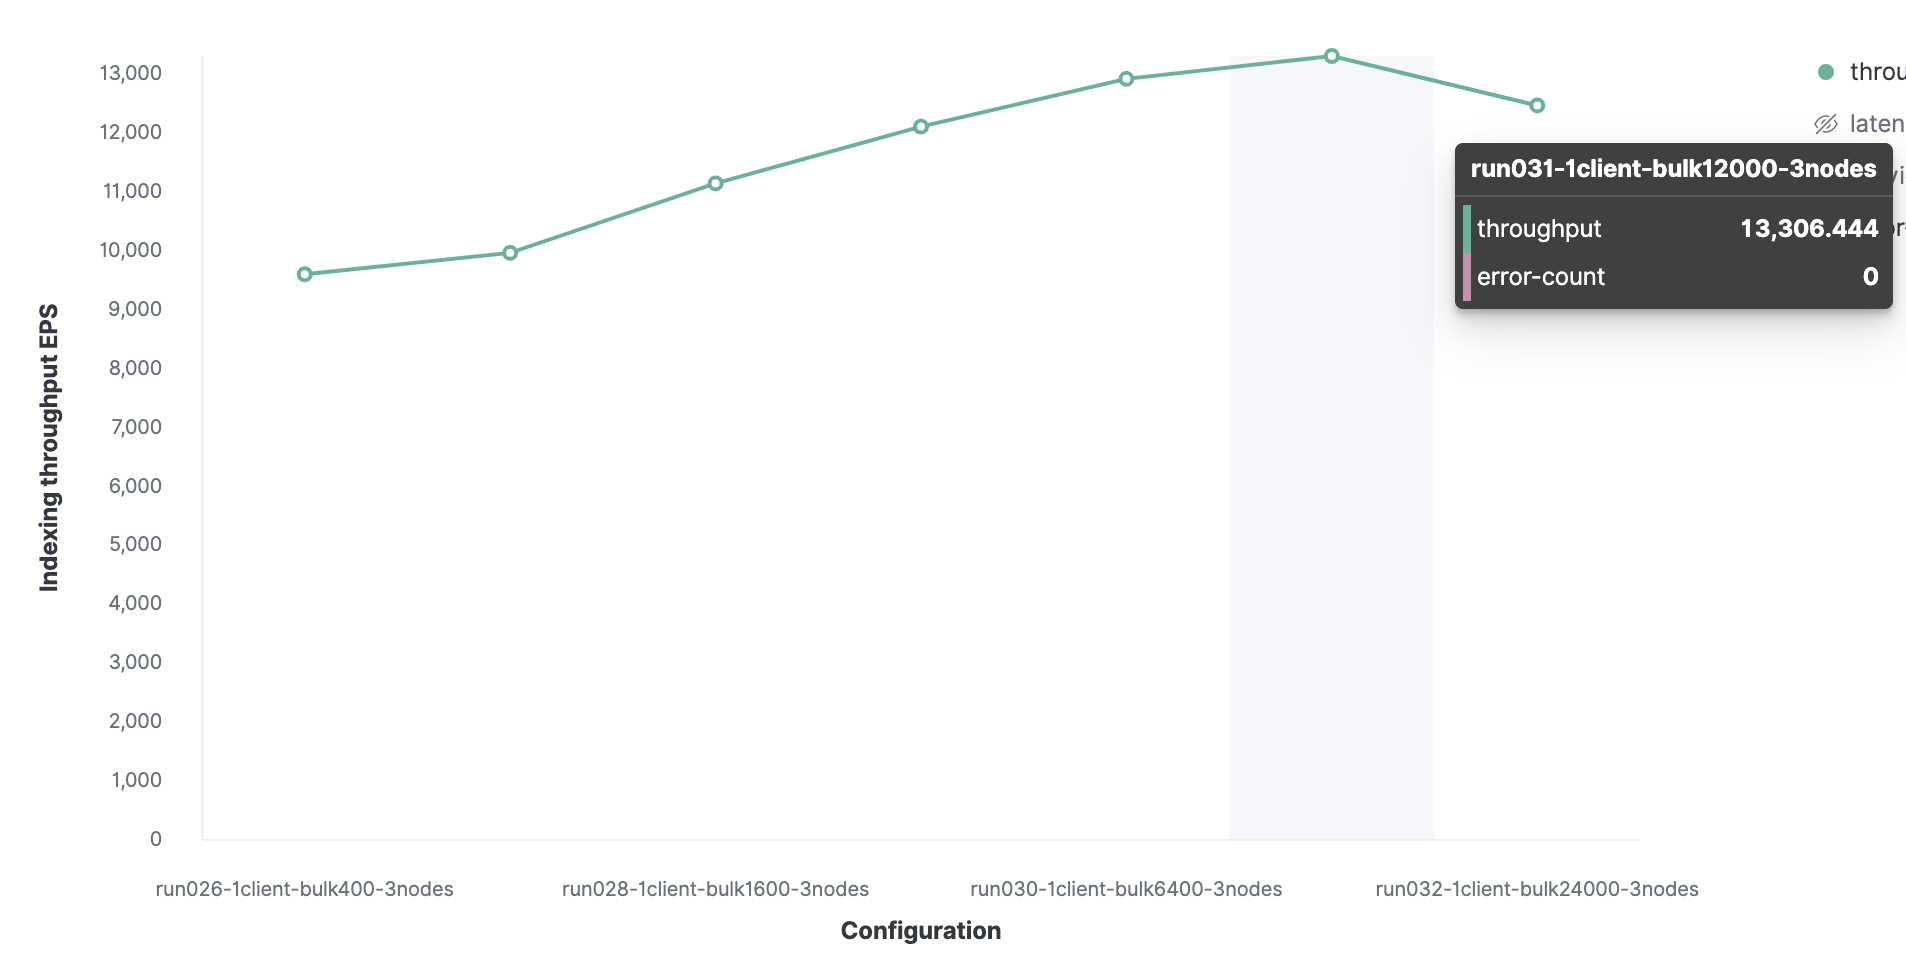
It all starts with 1 Rally client to find the optimal package size. Initially, 100 documents are loaded, then their number doubles on subsequent launches. The result will be an optimal batch size of 12,000 documents (that's about 13.7 MB). As the packet size grows further, performance begins to drop.
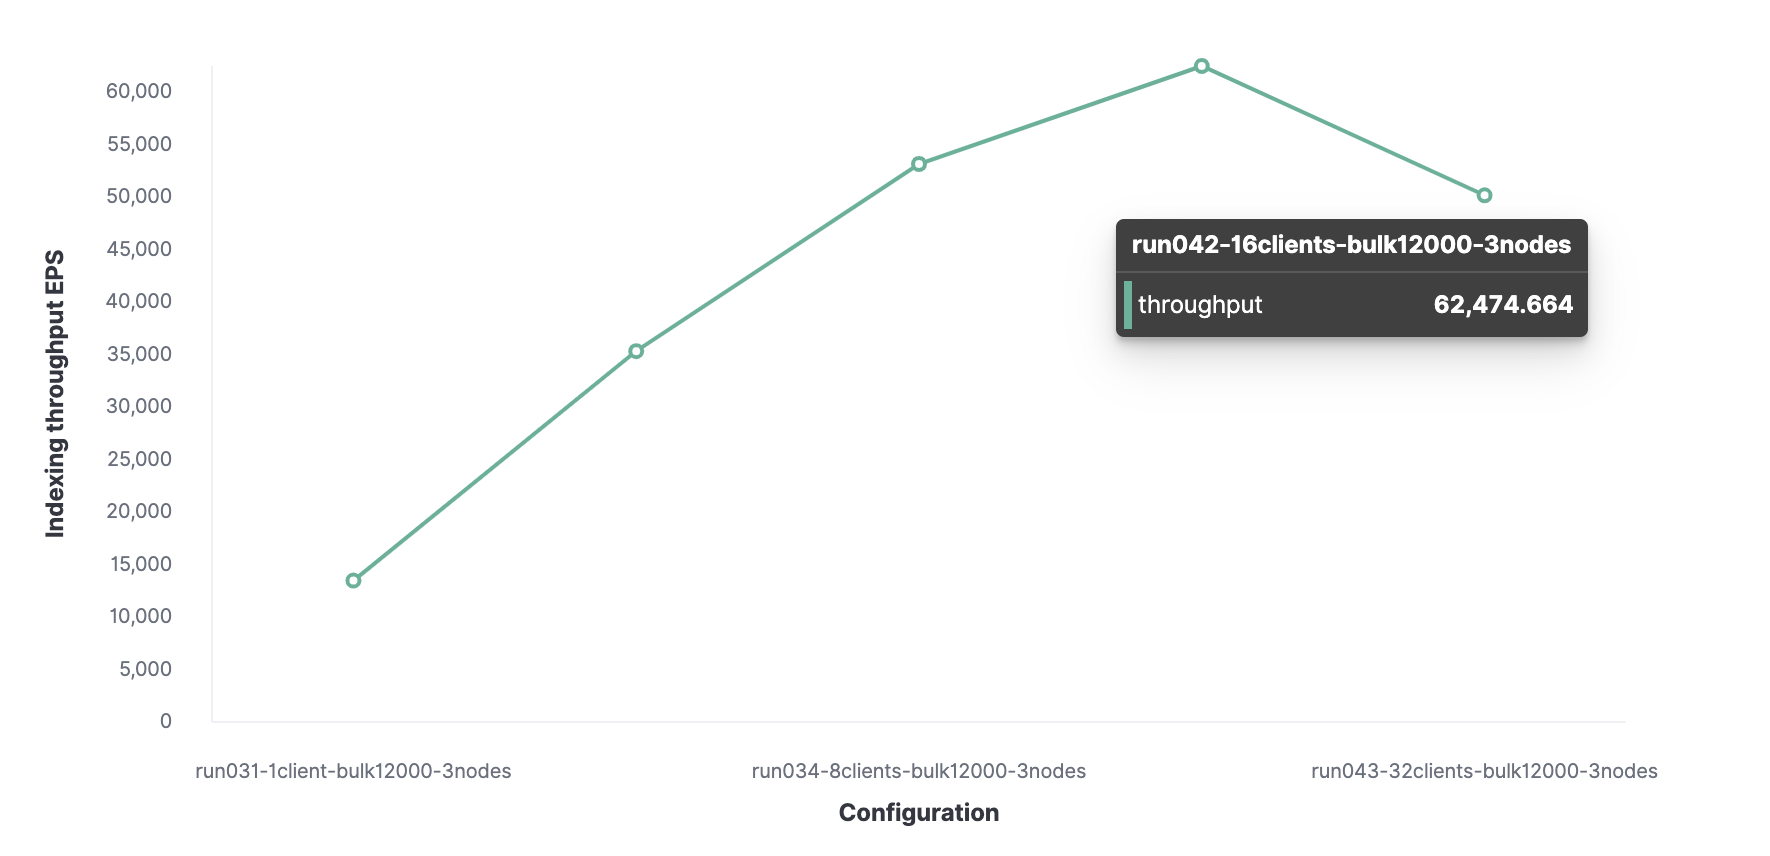
Then, using a similar method, 16 is the optimal number of clients to achieve 62,000 indexed events per second.

In total, the cluster can process a maximum of 62,000 events per second without sacrificing performance. To increase this number, you will need to add a new node.
Below is the same test with a packet of 12,000 events, but for comparison, the bandwidth data is given for 1 node, 2 and 3 nodes.
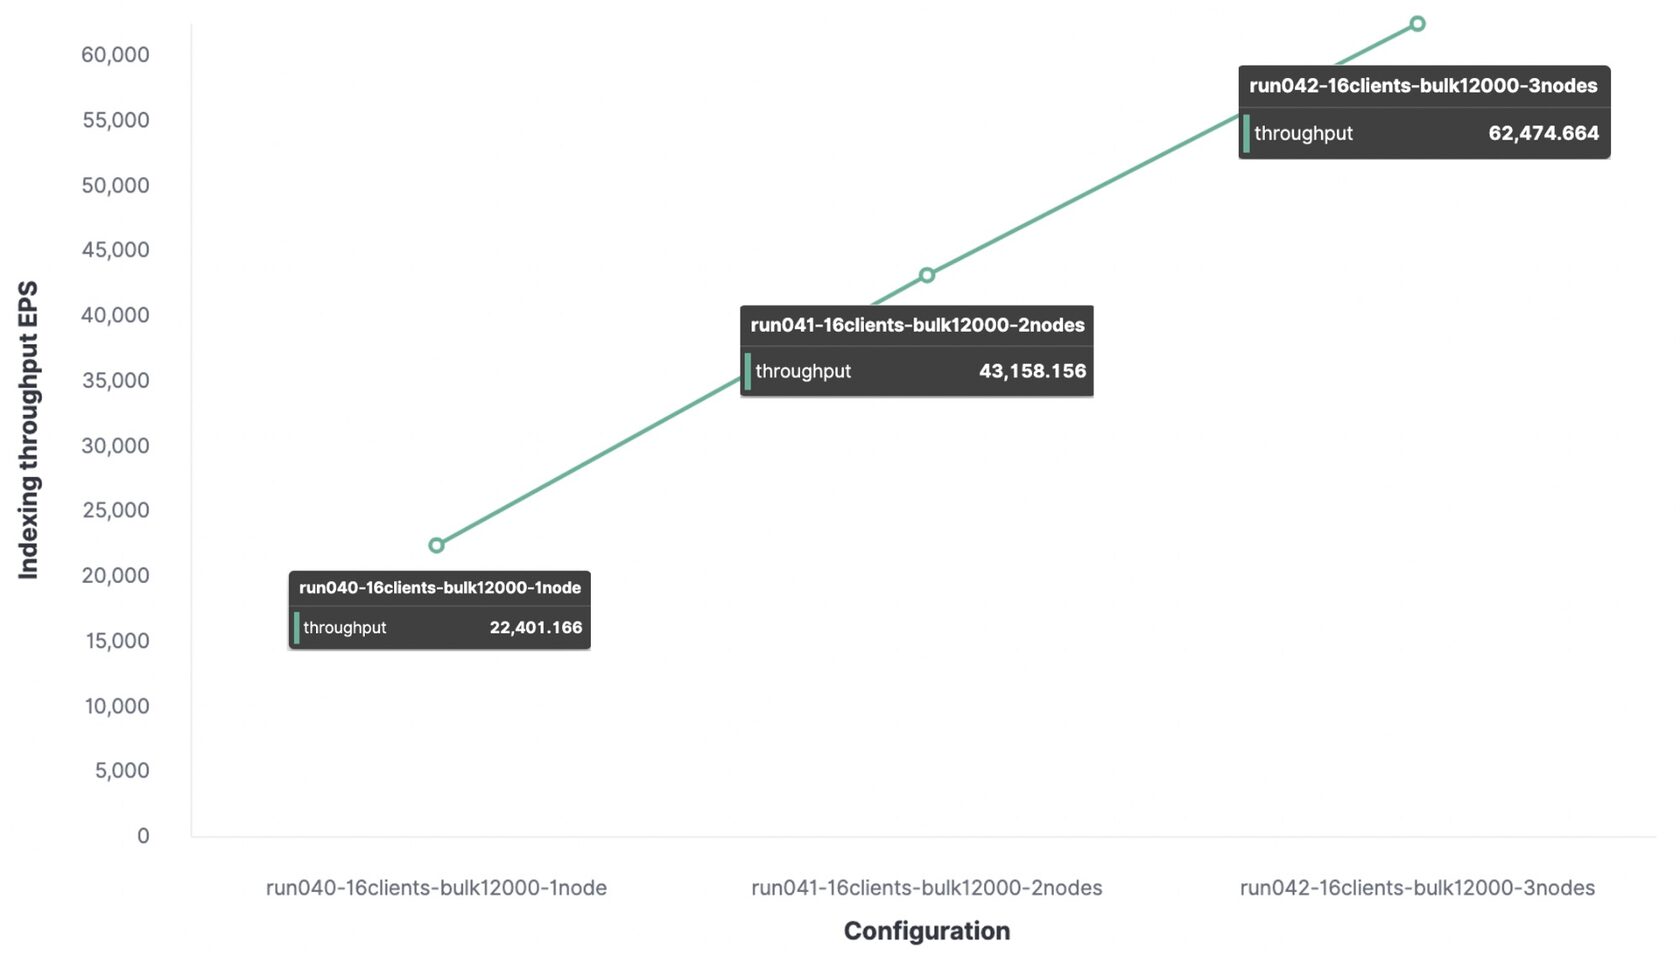
For a test environment, the maximum indexing throughput will be:
- With 1 node and 1 shard, 22,000 events per second were indexed;
- With 2 nodes and 2 shards, 43,000 events per second were indexed;
- With 3 nodes and 3 shards, 62,000 events per second were indexed.
Any additional indexing request will be queued, and when it is full, the node will respond by rejecting the indexing request.
Please note that dataset affects cluster performance, so it is important to run Rally tracks with your own data.
Indexing test # 2
For the next step, the HTTP server log data tracks with the following configuration will be used:
- 247 249 096 documents;
- Data volume: 31.1 GB;
- Average document size: 0.8 KB.
The optimal package size is 16,000 documents.
The optimal number of clients is 32.
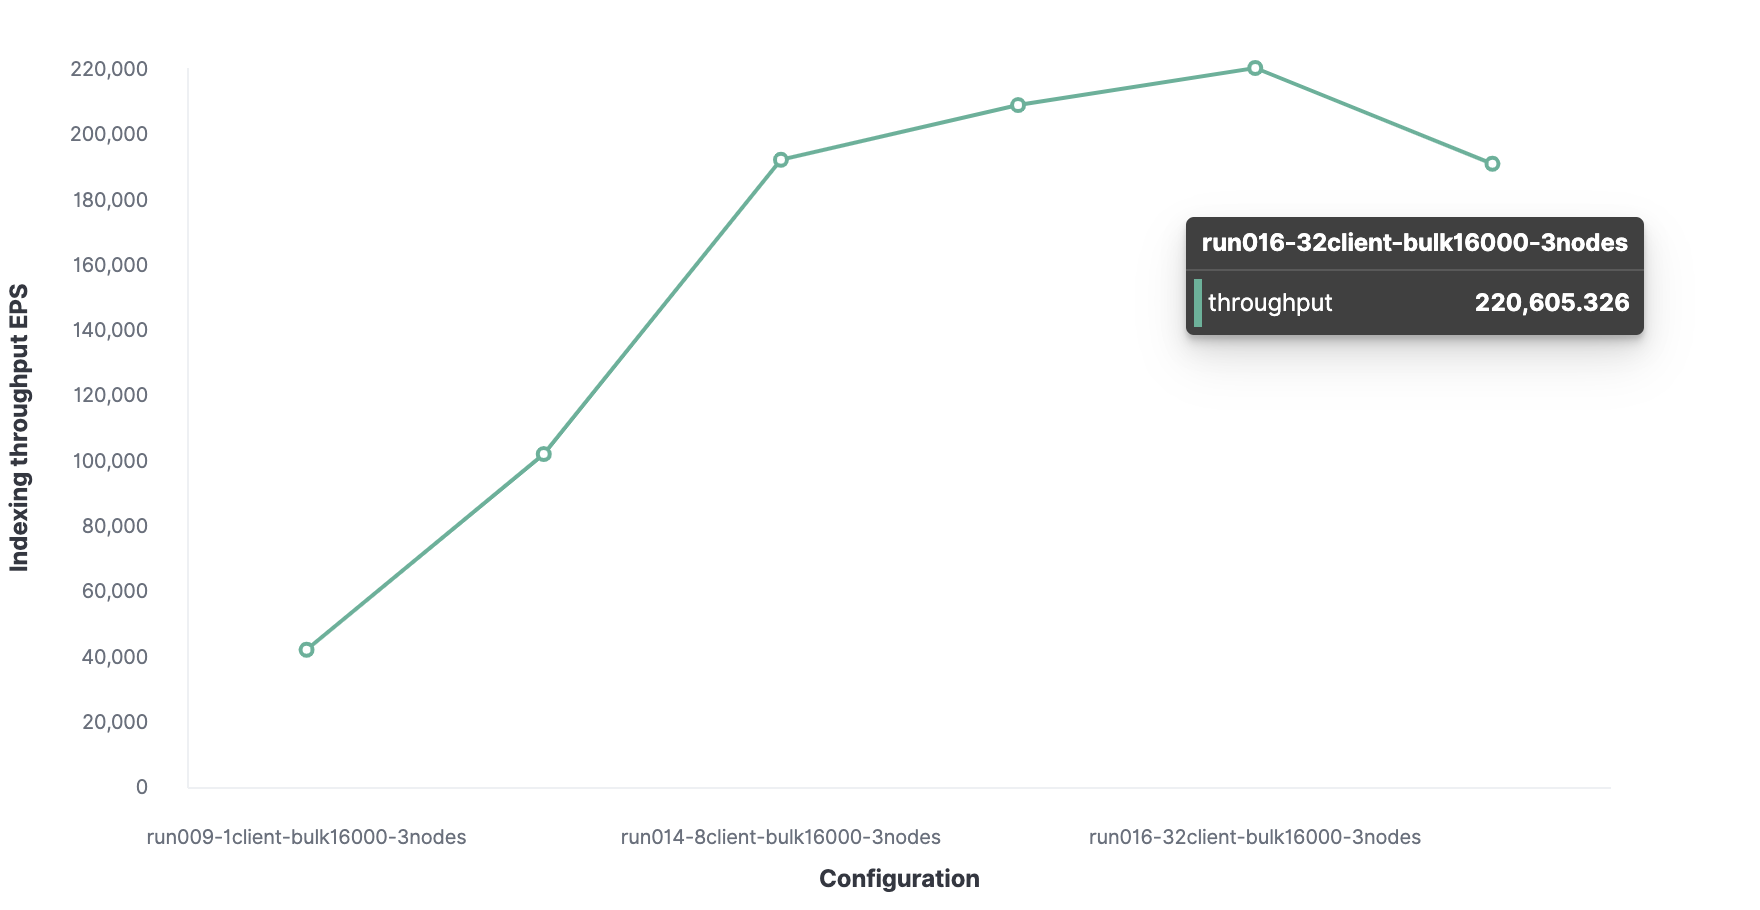
Accordingly, the maximum indexing throughput in Elasticsearch is 220,000 events per second.
Search
Search throughput will be estimated based on 20 clients and 1000 operations per second. Three tests will be performed for the search.
Search Test # 1
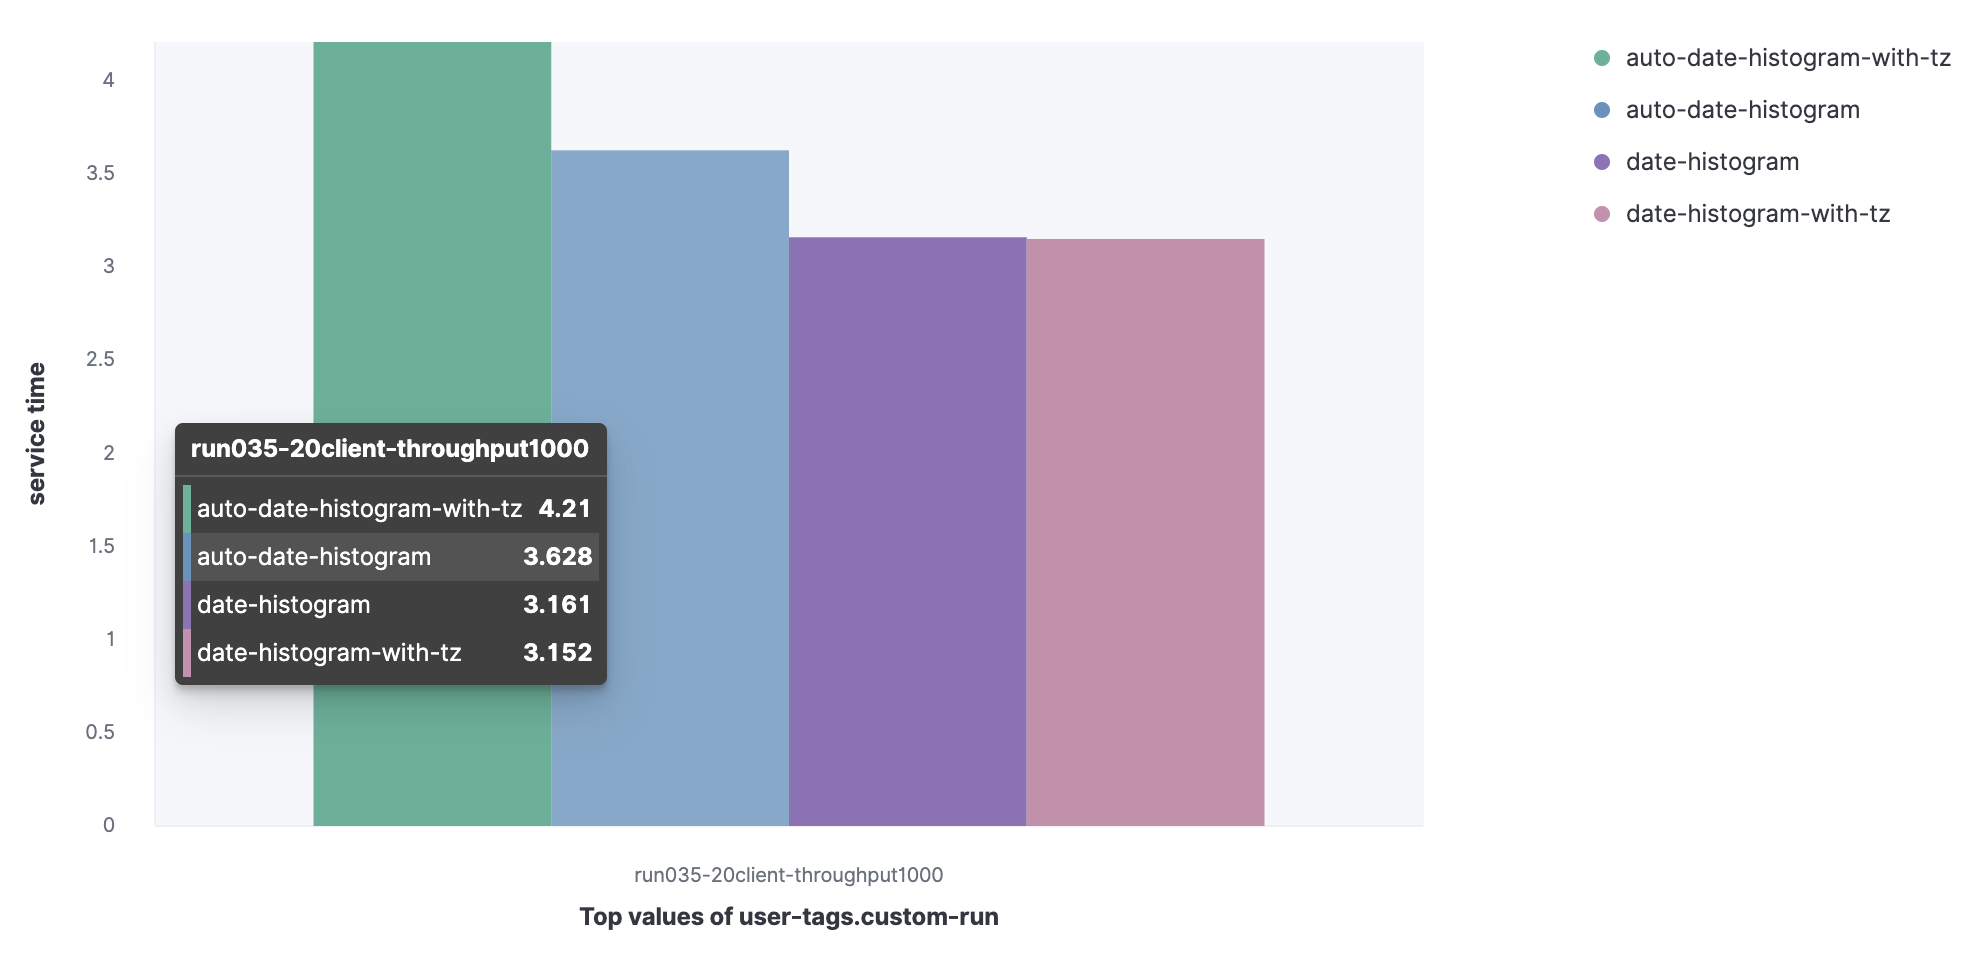
Compares the service time (or rather the 90th percentile) for a set of queries.
Dataset from Metricbeat:
- Aggregated date histogram with automatic interval (auto-date-historgram);
- Aggregated date histogram with timezone with automatic interval (auto-date-histogram-with-tz);
- Aggregated date histogram (date-histogram);
- Aggregated date histogram with time zone (date-histogram-with-tz).
You can see that the auto-date-histogram-with-tz request has the longest service time in the cluster.
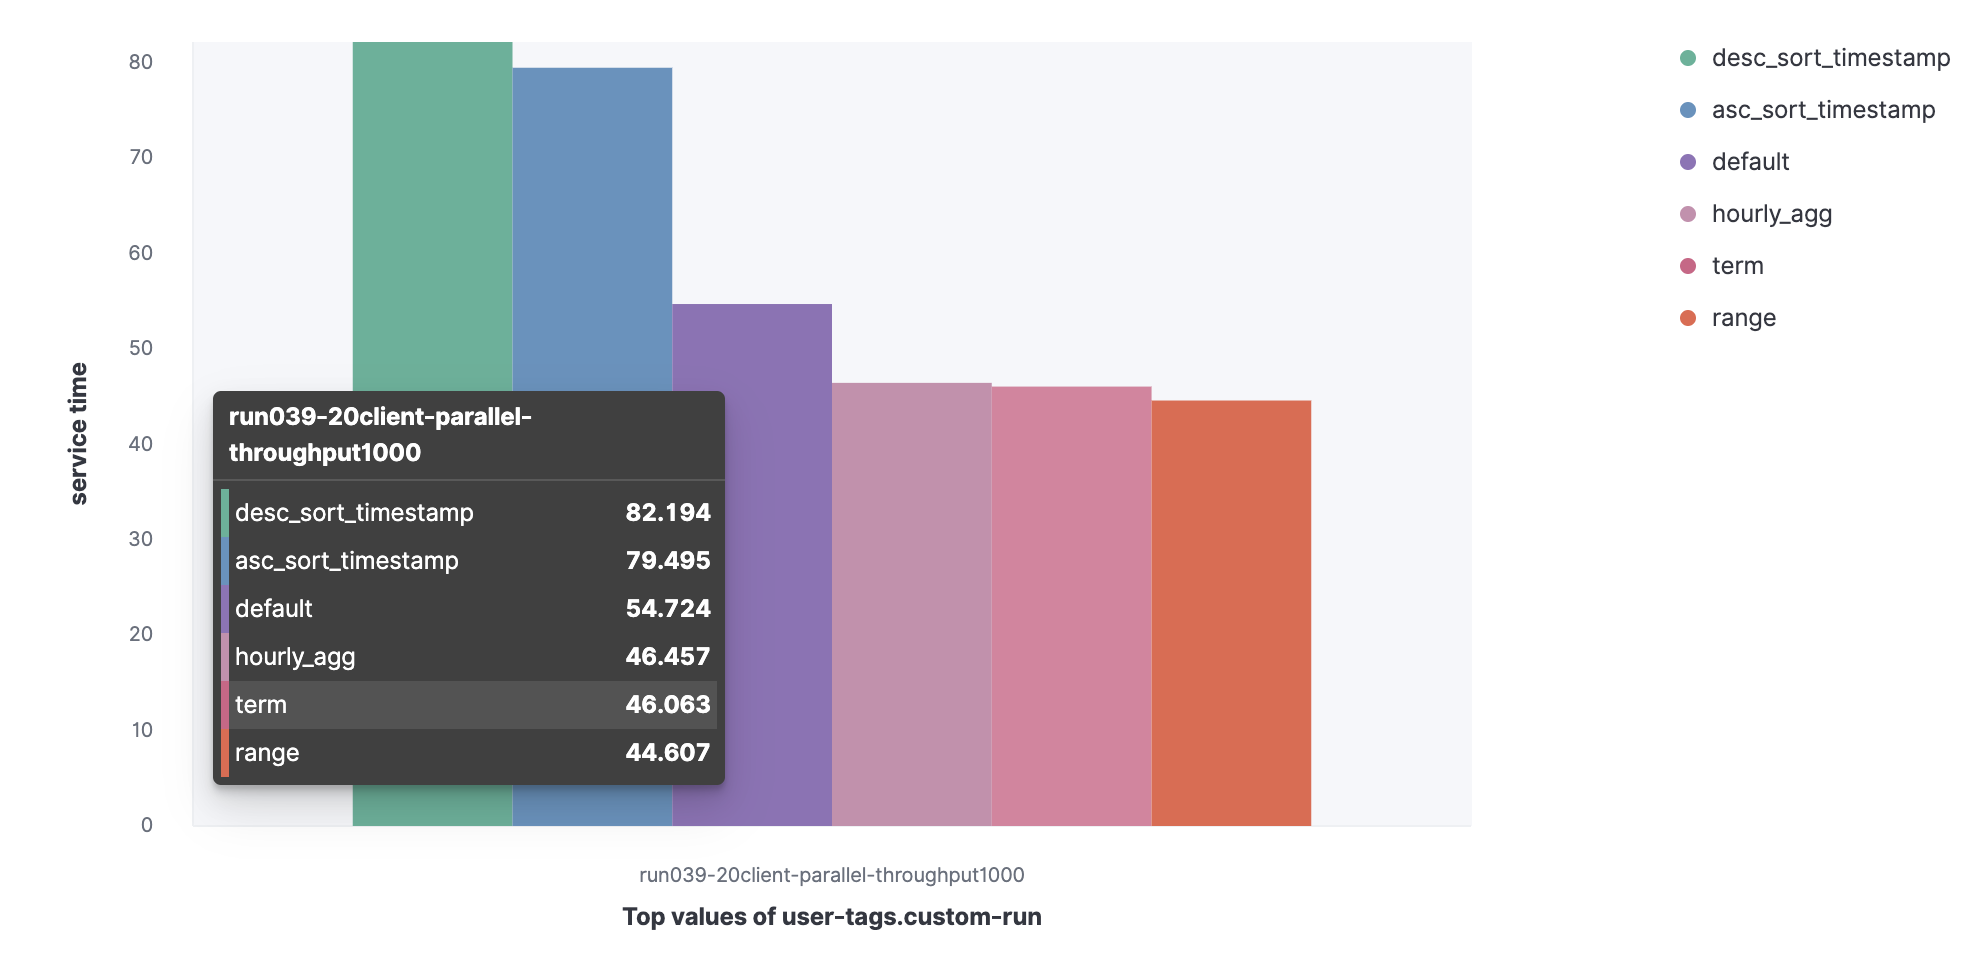
Data set from the HTTP server log:
- Default;
- Term;
- Range;
- Hourly_agg;
- Desc_sort_timestamp;
- Asc_sort_timestamp.
You can see that the requests desc_sort_timestamp and desc_sort_timestamp have a longer service life.

Search Test # 2
Now let's look at parallel queries. Let's see how the 90th percentile service time increases if queries are executed in parallel.
Search test # 3
Consider the indexing speed and service time of search queries with parallel indexing.
Let's run a parallel indexing and search task to see the indexing speed and query service time.

Let's see how the service time of queries at the 90th percentile increased when performing searches in parallel with indexing operations.

In total, having 32 clients for indexing and 20 users for searching:
- The indexing throughput is 173,000 events per second, which is less than 220,000 obtained in previous experiments;
- The search bandwidth is 1000 events per second.
Rally is a powerful benchmarking tool, but you should use it only with data that will also be poured into production in the future.
A couple of ads:
We have developed a training course on the basics of working with Elastic Stack , which is adapted to the specific needs of the customer. Detailed training program on request.
We invite you to register for Elastic Day in Russia and the CIS 2021, which will be held online on March 3 from 10 am to 1 pm.
Read our other articles:
- Sizing Elasticsearch
- How Elastic Stack (Elasticsearch) licenses are licensed and different
- Understanding Machine Learning in Elastic Stack (aka Elasticsearch, aka ELK)
- Elastic under lock and key: enable security options for the Elasticsearch cluster for access from inside and outside
If you are interested in administration and support services for your Elasticsearch installation, you can leave a request in the feedback form on a special page.
Subscribe to our Facebook group and Youtube channel .