There are several matplotlib plots. It is necessary to save them into a single pdf file. What to do?
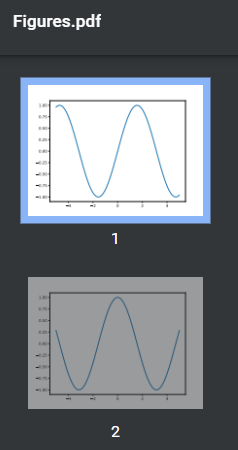
Method I. Saving one graph on one page using PdfPages
This method can be implemented using two options.
Using matplotlib magic:
from matplotlib.backends.backend_pdf import PdfPages
import matplotlib.pyplot as plt
import numpy as np

#  .
pdf = PdfPages("Figures.pdf")

#     .
FUNCTIONS = [np.sin, np.cos, np.sqrt, lambda x: x**2]
X = np.linspace(-5, 5, 100)
for function in FUNCTIONS:
    plt.plot(X, function(X))
    pdf.savefig()
    plt.close()


#
pdf.close()
Using direct access to shapes:
from matplotlib.backends.backend_pdf import PdfPages
import matplotlib.pyplot as plt
import numpy as np

#   .
FUNCTIONS = [np.sin, np.cos, np.sqrt, lambda x: x**2]
X = np.linspace(-5, 5, 100)
figures = []
for function in FUNCTIONS:
    figure = plt.figure()
    axes = figure.subplots()
    axes.plot(X, function(X))

    figures.append(figure)
#  .
# figures = []

#      .
pdf = PdfPages("Figures.pdf")
for figure in figures:
    pdf.savefig(figure)


#
pdf.close()
We get:

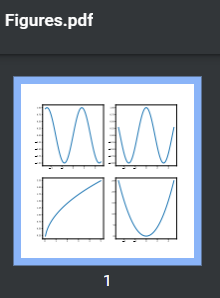
Method II. Saving multiple charts in one page using PdfPages
from matplotlib.backends.backend_pdf import PdfPages
import matplotlib.pyplot as plt
import numpy as np

#
FUNCTIONS = [np.sin, np.cos, np.sqrt, lambda x: x**2, np.tan]
X = np.linspace(-5, 5, 100)


#
ROWS = 2
COLUMNS = 2

#  .
pdf = PdfPages("Figures.pdf")

#
index = 0
for page in range(len(FUNCTIONS)//(ROWS*COLUMNS)+1):
    #     .
    figure = plt.figure(figsize=(12, 12))
    axes = figure.subplots(ROWS, COLUMNS)

    #
    for row in range(ROWS):
        for column in range(COLUMNS):
            if index < len(FUNCTIONS):
                axes[row, column].plot(X, FUNCTIONS[index](X))

                index += 1

    #
    pdf.savefig(figure)


#
pdf.close()
We get:

This will not work if we have an array of already concrete shapes. For this simple reason, the figure has already been drawn what is needed, and as it should be. And besides, each shape has its own dpi and size, which affect rendering. Of course, all this can be taken into account by complicating the algorithm, but it is much easier to go to method 3.
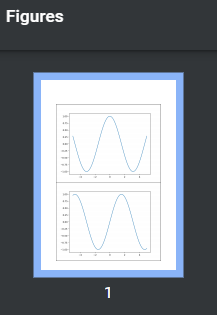
Method III. Using reportlab
The most versatile way.
import matplotlib.pyplot as plt
import numpy as np
from io import BytesIO
from reportlab.pdfgen import canvas
from reportlab.lib.units import cm
from reportlab.lib.utils import ImageReader

#   .
FUNCTIONS = [np.sin, np.cos, np.sqrt, lambda x: x**2]
X = np.linspace(-5, 5, 100)
figures = []
for function in FUNCTIONS:
    figure = plt.figure()
    axes = figure.subplots()
    axes.plot(X, function(X))

    figures.append(figure)
#  .
# figures = []


#
indent = 1.5

#  canvas
c = canvas.Canvas("Figures.pdf")
c.setTitle("Figures")
height = indent

#   .
for figure in figures:
    # dpi   ( )
    dpi = figure.get_dpi()
    figureSize = figure.get_size_inches()
    #    .
    #   ,       .
    figure.patches.extend(
        [plt.Rectangle((0, 1/(dpi*figureSize[1])), width=1-2/(dpi*figureSize[0]),
                       height=1-2/(dpi*figureSize[1]),
                       transform=figure.transFigure, figure=figure, clip_on=False,
                       edgecolor="black",
                       facecolor="none", linewidth=1)])


    #  .
    image = BytesIO()
    figure.savefig(image, format="png")
    image.seek(0)
    image = ImageReader(image)


    #    .
    figureSize = figure.get_size_inches()*2.54

    # A4 210×297
    #     ,
    if height + figureSize[1] + indent > 29.7:
        height = indent
        c.showPage()

    #  image  pdf
    c.drawImage(image, (10.5-figureSize[0]/2)*cm, height*cm,
                figureSize[0]*cm, figureSize[1]*cm)
    height += figureSize[1]

# .
c.save()
We get:

Thanks for reading the article. Good luck!