
There are many articles explaining what the Python GIL (The Global Interpreter Lock) is for (I mean CPython). In short, the GIL prevents multithreaded clean Python code from using multiple processor cores.
However, at Vaex we do most computationally intensive tasks in C ++ with the GIL disabled. This is normal practice for high-performance Python libraries, where Python only acts as a high-level glue.
The GIL must be disabled explicitly, and it is the responsibility of the programmer, which he can forget about, which will lead to inefficient use of capacity. Recently, I myself have been in the role of the forgetful, and found a similar problem in Apache Arrow(this is a Vaex dependency, so when the GIL is not disabled in Arrow, we (and everyone else) experience a performance hit).
In addition, when running on 64 cores, Vaex performance is sometimes far from ideal. It may be using 4000% of the cpu instead of 6400%, which doesn't suit me. Instead of randomly inserting switches to study this effect, I want to understand what is happening, and if the problem is in the GIL, then I want to understand why and how it slows down Vaex.
Why am I writing this
I plan to write a series of articles covering some of the tools and techniques for profiling and tracing Python with native extensions, and how these tools can be combined to analyze and visualize Python with the GIL enabled and disabled.
Hopefully this will help improve tracing, profiling and other performance measurements in the language ecosystem, as well as the performance of the entire Python ecosystem.
Requirements
Linux
You need root access to the Linux machine (sudo is enough). Or ask your sysadmin to run the commands below for you. For the rest of this article, user privileges are sufficient.
Perf
Make sure you have perf installed, for example, on Ubuntu, you can do it like this:
$ sudo yum install perf
Kernel configuration
Run as user:
# Enable users to run perf (use at own risk)
$ sudo sysctl kernel.perf_event_paranoid=-1
# Enable users to see schedule trace events:
$ sudo mount -o remount,mode=755 /sys/kernel/debug
$ sudo mount -o remount,mode=755 /sys/kernel/debug/tracing
Python packages
We will be using VizTracer and per4m
$ pip install "viztracer>=0.11.2" "per4m>=0.1,<0.2"
Tracking the state of threads and processes with perf
There is no way to figure out the state of the GIL in Python (other than using polling ) because there is no API for that. We can monitor state from the kernel, and for that we need the perf tool .
With its help (also known as perf_events), we can listen for changes in the state of processes and threads (we are only interested in sleep and execution) and log them. Perf may look intimidating, but it's a powerful tool. If you want to know more about it, I recommend reading the article by Julia Evans or Brendan Gregg's website .
To tune in, let's first apply perf to a simple program :
import time
from threading import Thread
def sleep_a_bit():
time.sleep(1)
def main():
t = Thread(target=sleep_a_bit)
t.start()
t.join()
main()
We listen for just a few events to reduce noise (note the use of wildcards):
$ perf record -e sched:sched_switch -e sched:sched_process_fork \
-e 'sched:sched_wak*' -- python -m per4m.example0
[ perf record: Woken up 2 times to write data ]
[ perf record: Captured and wrote 0,032 MB perf.data (33 samples) ]
And we will use the perf script command to output a readable result suitable for parsing.
Hidden text
$ perf script
:3040108 3040108 [032] 5563910.979408: sched:sched_waking: comm=perf pid=3040114 prio=120 target_cpu=031
:3040108 3040108 [032] 5563910.979431: sched:sched_wakeup: comm=perf pid=3040114 prio=120 target_cpu=031
python 3040114 [031] 5563910.995616: sched:sched_waking: comm=kworker/31:1 pid=2502104 prio=120 target_cpu=031
python 3040114 [031] 5563910.995618: sched:sched_wakeup: comm=kworker/31:1 pid=2502104 prio=120 target_cpu=031
python 3040114 [031] 5563910.995621: sched:sched_waking: comm=ksoftirqd/31 pid=198 prio=120 target_cpu=031
python 3040114 [031] 5563910.995622: sched:sched_wakeup: comm=ksoftirqd/31 pid=198 prio=120 target_cpu=031
python 3040114 [031] 5563910.995624: sched:sched_switch: prev_comm=python prev_pid=3040114 prev_prio=120 prev_state=R+ ==> next_comm=kworker/31:1 next_pid=2502104 next_prio=120
python 3040114 [031] 5563911.003612: sched:sched_waking: comm=kworker/32:1 pid=2467833 prio=120 target_cpu=032
python 3040114 [031] 5563911.003614: sched:sched_wakeup: comm=kworker/32:1 pid=2467833 prio=120 target_cpu=032
python 3040114 [031] 5563911.083609: sched:sched_waking: comm=ksoftirqd/31 pid=198 prio=120 target_cpu=031
python 3040114 [031] 5563911.083612: sched:sched_wakeup: comm=ksoftirqd/31 pid=198 prio=120 target_cpu=031
python 3040114 [031] 5563911.083613: sched:sched_switch: prev_comm=python prev_pid=3040114 prev_prio=120 prev_state=R ==> next_comm=ksoftirqd/31 next_pid=198 next_prio=120
python 3040114 [031] 5563911.108984: sched:sched_waking: comm=node pid=2446812 prio=120 target_cpu=045
python 3040114 [031] 5563911.109059: sched:sched_waking: comm=node pid=2446812 prio=120 target_cpu=045
python 3040114 [031] 5563911.112250: sched:sched_process_fork: comm=python pid=3040114 child_comm=python child_pid=3040116
python 3040114 [031] 5563911.112260: sched:sched_wakeup_new: comm=python pid=3040116 prio=120 target_cpu=037
python 3040114 [031] 5563911.112262: sched:sched_wakeup_new: comm=python pid=3040116 prio=120 target_cpu=037
python 3040114 [031] 5563911.112273: sched:sched_switch: prev_comm=python prev_pid=3040114 prev_prio=120 prev_state=S ==> next_comm=swapper/31 next_pid=0 next_prio=120
python 3040116 [037] 5563911.112418: sched:sched_waking: comm=python pid=3040114 prio=120 target_cpu=031
python 3040116 [037] 5563911.112450: sched:sched_waking: comm=python pid=3040114 prio=120 target_cpu=031
python 3040116 [037] 5563911.112473: sched:sched_wake_idle_without_ipi: cpu=31
swapper 0 [031] 5563911.112476: sched:sched_wakeup: comm=python pid=3040114 prio=120 target_cpu=031
python 3040114 [031] 5563911.112485: sched:sched_switch: prev_comm=python prev_pid=3040114 prev_prio=120 prev_state=S ==> next_comm=swapper/31 next_pid=0 next_prio=120
python 3040116 [037] 5563911.112485: sched:sched_waking: comm=python pid=3040114 prio=120 target_cpu=031
python 3040116 [037] 5563911.112489: sched:sched_waking: comm=python pid=3040114 prio=120 target_cpu=031
python 3040116 [037] 5563911.112496: sched:sched_switch: prev_comm=python prev_pid=3040116 prev_prio=120 prev_state=S ==> next_comm=swapper/37 next_pid=0 next_prio=120
swapper 0 [031] 5563911.112497: sched:sched_wakeup: comm=python pid=3040114 prio=120 target_cpu=031
python 3040114 [031] 5563911.112513: sched:sched_switch: prev_comm=python prev_pid=3040114 prev_prio=120 prev_state=S ==> next_comm=swapper/31 next_pid=0 next_prio=120
swapper 0 [037] 5563912.113490: sched:sched_waking: comm=python pid=3040116 prio=120 target_cpu=037
swapper 0 [037] 5563912.113529: sched:sched_wakeup: comm=python pid=3040116 prio=120 target_cpu=037
python 3040116 [037] 5563912.113595: sched:sched_waking: comm=python pid=3040114 prio=120 target_cpu=031
python 3040116 [037] 5563912.113620: sched:sched_waking: comm=python pid=3040114 prio=120 target_cpu=031
swapper 0 [031] 5563912.113697: sched:sched_wakeup: comm=python pid=3040114 prio=120 target_cpu=031
Take a look at the fourth column (time in seconds): the program fell asleep (one second passed). Here we see the entrance to the sleep state:
python 3040114 [031] 5563911.112513: sched:sched_switch: prev_comm=python prev_pid=3040114 prev_prio=120 prev_state=S ==> next_comm=swapper/31 next_pid=0 next_prio=120
This means that the kernel has changed the state of the Python thread to
S
(= sleeping).
A second later, the program woke up:
swapper 0 [031] 5563912.113697: sched:sched_wakeup: comm=python pid=3040114 prio=120 target_cpu=031
Of course, in order to understand what is happening, you will have to collect the tools. Yes, the result can also be easily parsed using per4m , but before we continue, I want to visualize the flow of a slightly more complex program using VizTracer .
VizTracer
It is a Python tracer capable of visualizing the work that a program is doing in a browser. Let's apply it to a more complex program :
import threading
import time
def some_computation():
total = 0
for i in range(1_000_000):
total += i
return total
def main():
thread1 = threading.Thread(target=some_computation)
thread2 = threading.Thread(target=some_computation)
thread1.start()
thread2.start()
time.sleep(0.2)
for thread in [thread1, thread2]:
thread.join()
main()
The result of the tracer operation:
$ viztracer -o example1.html --ignore_frozen -m per4m.example1 Loading finish Saving report to /home/maartenbreddels/github/maartenbreddels/per4m/example1.html ... Dumping trace data to json, total entries: 94, estimated json file size: 11.0KiB Generating HTML report Report saved.
This is what the resulting HTML looks like:
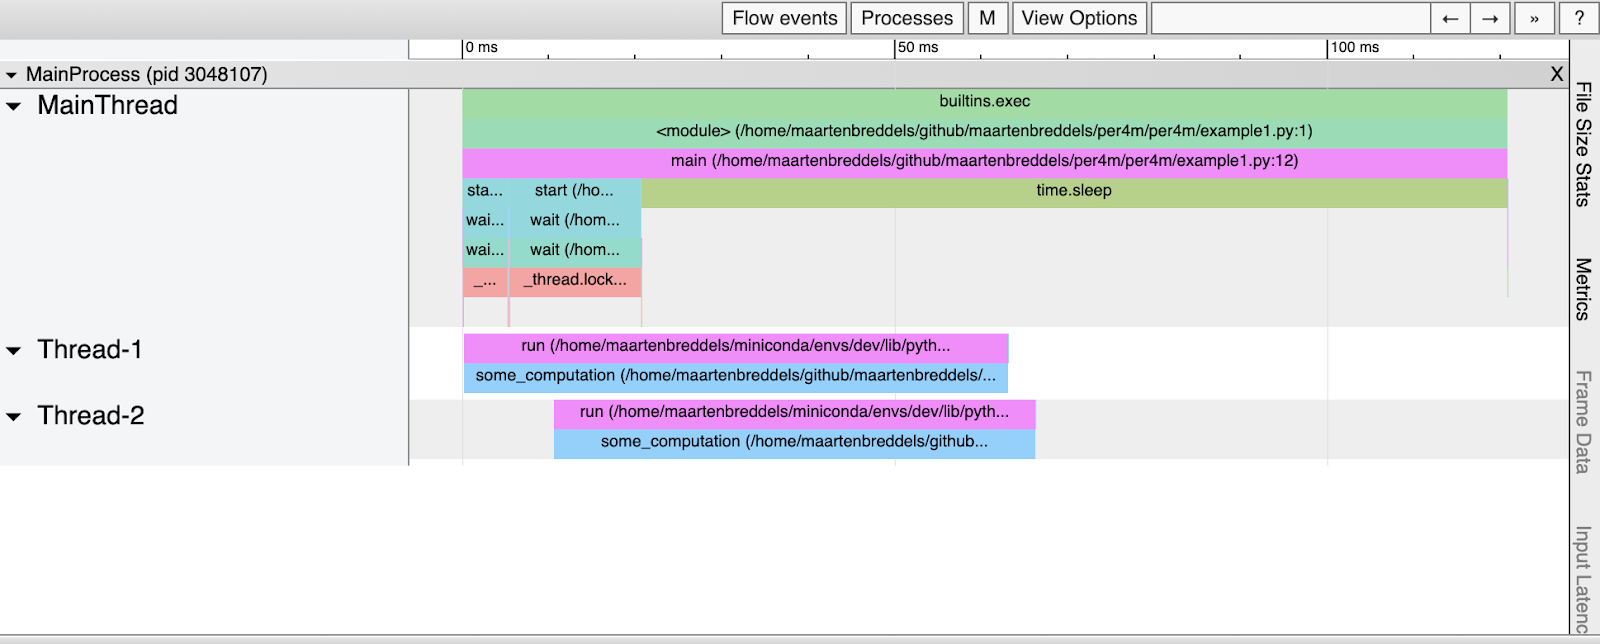
It appears to have been
some_computation
executed in parallel (twice), although we know the GIL prevents this. What's going on here?
Combining VizTracer and perf results
Let's apply perf as in example0.py. Only now let's add an argument
-k CLOCK_MONOTONIC
to use the same clock as VizTracer and ask it to generate JSON instead of HTML:
$ perf record -e sched:sched_switch -e sched:sched_process_fork -e 'sched:sched_wak*' \
-k CLOCK_MONOTONIC -- viztracer -o viztracer1.json --ignore_frozen -m per4m.example1
Then we use per4m to convert the results of the perf script to JSON that VizTracer can read:
$ perf script | per4m perf2trace sched -o perf1.json
Wrote to perf1.json
Now, using VizTracer, let's combine the two JSON files:
$ viztracer --combine perf1.json viztracer1.json -o example1_state.html Saving report to /home/maartenbreddels/github/maartenbreddels/per4m/example1.html ... Dumping trace data to json, total entries: 131, estimated json file size: 15.4KiB Generating HTML report Report saved.
Here's what we got:
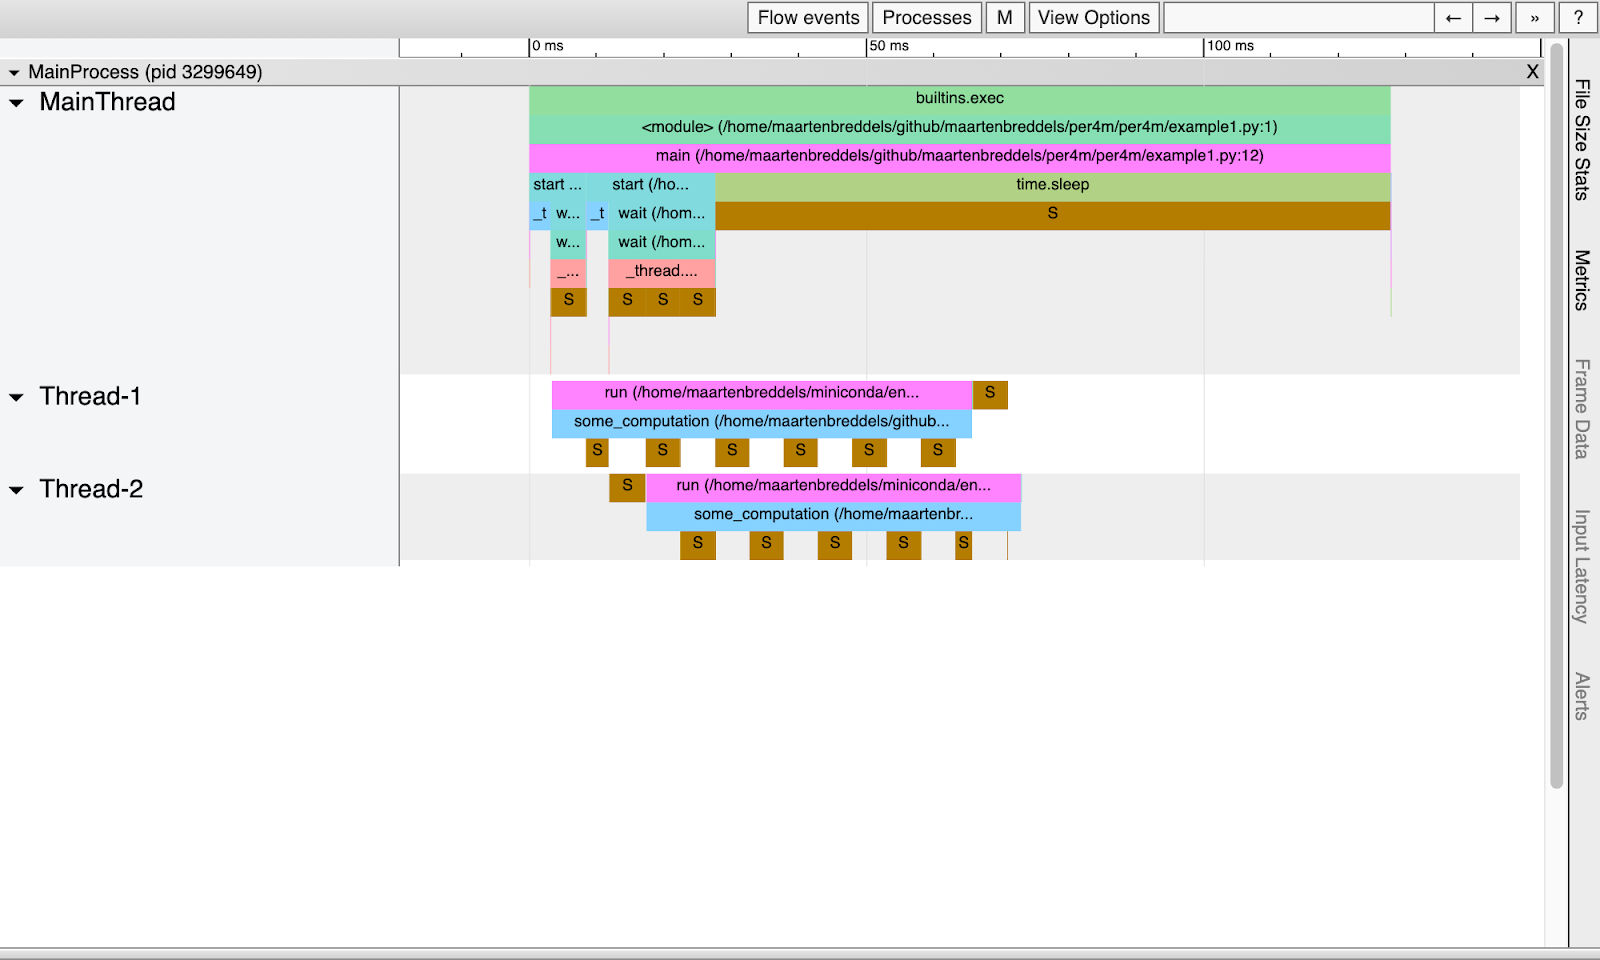
Obviously, threads regularly sleep due to the GIL and don't run in parallel.
Note : the sleep phase is about 5ms long, which corresponds to the default sys.getswitchinterval
GIL definition
Our process goes to sleep, but we do not see the difference between the sleep states that are initiated by a call
time.sleep
or the GIL. There are several ways to tell the difference, let's look at two of them.
Through the stack trace
With help
perf record -g
(or better with
perf record --call-graph dwarf
, that implies
-g
), we get the stack traces for each perf event.
$ perf record -e sched:sched_switch -e sched:sched_process_fork -e 'sched:sched_wak*'\
-k CLOCK_MONOTONIC --call-graph dwarf -- viztracer -o viztracer1-gil.json --ignore_frozen -m per4m.example1
Loading finish
Saving report to /home/maartenbreddels/github/maartenbreddels/per4m/viztracer1-gil.json ...
Dumping trace data to json, total entries: 94, estimated json file size: 11.0KiB
Report saved.
[ perf record: Woken up 3 times to write data ]
[ perf record: Captured and wrote 0,991 MB perf.data (164 samples) ]
Looking at the result of the perf script (which we added for performance reasons
--no-inline
), we get a lot of information. Look at the state change event, it turns out take_gil was called !
Hidden text
$ perf script --no-inline | less
...
viztracer 3306851 [059] 5614683.022539: sched:sched_switch: prev_comm=viztracer prev_pid=3306851 prev_prio=120 prev_state=S ==> next_comm=swapper/59 next_pid=0 next_prio=120
ffffffff96ed4785 __sched_text_start+0x375 ([kernel.kallsyms])
ffffffff96ed4785 __sched_text_start+0x375 ([kernel.kallsyms])
ffffffff96ed4b92 schedule+0x42 ([kernel.kallsyms])
ffffffff9654a51b futex_wait_queue_me+0xbb ([kernel.kallsyms])
ffffffff9654ac85 futex_wait+0x105 ([kernel.kallsyms])
ffffffff9654daff do_futex+0x10f ([kernel.kallsyms])
ffffffff9654dfef __x64_sys_futex+0x13f ([kernel.kallsyms])
ffffffff964044c7 do_syscall_64+0x57 ([kernel.kallsyms])
ffffffff9700008c entry_SYSCALL_64_after_hwframe+0x44 ([kernel.kallsyms])
7f4884b977b1<a href="https://www.maartenbreddels.com/cdn-cgi/l/email-protection"> [email protected]@GLIBC_2.3.2+0x271 (/usr/lib/x86_64-linux-gnu/libpthread-2.31.so)
55595c07fe6d take_gil+0x1ad (/home/maartenbreddels/miniconda/envs/dev/bin/python3.7)
55595bfaa0b3 PyEval_RestoreThread+0x23 (/home/maartenbreddels/miniconda/envs/dev/bin/python3.7)
55595c000872 lock_PyThread_acquire_lock+0x1d2 (/home/maartenbreddels/miniconda/envs/dev/bin/python3.7)
55595bfe71f3 _PyMethodDef_RawFastCallKeywords+0x263 (/home/maartenbreddels/miniconda/envs/dev/bin/python3.7)
55595bfe7313 _PyCFunction_FastCallKeywords+0x23 (/home/maartenbreddels/miniconda/envs/dev/bin/python3.7)
55595c01d657 call_function+0x3b7 (/home/maartenbreddels/miniconda/envs/dev/bin/python3.7)
55595c060d00 _PyEval_EvalFrameDefault+0x610 (/home/maartenbreddels/miniconda/envs/dev/bin/python3.7)
55595bfb6db1 _PyEval_EvalCodeWithName+0x251 (/home/maartenbreddels/miniconda/envs/dev/bin/python3.7)
55595bfd6b00 _PyFunction_FastCallKeywords+0x520 (/home/maartenbreddels/miniconda/envs/dev/bin/python3.7)
55595c01d334 call_function+0x94 (/home/maartenbreddels/miniconda/envs/dev/bin/python3.7)
55595c060d00 _PyEval_EvalFrameDefault+0x610 (/home/maartenbreddels/miniconda/envs/dev/bin/python3.7)
55595bfd6766 _PyFunction_FastCallKeywords+0x186 (/home/maartenbreddels/miniconda/envs/dev/bin/python3.7)
55595c01d334 call_function+0x94 (/home/maartenbreddels/miniconda/envs/dev/bin/python3.7)
55595c060d00 _PyEval_EvalFrameDefault+0x610 (/home/maartenbreddels/miniconda/envs/dev/bin/python3.7)
55595bfd6766 _PyFunction_FastCallKeywords+0x186 (/home/maartenbreddels/miniconda/envs/dev/bin/python3.7)
55595c060ae4 _PyEval_EvalFrameDefault+0x3f4 (/home/maartenbreddels/miniconda/envs/dev/bin/python3.7)
55595bfb6db1 _PyEval_EvalCodeWithName+0x251 (/home/maartenbreddels/miniconda/envs/dev/bin/python3.7)
55595c074e5d builtin_exec+0x33d (/home/maartenbreddels/miniconda/envs/dev/bin/python3.7)
55595bfe7078 _PyMethodDef_RawFastCallKeywords+0xe8 (/home/maartenbreddels/miniconda/envs/dev/bin/python3.7)
55595bfe7313 _PyCFunction_FastCallKeywords+0x23 (/home/maartenbreddels/miniconda/envs/dev/bin/python3.7)
55595c066c39 _PyEval_EvalFrameDefault+0x6549 (/home/maartenbreddels/miniconda/envs/dev/bin/python3.7)
55595bfb77e0 _PyEval_EvalCodeWithName+0xc80 (/home/maartenbreddels/miniconda/envs/dev/bin/python3.7)
55595bfd6b62 _PyFunction_FastCallKeywords+0x582 (/home/maartenbreddels/miniconda/envs/dev/bin/python3.7)
55595c01d334 call_function+0x94 (/home/maartenbreddels/miniconda/envs/dev/bin/python3.7)
55595c060d00 _PyEval_EvalFrameDefault+0x610 (/home/maartenbreddels/miniconda/envs/dev/bin/python3.7)
55595bfd6766 _PyFunction_FastCallKeywords+0x186 (/home/maartenbreddels/miniconda/envs/dev/bin/python3.7)
55595c01d334 call_function+0x94 (/home/maartenbreddels/miniconda/envs/dev/bin/python3.7)
55595c060d00 _PyEval_EvalFrameDefault+0x610 (/home/maartenbreddels/miniconda/envs/dev/bin/python3.7)
55595bfd6766 _PyFunction_FastCallKeywords+0x186 (/home/maartenbreddels/miniconda/envs/dev/bin/python3.7)
55595c01d334 call_function+0x94 (/home/maartenbreddels/miniconda/envs/dev/bin/python3.7)
55595c060d00 _PyEval_EvalFrameDefault+0x610 (/home/maartenbreddels/miniconda/envs/dev/bin/python3.7)
55595bfd6766 _PyFunction_FastCallKeywords+0x186 (/home/maartenbreddels/miniconda/envs/dev/bin/python3.7)
55595c060ae4 _PyEval_EvalFrameDefault+0x3f4 (/home/maartenbreddels/miniconda/envs/dev/bin/python3.7)
55595bfb6db1 _PyEval_EvalCodeWithName+0x251 (/home/maartenbreddels/miniconda/envs/dev/bin/python3.7)
55595bfb81e2 PyEval_EvalCode+0x22 (/home/maartenbreddels/miniconda/envs/dev/bin/python3.7)
55595c0c51d1 run_mod+0x31 (/home/maartenbreddels/miniconda/envs/dev/bin/python3.7)
55595c0cf31d PyRun_FileExFlags+0x9d (/home/maartenbreddels/miniconda/envs/dev/bin/python3.7)
55595c0cf50a PyRun_SimpleFileExFlags+0x1ba (/home/maartenbreddels/miniconda/envs/dev/bin/python3.7)
55595c0d05f0 pymain_main+0x3e0 (/home/maartenbreddels/miniconda/envs/dev/bin/python3.7)
55595c0d067b _Py_UnixMain+0x3b (/home/maartenbreddels/miniconda/envs/dev/bin/python3.7)
7f48849bc0b2 __libc_start_main+0xf2 (/usr/lib/x86_64-linux-gnu/libc-2.31.so)
55595c075100 _start+0x28 (/home/maartenbreddels/miniconda/envs/dev/bin/python3.7)
…
Note : also called
pthread_cond_timedwait
, it is used by https://github.com/sumerc/gilstats.py for eBPF in case you are interested in other mutexes.
Another note : note that there is no Python stack trace here, but instead we got
_PyEval_EvalFrameDefault
more. In the future, I plan to write how to insert a stack trace.
The conversion tool
per4m perf2trace
understands this and generates a different result when the trace contains
take_gil
:
$ perf script --no-inline | per4m perf2trace sched -o perf1-gil.json
Wrote to perf1-gil.json
$ viztracer --combine perf1-gil.json viztracer1-gil.json -o example1-gil.html
Saving report to /home/maartenbreddels/github/maartenbreddels/per4m/example1.html ...
Dumping trace data to json, total entries: 131, estimated json file size: 15.4KiB
Generating HTML report
Report saved.
We get:
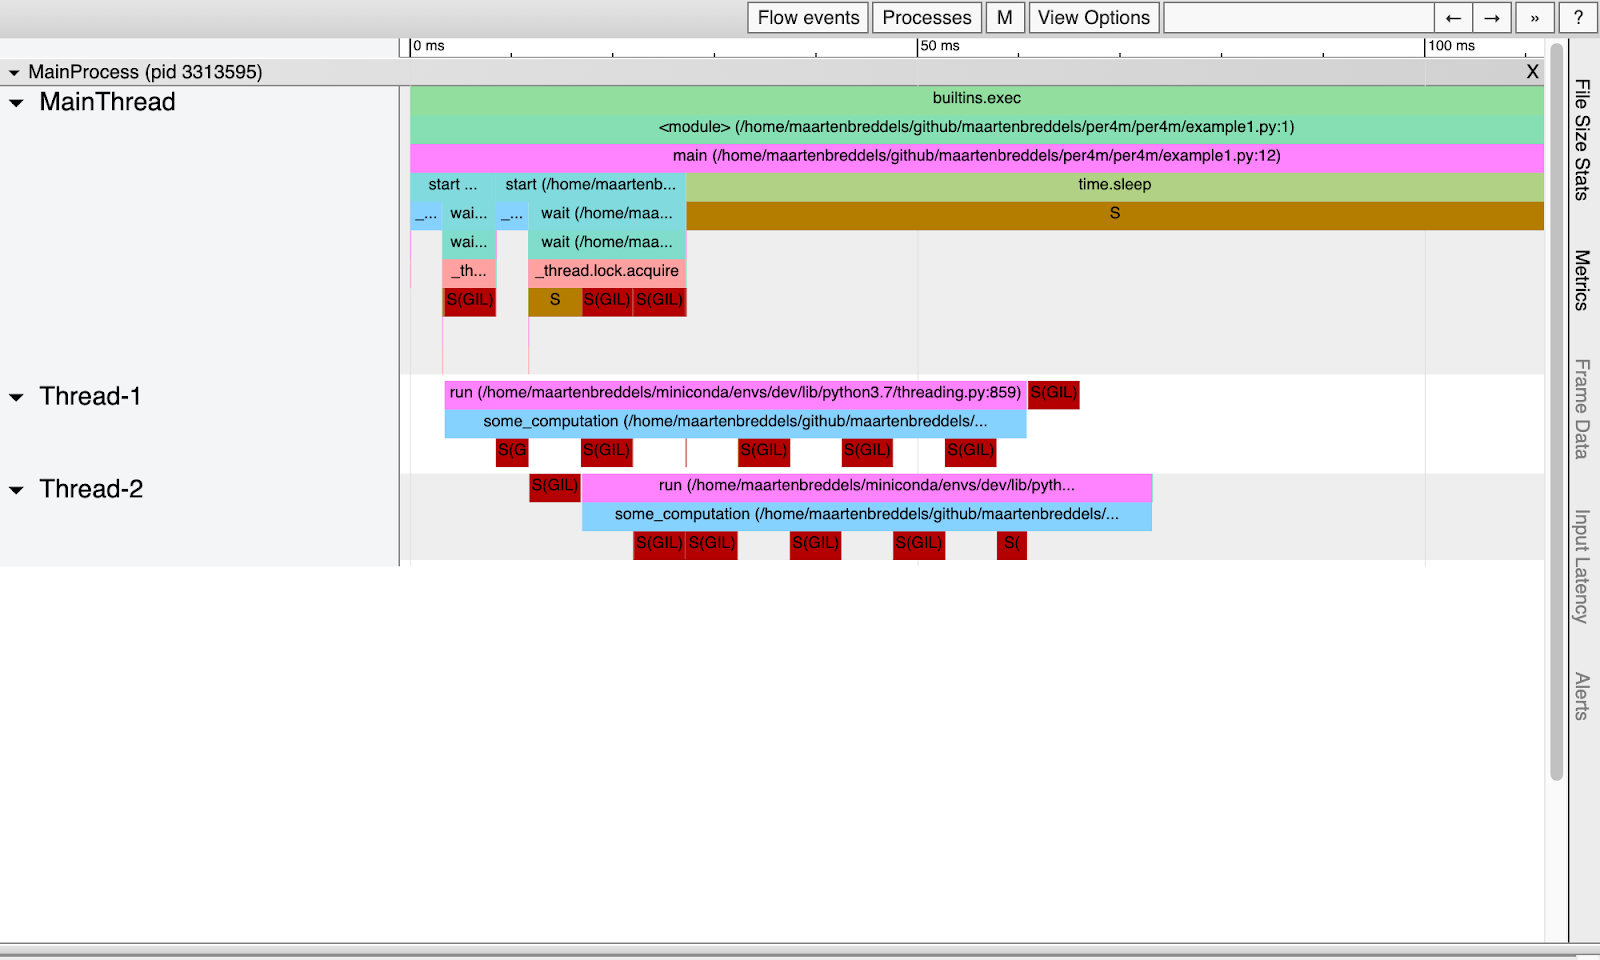
Now we can see exactly where the GIL comes into play!
Through probing (kprobes / uprobes)
We know when processes are asleep (because of GIL or other reasons), but if you want to learn more about when to turn on or off GIL, you need to know when the called and returns the results
take_gil
and
drop_gil
. This trace can be obtained by probing with perf. In a user environment, probes are uprobes, which are analogous to kprobes, which, as you might have guessed, work in the kernel environment. Again, Julia Evans is a great source of additional information .
Install 4 probes:
sudo perf probe -f -x `which python` python:take_gil=take_gil
sudo perf probe -f -x `which python` python:take_gil=take_gil%return
sudo perf probe -f -x `which python` python:drop_gil=drop_gil
sudo perf probe -f -x `which python` python:drop_gil=drop_gil%return
Added new events:
python:take_gil (on take_gil in /home/maartenbreddels/miniconda/envs/dev/bin/python3.7)
python:take_gil_1 (on take_gil in /home/maartenbreddels/miniconda/envs/dev/bin/python3.7)
You can now use it in all perf tools, such as:
perf record -e python:take_gil_1 -aR sleep 1
Failed to find "take_gil%return",
because take_gil is an inlined function and has no return point.
Added new event:
python:take_gil__return (on take_gil%return in /home/maartenbreddels/miniconda/envs/dev/bin/python3.7)
You can now use it in all perf tools, such as:
perf record -e python:take_gil__return -aR sleep 1
Added new events:
python:drop_gil (on drop_gil in /home/maartenbreddels/miniconda/envs/dev/bin/python3.7)
python:drop_gil_1 (on drop_gil in /home/maartenbreddels/miniconda/envs/dev/bin/python3.7)
You can now use it in all perf tools, such as:
perf record -e python:drop_gil_1 -aR sleep 1
Failed to find "drop_gil%return",
because drop_gil is an inlined function and has no return point.
Added new event:
python:drop_gil__return (on drop_gil%return in /home/maartenbreddels/miniconda/envs/dev/bin/python3.7)
You can now use it in all perf tools, such as:
perf record -e python:drop_gil__return -aR sleep 1
There are some complaints, and because of the inline ones
drop_gil
,
take_gil
several probes / events were added (that is, the function is presented several times in the binary file), but everything works.
Note : I may have been lucky that my Python binary (from conda-forge) was compiled so that the corresponding
take_gil
/
drop_gil
(and their results) worked successfully to solve this problem.
Please note that probes do not affect performance, and only when they are "active" (for example, when we monitor them from perf), they run the code on a different branch. During monitoring, the affected pages are copied for the monitored process, and checkpoints are inserted at the right places(INT3 for x86 processors). The checkpoint fires an event for perf with little overhead. If you want to remove the probes, then run the command:
$ sudo perf probe --del 'python*'
Now perf knows about new events that it can listen to, so let's run it again with an additional argument
-e 'python:*gil*'
:
$ perf record -e sched:sched_switch -e sched:sched_process_fork -e 'sched:sched_wak*' -k CLOCK_MONOTONIC \
-e 'python:*gil*' -- viztracer -o viztracer1-uprobes.json --ignore_frozen -m per4m.example1
Note : we removed it
--call-graph dwarf
, otherwise perf will not be in time and we will lose events.
Then, using per4m perf2trace, we convert it to JSON, which is understandable for VizTracer, and at the same time we get new statistics.
$ perf script --no-inline | per4m perf2trace gil -o perf1-uprobes.json
...
Summary of threads:
PID total(us) no gil% has gil% gil wait%
-------- ----------- ----------- ------------ -------------
3353567* 164490.0 65.9 27.3 6.7
3353569 66560.0 0.3 48.2 51.5
3353570 60900.0 0.0 56.4 43.6
High 'no gil' is good, we like low 'has gil',
and we don't want 'gil wait'. (* indicates main thread)
...
Wrote to perf1-uprobes.json
Subcommand
per4m perf2trace gil
also gives as a result gil_load . From it, we learn that both threads wait for the GIL about half the time, as expected.
With the same perf.data file recorded by perf, we can also generate information about the state of a thread or process. But since we were running without stack traces, we don't know if the process slept due to the GIL or not.
$ perf script --no-inline | per4m perf2trace sched -o perf1-state.json
Wrote to perf1-state.json
Finally, let's put all three results together:
$ viztracer --combine perf1-state.json perf1-uprobes.json viztracer1-uprobes.json -o example1-uprobes.html Saving report to /home/maartenbreddels/github/maartenbreddels/per4m/example1-uprobes.html ... Dumping trace data to json, total entries: 10484, estimated json file size: 1.2MiB Generating HTML report Report saved.
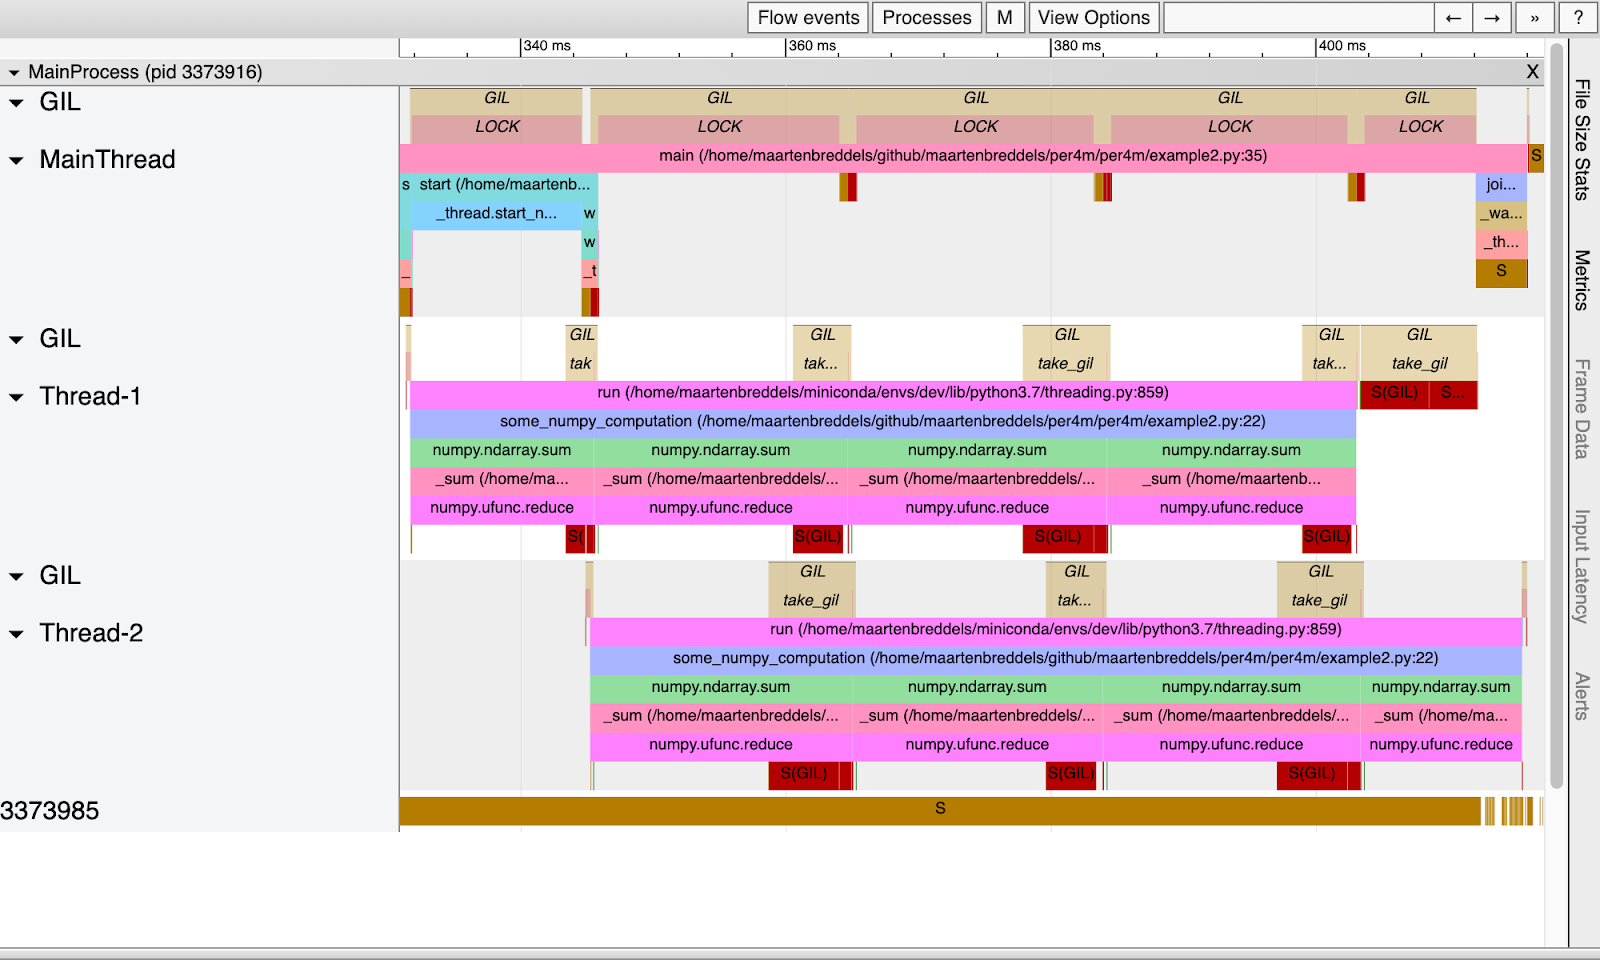
VizTracer gives a good idea of who had the GIL and who was waiting for it:

Above each thread is written when the thread or process waits for the GIL and when it is turned on (marked as LOCK). Note that these periods overlap with periods when the thread or process is awake (running!). Also note that we only see one thread or process in the running state, as it should be because of the GIL.
The time between calls
take_gil
, that is, between locks (and therefore between sleeping or waking up), is exactly the same as in the above table in the gil wait% column. The duration of GIL activation for each thread, marked as LOCK, corresponds to the time in the gil% column.
Releasing the Kraken ... ghm, GIL
We have seen how when a pure Python program is multithreaded, the GIL limits performance by allowing only one thread or process to execute at a time (for one Python process, of course, and possibly in the future for one (sub) interpreter). Now let's see what happens if you disable the GIL, as it happens when executing NumPy functions.
The second example executes
some_numpy_computation
which calls the NumPy function M = 4 times in parallel on two threads, while the main thread executes pure Python code.
import threading
import time
import numpy as np
N = 1024*1024*32
M = 4
x = np.arange(N, dtype='f8')
def some_numpy_computation():
total = 0
for i in range(M):
total += x.sum()
return total
def main(args=None):
thread1 = threading.Thread(target=some_numpy_computation)
thread2 = threading.Thread(target=some_numpy_computation)
thread1.start()
thread2.start()
total = 0
for i in range(2_000_000):
total += i
for thread in [thread1, thread2]:
thread.join()
main()
Instead of executing this script with perf and VizTracer, we will use a utility
per4m giltracer
that automates all of the above steps. She'll make it a little smarter. Basically, we'll run perf twice, once without a stack trace, and the second time with it, and import the module / script before executing its main function to get rid of an uninteresting trace like the same import. This will happen quickly enough so that we don't lose events.
$ giltracer --state-detect -o example2-uprobes.html -m per4m.example2 ...
Streams totals:
PID total(us) no gil% has gil% gil wait%
-------- ----------- ----------- ------------ -------------
3373601* 1359990.0 95.8 4.2 0.1
3373683 60276.4 84.6 2.2 13.2
3373684 57324.0 89.2 1.9 8.9
High 'no gil' is good, we like low 'has gil',
and we don't want 'gil wait'. (* indicates main thread)
...
Saving report to /home/maartenbreddels/github/maartenbreddels/per4m/example2-uprobes.html ...
...
Although the main thread executes Python code (GIL is enabled for it, which is denoted by the word LOCK), other threads also execute in parallel. Note that in the pure Python example, we have one thread or process running at the same time. And here actually three threads are executed in parallel. This is possible because the NumPy routines included with C / C ++ / Fortran disabled the GIL.
However, the GIL still affects threads, because when the NumPy function returns to Python, it needs to get the GIL again, as seen in the lengthy blocks
take_gil
. This takes 10% of the time of each thread.
Jupyter Integration
Since my workflow often involves running a MacBook (which doesn't run perf, but supports dtrace) connected to a Linux machine remotely, I use Jupyter notebook to execute code remotely. And since I'm a Jupyter developer, I had to do a wrapper with
cell magic
.
# this registers the giltracer cell magic
%load_ext per4m
%%giltracer
# this call the main define above, but this can also be a multiline code cell
main()
Saving report to /tmp/tmpvi8zw9ut/viztracer.json ...
Dumping trace data to json, total entries: 117, estimated json file size: 13.7KiB
Report saved.
[ perf record: Woken up 1 times to write data ]
[ perf record: Captured and wrote 0,094 MB /tmp/tmpvi8zw9ut/perf.data (244 samples) ]
Wait for perf to finish...
perf script -i /tmp/tmpvi8zw9ut/perf.data --no-inline --ns | per4m perf2trace gil -o /tmp/tmpvi8zw9ut/giltracer.json -q -v
Saving report to /home/maartenbreddels/github/maartenbreddels/fastblog/_notebooks/giltracer.html ...
Dumping trace data to json, total entries: 849, estimated json file size: 99.5KiB
Generating HTML report
Report saved.
Download giltracer.html
Open giltracer.html in a new tab (may not work due to security)
Conclusion
With perf, we can determine the states of processes or threads, which helps to understand which of them has the GIL enabled in Python. And with the help of stack traces, you can determine that the cause of the sleep was the GIL, and not
time.sleep
, for example.
Combining uprobes with perf allows you to trace the invocation and return of function results
take_gil
and
drop_gil
get even more insight into the impact of the GIL on your Python program.
Our work is facilitated by the experimental per4m package, which converts the perf script to the JSON format VizTracer, as well as some orchestration tools.
A lot of bukaf, did not master
If you just want to see the impact of the GIL, then run this once:
sudo yum install perf
sudo sysctl kernel.perf_event_paranoid=-1
sudo mount -o remount,mode=755 /sys/kernel/debug
sudo mount -o remount,mode=755 /sys/kernel/debug/tracing
sudo perf probe -f -x `which python` python:take_gil=take_gil
sudo perf probe -f -x `which python` python:take_gil=take_gil%return
sudo perf probe -f -x `which python` python:drop_gil=drop_gil
sudo perf probe -f -x `which python` python:drop_gil=drop_gil%return
pip install "viztracer>=0.11.2" "per4m>=0.1,<0.2"
Usage example:
# module
$ giltracer per4m/example2.py
# script
$ giltracer -m per4m.example2
# add thread/process state detection
$ giltracer --state-detect -m per4m.example2
# without uprobes (in case that fails)
$ giltracer --state-detect --no-gil-detect -m per4m.example2
Future plans
I wish I didn't have to develop these tools. I hope I managed to inspire someone to create better products than mine. I want to focus on writing high performance code. However, I have such plans for the future:
- Dig up a performance meter in VizTracer to look at cache misses or process downtime.
- Implement python stack trace in perf traces to combine with tools like http://www.brendangregg.com/offcpuanalysis.html
- Repeat the same exercise with dtrace to use on macOS.
- Automatically detect which C functions don't disable the GIL ( https://github.com/vaexio/vaex/pull/1114 , https://github.com/apache/arrow/pull/7756 )
- , https://github.com/h5py/h5py/issues/1516