Hello, Habr.
Quite an interesting area of "applied statistics" and NLP (Natural Languages Processing and not at all what many now think) is text analysis. This direction appeared long before computers, and had a completely practical goal: to determine the author of this or that text. With the help of a PC, however, it is much easier and more convenient, and the results are quite interesting. Let's see what patterns can be identified using very simple Python code.
For those who are interested, the continuation under the cut.
History
One of the first practical tasks was to determine the authorship of political texts The Federalist Papers , written in the United States in the 1780s. Their authors were several people, but who is who, it was completely unknown. The first approach to constructing the word length distribution curve was taken back in 1851 , and you can imagine how much work it was. Now, thank God, everything is easier. I will consider the simplest way of analysis using simple calculations and the Natural Language Toolkit , which, together with matplotlib, allows you to get interesting results in just a few lines of code. We will see how all this can be visualized, and what patterns can be seen.
Those interested in the results can skip the "code" chapter.
The code
. :
s = """
         ,  .   ,
           :      ?"""
nltk:
import nltk

nltk.data.find('tokenizers/punkt')

tokens = nltk.word_tokenize(s)
tokens :
['', '', '', '', '', '', '', '', '',
 '', '', '', '', ',', '', ...]
, :
import string

remove_punctuation = str.maketrans('', '', string.punctuation)
tokens_ = [x for x in [t.translate(remove_punctuation).lower() for t in tokens] if len(x) > 0]
: . .
text = nltk.Text(tokens_)
lexical_diversity = (len(set(text)) / len(text)) * 100
96.6%.
:
words = set(tokens_)
word_chars = [len(word) for word in words]
mean_word_len = sum(word_chars) / float(len(word_chars))
set(tokens_) , , . 4.86.
sent_tokenize NLTK, , , .
import numpy as np
sentences = nltk.sent_tokenize(s)
sentence_word_length = [len(sent.split()) for sent in sentences]
mean_sentence_len = np.mean(sentence_word_length)
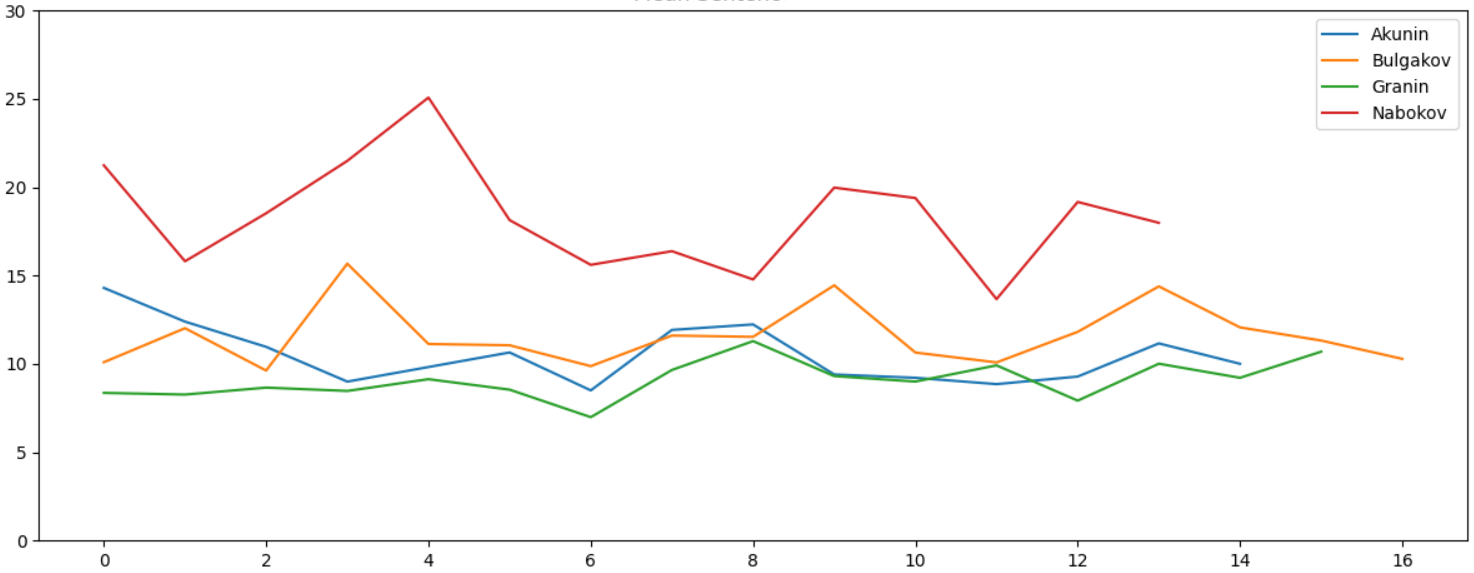
15 .
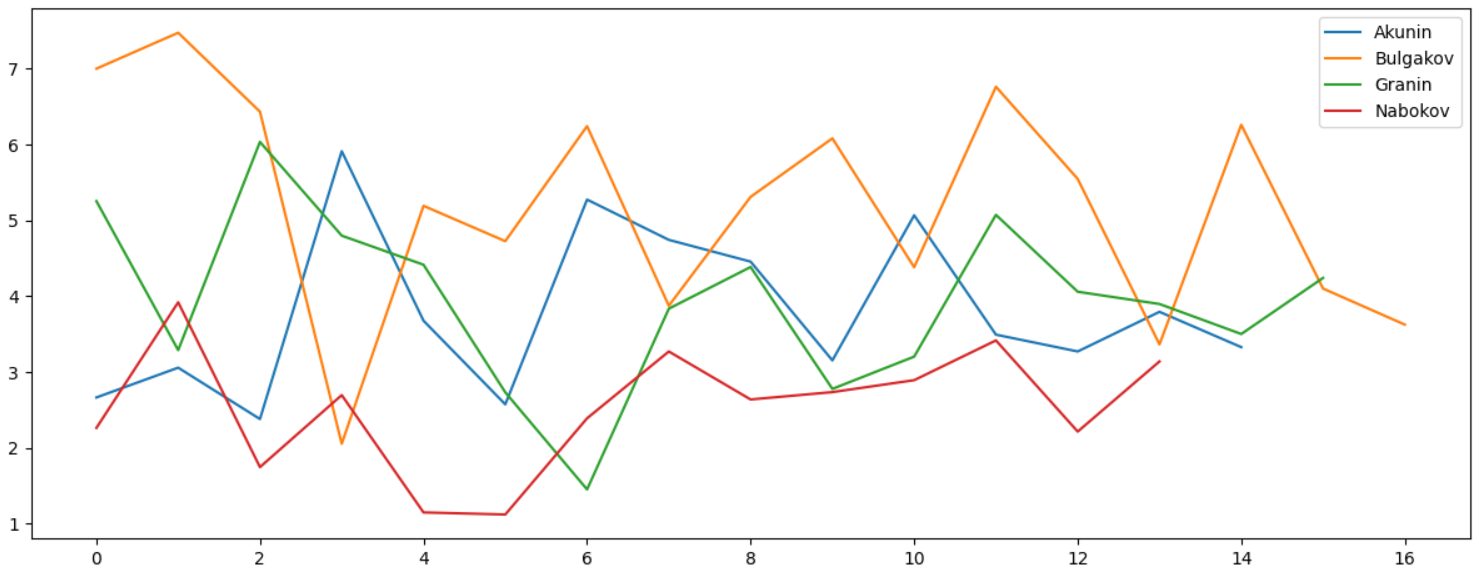
- . , , ("", ""). 1000 :
fdist = nltk.probability.FreqDist(nltk.Text(tokens))
commas_per_thousand = (fdist[","] * 1000) / fdist.N()
57.14 1000 .
, - .
import codecs

try:
    doc = codecs.open(file_name, 'r', 'cp1251').read()
except:
    doc = codecs.open(file_name, 'r', 'utf-8').read()
, . , -, 1251. copy-paste , UTF-8. 1251, UTF-8, .
. , . 4 , Lib.ru. , .
- :
, , , - . " " . :
, , , . - , :
, , , , , , , , , , , , , , , , .
1000 , - , , :
, , , , ":":
, :
, . , :
, , . "" , , . , , .
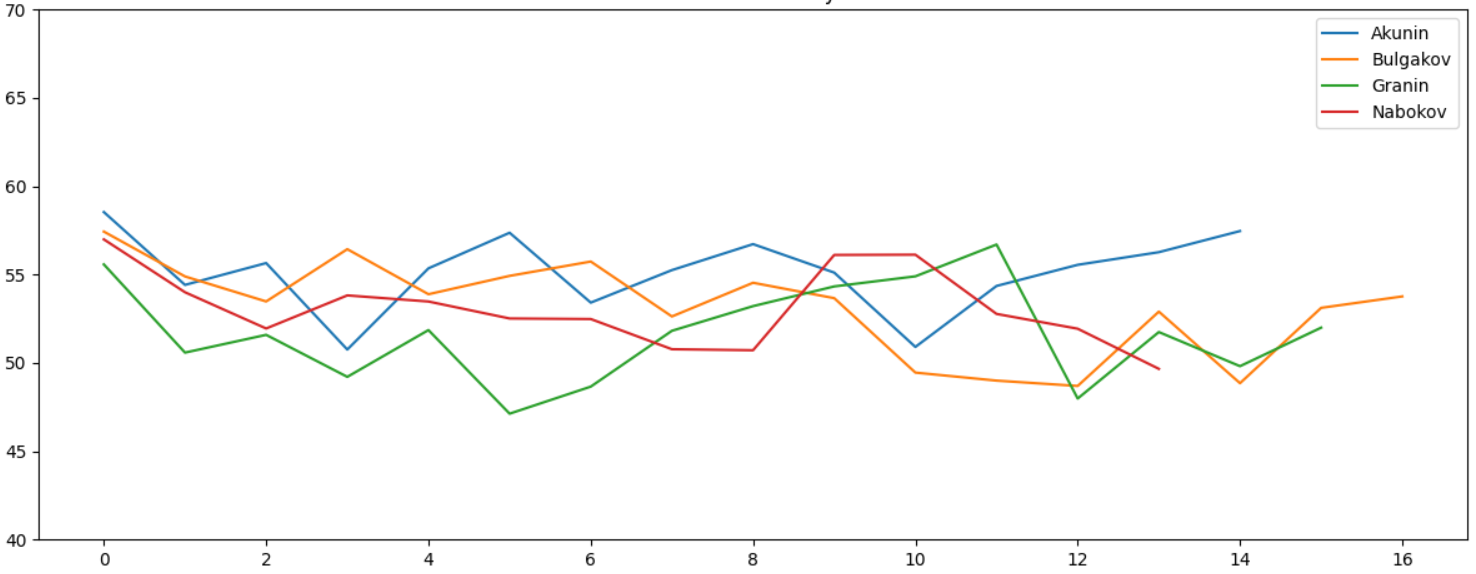
. " " , . Lexical Diversity. , :
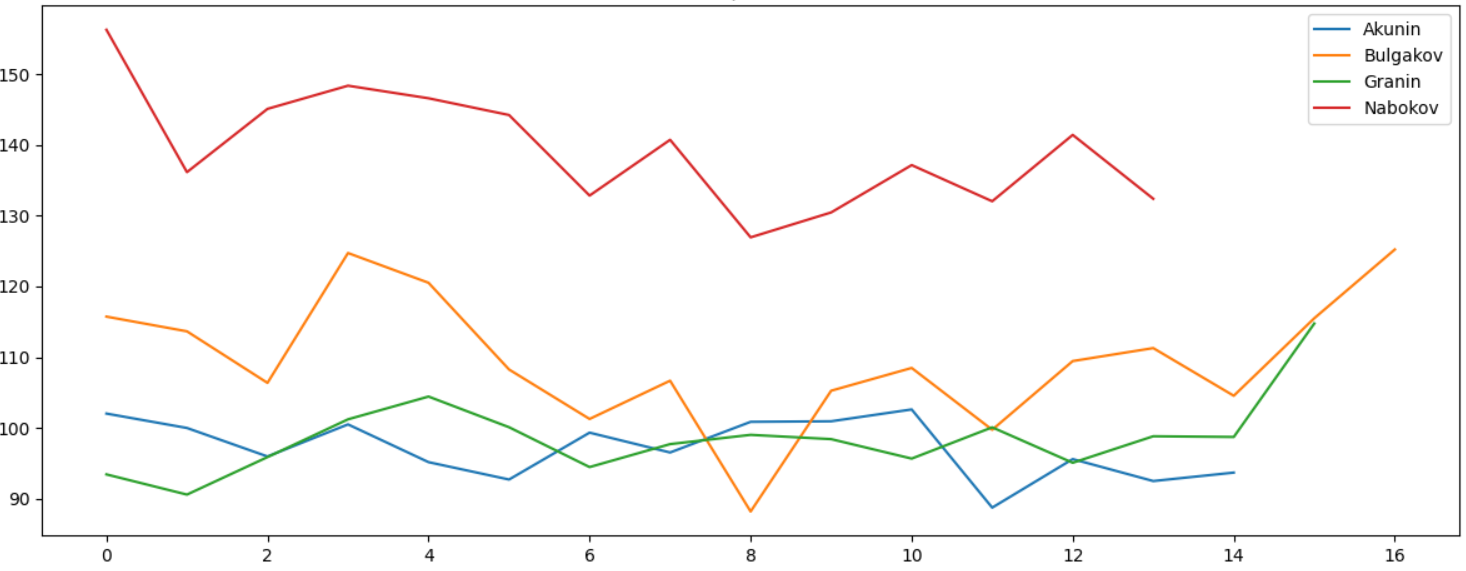
, . 10 , . , . , - , :
, , , , ...
. , , , .
, Python 3.7 .
text_process.py
import nltk, codecs
import numpy as np
import pandas as pd
import matplotlib.pyplot as plt
from typing import Optional, List
import string
import glob
import sys, os


def get_articles_from_blob(folder: str):
    data = []
    for path in glob.glob(folder + os.sep + "*"):
        print(path)
        data += get_articles_from_folder(path)
    return data

def get_articles_from_folder(folder: str):
    data = []
    for path in glob.glob(folder + os.sep + "*.txt"):
        data += get_data_from_file(path)
    return [(folder.split(os.sep)[-1], data)]

def get_data_from_file(file_name: str):
    print("Get data for %s" % file_name)
    try:
        doc = codecs.open(file_name, 'r', 'cp1251').read()
    except:
        doc = codecs.open(file_name, 'r', 'utf-8').read()
    chunk_size = 25000
    data = []
    for part in [doc[i:i+chunk_size] for i in range(0, len(doc) - (len(doc) % chunk_size), chunk_size)]:
        data.append(get_data_from_str(part[part.find(' '):part.rfind(' ')]))
    return data

def get_data_from_str(doc: str):
    tokens = nltk.word_tokenize(doc)
    remove_punctuation = str.maketrans('', '', string.punctuation)
    tokens_ = [x for x in [t.translate(remove_punctuation).lower() for t in tokens] if len(x) > 0]
    text = nltk.Text(tokens_)
    lexical_diversity = (len(set(text)) / len(text)) * 100

    words = set(tokens_)
    word_chars = [len(word) for word in words]
    mean_word_len = sum(word_chars) / float(len(word_chars))

    sentences = nltk.sent_tokenize(doc)
    sentence_word_length = [len(sent.split()) for sent in sentences]
    mean_sentence_len = np.mean(sentence_word_length)

    fdist = nltk.probability.FreqDist(nltk.Text(tokens))
    commas_per_thousand = (fdist[","] * 1000) / fdist.N()
    return (lexical_diversity, mean_word_len, mean_sentence_len, commas_per_thousand)

def plot_data(data):
    plt.rcParams["figure.figsize"] = (12, 5)
    fig, ax = plt.subplots()

    plt.title('Lexical diversity')
    for author, author_data in data:
        plt.plot(list(map(lambda val: val[0], author_data)), label=author)
    plt.ylim([40, 70])

    # plt.title('Mean Word Length')
    # for author, author_data in data:
    #     plt.plot(list(map(lambda val: val[1], author_data)), label=author)
    # plt.ylim([4, 8])

    # plt.title('Mean Sentence Length')
    # for author, author_data in data:
    #     plt.plot(list(map(lambda val: val[2], author_data)), label=author)
    # plt.ylim([0, 30])

    # plt.title("Commas per thousand")
    # for author, author_data in data:
    #     plt.plot(list(map(lambda val: val[3], author_data)), label=author)

    plt.legend(loc='upper right')
    plt.tight_layout()
    plt.show()

def get_freqs_from_folder(folder: str):
    freqs_data = []
    for path in glob.glob(folder + os.sep + "*.txt"):
        print("Get data for %s" % path)
        try:
            doc = codecs.open(path, 'r', 'cp1251').read()
        except:
            doc = codecs.open(path, 'r', 'utf-8').read()
        symbols, freqs = get_freqs_from_str(doc)
        freqs_data.append((path.split(os.sep)[-1], symbols, freqs))
    return freqs_data

def get_freqs_from_str(doc: str):
    tokens = nltk.word_tokenize(doc)
    tokens = [x for x in [t.lower() for t in tokens]]
    fdist = nltk.probability.FreqDist(nltk.Text(tokens))

    symbols = [",", ":", "(", ")", "!", "", "", "", "", "", "", "", "", "", "", "", "", ""]
    freqs = []
    for s in symbols:
        freq = (fdist[s] * 1000) / fdist.N()
        if s == ",":
            freq /= 2
        freqs.append(freq)
    return (symbols, freqs)

def plot_freqs(data):
    plt.rcParams["figure.figsize"] = (12, 5)

    for author, symbols, freqs in data:
        plt.plot(symbols, freqs, label=author)

    plt.legend(loc='upper right')
    plt.tight_layout()
    plt.show()


if __name__ == "__main__":
    # Download punkt tokenizer
    try:
        nltk.data.find('tokenizers/punkt')
    except LookupError:
        nltk.download('punkt')

    # Process text files
    # data = get_articles_from_blob("Folder")  # Folder/AuthorXX/Text.txt
    data = get_articles_from_folder("folder_here")  # Folder with files
    plot_data(data)

    # Process frequency curve
    data = get_freqs_from_folder("folder_here")
    plot_freqs(data)