AOT and JIT compilers
Processors can only execute a limited set of instructions - machine code. For a program to be executed by a processor, it must be represented as machine code.
There are compiled programming languages such as C and C ++. Programs written in these languages are distributed as machine code. After the program is written, a special process - the Ahead-of-Time (AOT) compiler, usually referred to simply as the compiler, translates the source code into machine code. Machine code is designed to run on a specific processor model. Processors with a common architecture can execute the same code. Later processor models generally support instructions from earlier models, but not vice versa. For example, machine code using AVX instructions for the Intel Sandy Bridge processors cannot run on older Intel processors. There are various ways to solve this problem, for example, transferring critical parts of the program to a library that has versions for the main processor models.But often programs are simply compiled for relatively old processor models and do not take advantage of the new instruction sets.
In contrast to compiled programming languages, there are interpreted languages such as Perl and PHP. With this approach, the same source code can be run on any platform for which an interpreter exists. The downside to this approach is that interpreted code is slower than machine code that does the same.
The Java language offers a different approach, a cross between compiled and interpreted languages. Java applications are compiled into an intermediate low-level code - bytecode.
The name bytecode was chosen because exactly one byte is used to encode each operation. There are about 200 operations in Java 10.
The bytecode is then executed by the JVM as well as an interpreted language program. But since the bytecode has a well-defined format, the JVM can compile it to machine code at runtime. Naturally, older versions of the JVM will not be able to generate machine code using the new processor instruction sets after them. On the other hand, in order to speed up a Java program, it doesn't even need to be recompiled. It is enough to run it on a newer JVM.
HotSpot JIT compiler
Different JVM JIT implementations can implement the compiler in different ways. In this article, we look at Oracle HotSpot JVM and its JIT compiler implementation. The name HotSpot comes from the approach the JVM uses to compile bytecode. Typically, in an application, only small parts of the code are executed quite often and the performance of the application mainly depends on the speed of execution of these particular parts. These parts of the code are called hot spots and are what the JIT compiler compiles. Several judgments underlie this approach. If the code is only executed once, then compiling that code is a waste of time. Another reason is optimizations. The more times the JVM executes any code, the more statistics it accumulates, using which you can generate more optimized code.In addition, the compiler shares the resources of the virtual machine with the application itself, so the resources spent on profiling and optimization could be used to execute the application itself, which forces a certain balance to be observed. The unit of work for the HotSpot compiler is a method and a loop.
The unit of compiled code is called nmethod (short for native method).
Tiered compilation
In fact, the HotSpot JVM has not one, but two compilers: C1 and C2. Their other names are client and server. Historically C1 was used in GUI applications and C2 in server applications. Compilers differ in how quickly they start compiling code. C1 starts to compile the code faster, while C2 can generate more optimized code.
In earlier versions of the JVM, you had to choose a compiler using the -client flags for the client and -server or -d64for the server room. JDK 6 introduced multilevel compilation mode. Roughly speaking, its essence lies in a sequential transition from the interpreted code to the code generated by the compiler C1, and then C2. In JDK 8 the -client, -server, and -d64 flags are ignored, and in JDK 11 the -d64 flag has been removed and results in an error. You can turn off the tiered compilation mode with the -XX: -TieredCompilation flag .
There are 5 compilation levels:
- 0 - interpreted code
- 1 - C1 fully optimized (no profiling)
- 2 - C1 taking into account the number of method calls and loop iterations
- 3 - C1 with profiling
- 4 - C2
Typical sequences of transitions between levels are shown in the table.
| Sequence
|
Description
|
|---|---|
| 0-3-4 | Interpreter, level 3, level 4. Most common. |
| 0-2-3-4 | , 4 (C2) . 2. , 3 , , 4. |
| 0-2-4 | , 3 . 4 3. 2 4. |
| 0-3-1 | . 3, , 4 . 1. |
| 0-4 | . |
Code cache
The machine code compiled by the JIT compiler is stored in a memory area called the code cache. It also stores the machine code of the virtual machine itself, such as interpreter code. The size of this memory area is limited, and when it is full, compilation stops. In this case, some of the "hot" methods will continue to be executed by the interpreter. In case of an overflow, the JVM displays the following message:
Java HotSpot(TM) 64-Bit Server VM warning: CodeCache is full. Compiler has been disabled.
Another way to find out about an overflow of this memory area is to enable logging of the compiler operation (how to do this is discussed below).
The code cache is configurable in the same way as other memory areas in the JVM. The initial size is specified by the -XX: InitialCodeCacheSize parameter . The maximum size is specified by the -XX: ReservedCodeCacheSize parameter . By default, the initial size is 2496 KB. The maximum size is 48 MB when tiered compilation is off and 240 MB when it is on.
Since Java 9, the code cache is divided into 3 segments (the total size is still limited by the limits described above):
- JVM internal (non-method code). , JVM, , . . 5.5 MB. -XX:NonNMethodCodeHeapSize.
- Profiled code. . non-method code . 21.2 MB 117.2 MB . -XX:ProfiledCodeHeapSize.
- Non-profiled code. . non-method code . 21.2 MB 117.2 MB . -XX: NonProfiledCodeHeapSize.
You can enable logging of the compilation process with the -XX: + PrintCompilation flag (it is disabled by default). When this flag is set, the JVM will write a message to the standard output (STDOUT) every time a method or loop is compiled. Most messages have the following format: timestamp compilation_id attributes tiered_level method_name size deopt.
The timestamp field is the time since the start of the JVM.
The compilation_id field is the internal ID of the issue. It usually grows sequentially with each message, but sometimes the order can be out of order. This can happen when there are multiple compilation threads running in parallel.
The attributes field is a set of five characters that carry additional information about the compiled code. If any of the attributes are not applicable, a space is displayed instead. The following attributes exist:
- % - OSR (on-stack replacement);
- s - the method is synchronized;
- ! - the method contains an exception handler;
- b - compilation occurred in blocking mode;
- n - the compiled method is a wrapper for the native method.
OSR stands for on-stack replacement. Compilation is an asynchronous process. When the JVM decides that a method needs to be compiled, it is queued. While the method is being compiled, the JVM continues to execute it by the interpreter. The next time the method is called again, the compiled version will be executed. In the case of a long cycle, waiting for the completion of the method is impractical - it may not complete at all. The JVM compiles the body of the loop and should start executing the compiled version of it. The JVM stores the state of threads on a stack. For each method called, a new Stack Frame object is created on the stack, which stores the method parameters, local variables, return value, and other values. During OSR, a new Stack Frame is created to replace the previous one.
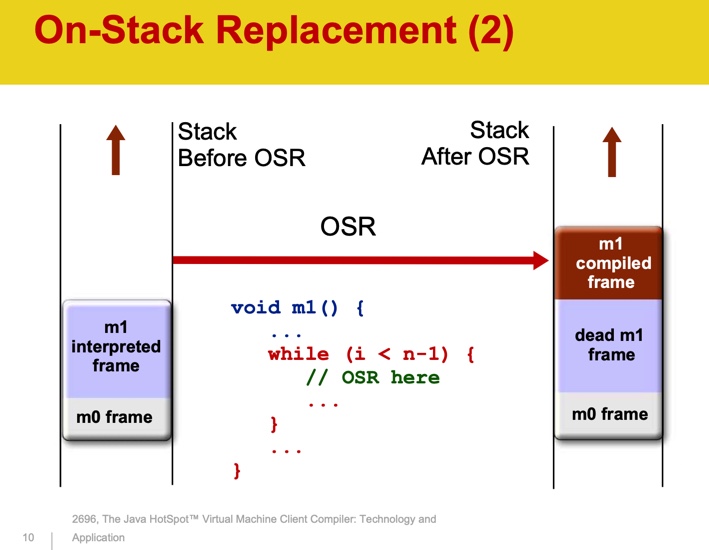
Source: The Java HotSpotTM Virtual Machine Client Compiler: Technology and Application
The "s" and "!" Attributes I think they don't need an explanation.
The "b" attribute means that the compilation did not take place in the background, and should not be found in modern versions of the JVM.
The "n" attribute means that the compiled method is a wrapper around a native method.
The tiered_level field contains the level number at which the code was compiled or can be empty if tiered compilation is disabled.
The method_name field contains the name of the compiled method or the name of the method containing the compiled loop.
The size field contains the size of the compiled bytecode, not the size of the resulting machine code. The size is in bytes.
The deopt field does not appear in every message, it contains the name of the deoptimization performed and may contain messages such as "made not entrant" and "made zombie".
Sometimes the following entries may appear in the log: timestamp compile_id COMPILE SKIPPED: reason. They mean that something went wrong when the method was compiled. There are times when this is expected:
- Code cache filled - it is necessary to increase the size of the code cache memory area.
- Concurrent classloading - the class was modified at compile time.
In all cases, except for a code cache overflow, the JVM will try to re-compile. If it doesn't, you can try simplifying the code.
If the process was started without the -XX: + PrintCompilation flag, you can look at the compilation process using the jstat utility . Jstat has two options for displaying compilation information.
The -compiler parameter displays a summary of the compiler operation (5003 is the process ID):
% jstat -compiler 5003 Compiled Failed Invalid Time FailedType FailedMethod 206 0 0 1.97 0
This command also displays the number of methods that failed to compile and the name of the last such method.
The -printcompilation parameter prints information about the last compiled method. Combined with the second parameter, the repetition period of the operation, you can observe the compilation process over time. The following example runs the -printcompilation command every second (1000ms):
% jstat -printcompilation 5003 1000 Compiled Size Type Method 207 64 1 java/lang/CharacterDataLatin1 toUpperCase 208 5 1 java/math/BigDecimal$StringBuilderHelper getCharArray
Plans for the second part
In the next part, we will look at the counter thresholds at which the JVM starts compiling and how you can change them. We will also look at how the JVM chooses the number of compiler threads, how you can change it, and when you should do it. Finally, let's take a quick look at some of the optimizations performed by the JIT compiler.
References and links
- Java Performance: In-Depth Advice for Tuning and Programming Java 8, 11, and Beyond, Scott Oaks. ISBN: 978-1-492-05611-9.
- Optimizing Java: Practical Techniques for Improving JVM Application Performance, Benjamin J. Evans, James Gough, and Chris Newland. ISBN: 978-1-492-02579-5.
- JEP 197: Segmented Code Cache
- The Java HotSpotTM Virtual Machine Client Compiler: Technology and Application