
Sometimes the time-out process takes days to weeks before the true root causes can be identified and addressed. Speeding up this process by just a few hours will already significantly reduce losses. To illustrate a presentation on how engineers are solving a problem, let's take a look at synthetic data from just 20 sensors below. There are two sensors in this graph that are statistically strong, and let's say one of them is the real root cause of trip events.
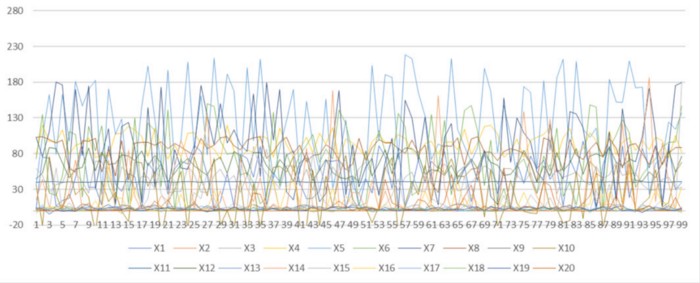
Synthetic data for simulating plant sensor readings
Unfortunately, looking at the graph, it is difficult to determine which two of the sensors are connected, right? Since a small oil and gas plant has 1,000 to 3,000 sensors, this is one of the real bottlenecks for O&M engineers (myself included) in identifying such sensors and root causes. Remember, millions of dollars can be saved if we can find that relationship faster.
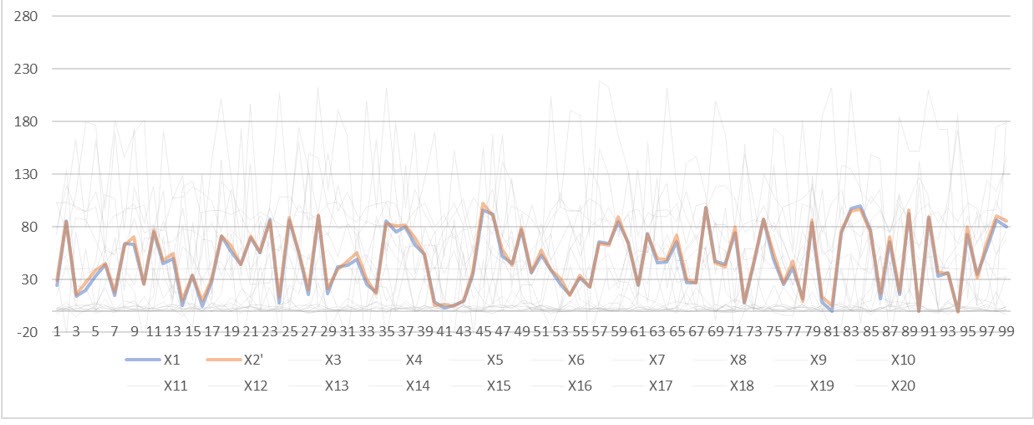
Two statistically related sensors out of 20 other common sensors
I will share with you two techniques that we have tried and found an acceptable level of success to reveal the relationship between these two matching sensors among others. But first, let me explain why this is important for engineers and operators.
First, for any outage event in a modern oil and gas plant, it is true that the control room has a sophisticated control system that can display the "first lockout" mark. This is the “first label” of the sensor that triggers the trip event (eg high-high compressor outlet pressure alarm, low-low alarm at critical separator).
Importance
This first blockage sensor is very important for O&M engineers to begin investigating potential root causes of plant shutdowns. In most cases, engineers and operators can solve the plant shutdown problem simply by looking at this first lockout mark. However, in many cases, this will not do us much, since oil and gas processing is so complex that the appearance of this first blockage mark is the last thing to happen, whereas we want to know what happened before it was triggered.
First solution: hierarchical clustering
Once we examine the first blockage sensor and the amount of time before the shutdown event, we can use this information to perform a clustering method to determine which sensors behave in the same way as the first blockage sensors. We believe that hierarchical clustering and dendrogram generation is a useful visualization approach that can provide information to a non-data science user. An example is shown in the figure below.
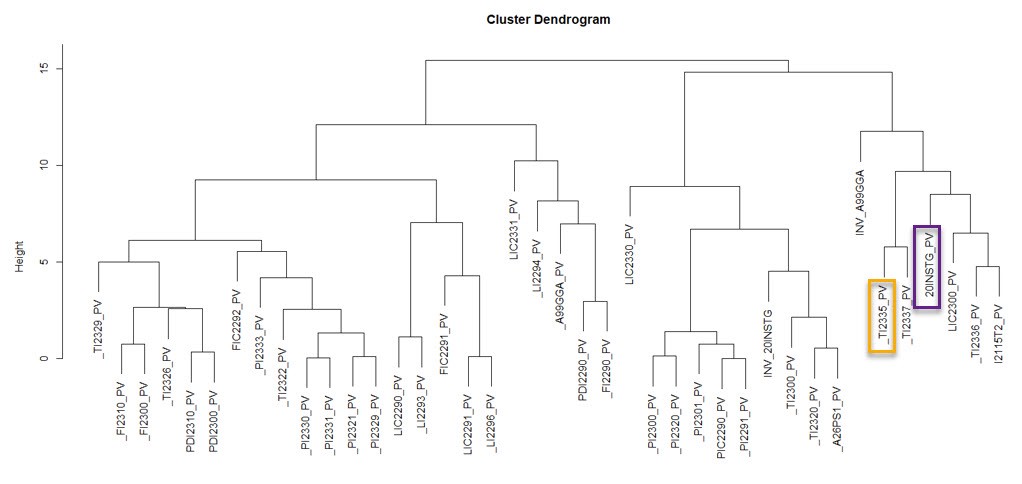
Dendrogram clustering by hierarchical clustering method
This method is not only useful in finding the root cause of an unplanned outage, but it can also be used to find any associated sensors that are behaving differently than they normally would. For example, suppose that the TI2335 sensor is showing an unknown temperature rise in the suction scrubber, and we want to find out what the root cause of the abnormal rise is. We can use this method to find the appropriate sensors to look at. Instead of searching among 1000-3000 sensors, engineers can only focus on sensors that are close to abnormal sensors or the first blocking sensors. Then the troubleshooting time can be significantly reduced. Unfortunately, this method is not applicable in all cases. So we tried some other methods.
Second solution: Granger causality test

Sir Clive Granger
The Granger Causality Test is a statistical hypothesis test for determining whether one time series dataset is useful for predicting another series. It was published by Sir Clive Granger in 1969 and received the Nobel Prize in 2003 for his work.
When an economist collects statistics and turns them into variables, one common problem arises. He cannot determine which variable is independent and which is dependent. In other words, we do not know which factor is causing the other factor.
An example is clearer: when economists are trying to find a relationship between gross domestic production (GDP) and the stock index. When the economy is flourishing, the GDP and the stock index also rise. When a country's economy is in decline, the GDP and stock index will also decline. However, one thing causes another. Some argue that GDP should be the independent variable because it reflects real domestic production and consumption. On the contrary, others believe that the higher the stock index, the more investors will invest in the country's economy, as this is the reliability that investors always pay attention to. This problem leads to a completely different financial strategy of the country - to invest in the development of the local economy or in the development of the stock market.

Granger Cause-Effect Test Sir Granger was able to come up with a statistical way to test whether one variable affects another, whether it is one direction or two, so he won the Nobel Prize for that. When a problem like this occurs, someone can use this test to check for other strange problems; for example, to find out which came before: the chicken or the egg, in Thurman and Fischer (1988).
Although our problem is not as bizarre as the ones described above, when I tried to use the Granger causal test in our problem. That is, using this test, you can weed out some sensors that are not related to each other and rank the related sensors using the obtained p-value. For a group of process parameters, the result is quite satisfactory.
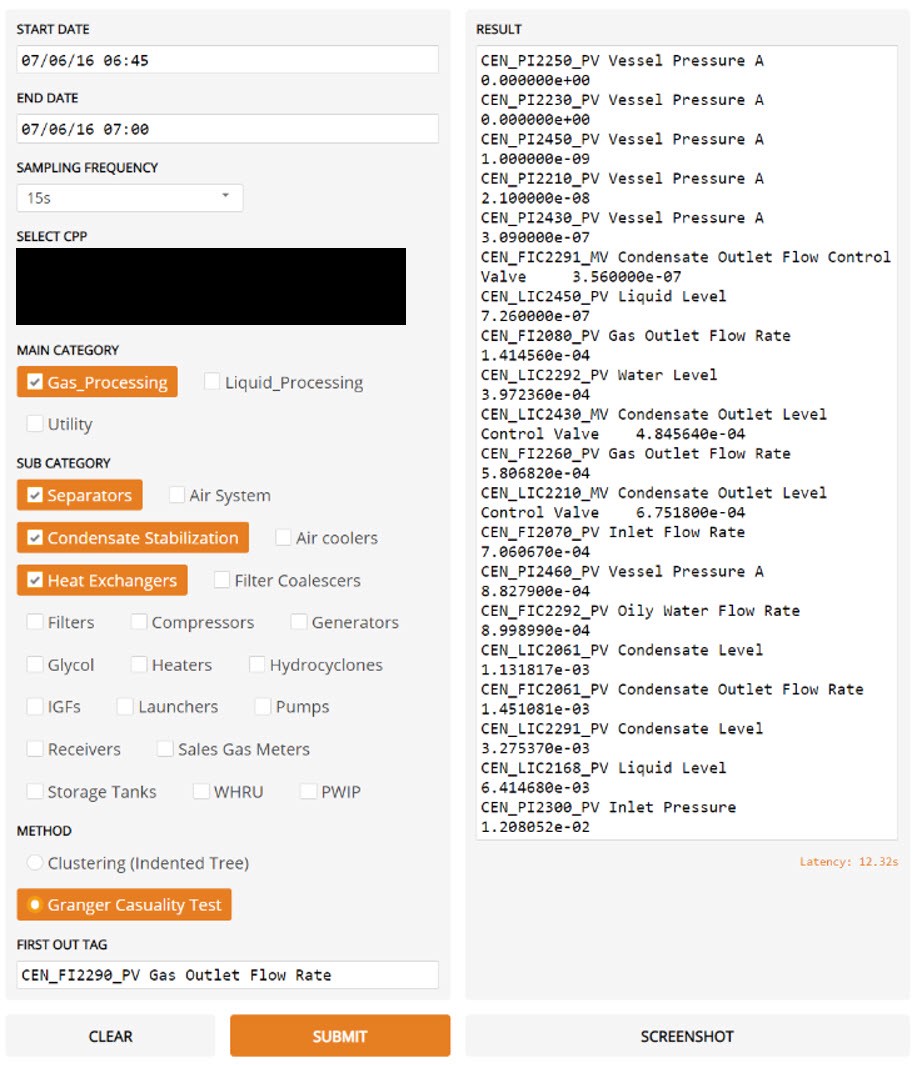
Next, to create a useful GUI for interaction with users who do not have programming skills, we used the Gradio library and created beautiful graphics at the prototyping stage.
Conclusion
So from what I've tried so far, hierarchical clustering works well with the gas processing part, whereas the Granger causal test works well with the liquid processing part. One reason for this is that in a liquid process, by the nature of an incompressible liquid, it usually takes a while for the sensors to respond to a process change. This is not the case in the gas phase.
This is how Data Science methods are applied to solve real-world oil and gas problems. If you have a desire to learn this and apply DS to the project you are currently working on, then we are waiting for you.

Other professions and courses
PROFESSION
COURSES
- Java developer profession
- Frontend developer profession
- Profession Ethical hacker
- C ++ developer profession
- Profession Unity Game Developer
- The profession of iOS developer from scratch
- Profession Android developer from scratch
- Profession Web developer
COURSES
- Machine Learning Course
- Advanced Course "Machine Learning Pro + Deep Learning"
- Python for Web Development Course
- JavaScript
- « Machine Learning Data Science»
- DevOps