Let's continue the topic of decoding different types of radio signals. One of the interesting formats developed in the last century is APT (Automatic Picture Transmission). It is used to transmit images of the Earth from space, and what is much more interesting and relevant for us, receiving APT signals is simple and accessible to radio amateurs.

Satellite NOAA © en.wikipedia.org/wiki/NOAA-15
For those who are interested, the continuation under the cut.
general information
The NOAA meteorological satellites of interest to us belong to the TIROS (Television InfraRed Observation Satellite) series , the first of which was launched back in 1960.There are currently 3 satellites in operation (NOAA-15, NOAA-18 and NOAA-19, the oldest of which, NOAA -15 works since 1998). The satellites revolve around the Earth at an altitude of 850 km and make one revolution in about 1.5 hours. There are various sensors on board, but we will be interested in receiving meteorological images. And there are two options. The simplest and most widely available is an analog signal of the already mentioned APT format at a frequency of 137 MHz. In addition, satellites also transmit images in high-resolution HRPT format(High-resolution Picture Transmission) at 1.7 GHz. HRPT decoders are available, but a rotatable antenna with good gain is already desirable for reception, which is more difficult and expensive.
According to international conventions, all meteorological data is open, and anyone can receive NOAA signals. What we are going to do now.
There have already been several articles on the reception of NOAA signals on Habré (for example, 1 , 2 ), but they usually all boil down to "plugged in the receiver, run the program, got a picture", without much explanation of how this picture is transmitted. Let's try to go down one level and see how the signal works inside.
Reception
The very first and most obvious. The satellite is not geostationary, it moves across the sky, so the reception time must be “caught”. The simplest thing is to use the n2yo.com online service, which allows you to calculate the time of flight for any satellite. Here is an example for NOAA 19 :
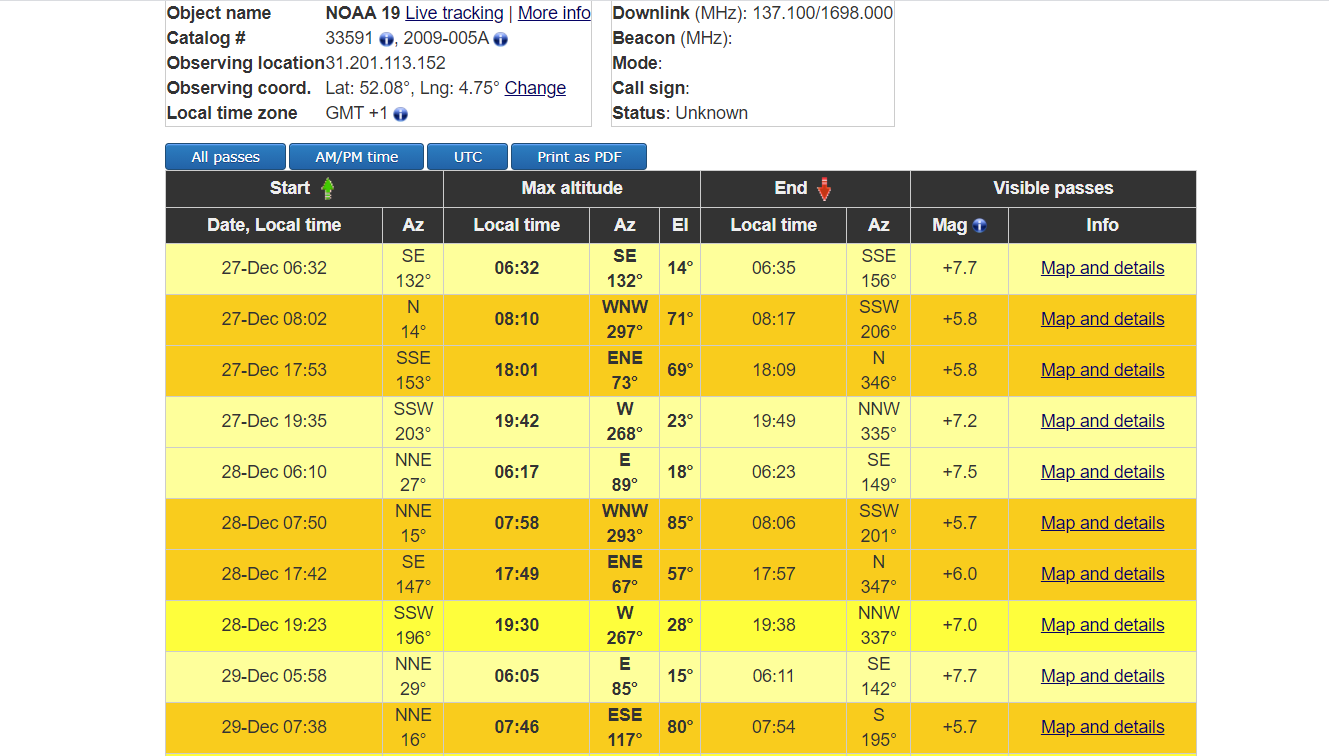
Good reception, when the satellite is high above the horizon, about once a day, the satellite itself over the sky takes about 10 minutes, so it may be helpful to set up a scheduled recording at the right time.
Of course, you need a receiver to receive the radio signal. The cheapest RTL-SDR V3 at $ 35 will do, I used a better quality SDRPlay with the following settings:
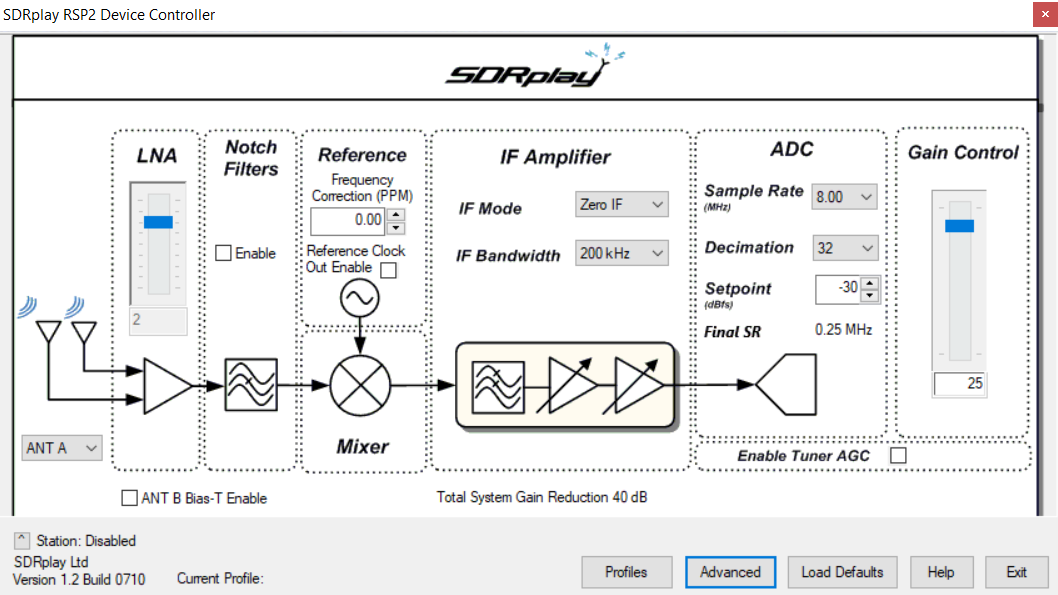
As you can see, I have set the decimation value to maximum, which allows me to get the maximum dynamic range. The LNA and Gain gain levels should be selected depending on the antenna. NOAA satellites 15, 18 and 19 transmit signals on frequencies of 137.620, 137.9125 and 137.100 MHz, respectively. The signal itself has a bandwidth of about 50 kHz, and if everything was done correctly, at a given time the signal should appear on the spectrum:

It is interesting to note the slope of the lines due to the Doppler effect - the satellite is flying past us, and taking into account the time of flight, this is another good proof of the sphericity of the Earth;)
Speaking of reception, the great thing about NOAA satellites is that reception is very affordable for beginners. The signal will, in principle, be heard on any antenna, even on the "mustache" from the TV, but for a good picture the quality of the antenna is very critical. With a bad antenna (like mine :) the picture will be less contrasting, but this is enough to demonstrate the decoder's operation. A dedicated 137 MHz antenna can be purchased or made from plumbing and copper pipes, an example can be viewed here . However, the topic of the article is still signal processing, and not carpentry, those who wish can study the topic of building antennas on their own.
So, we look at the time of flight of the satellite, select the FM recording mode in the program with a bandwidth of 50 KHz and record the signal. The result should be a WAV file of about 10 minutes in length, and the periodic pulses should be clearly audible. Now you can start decoding.
Decoding
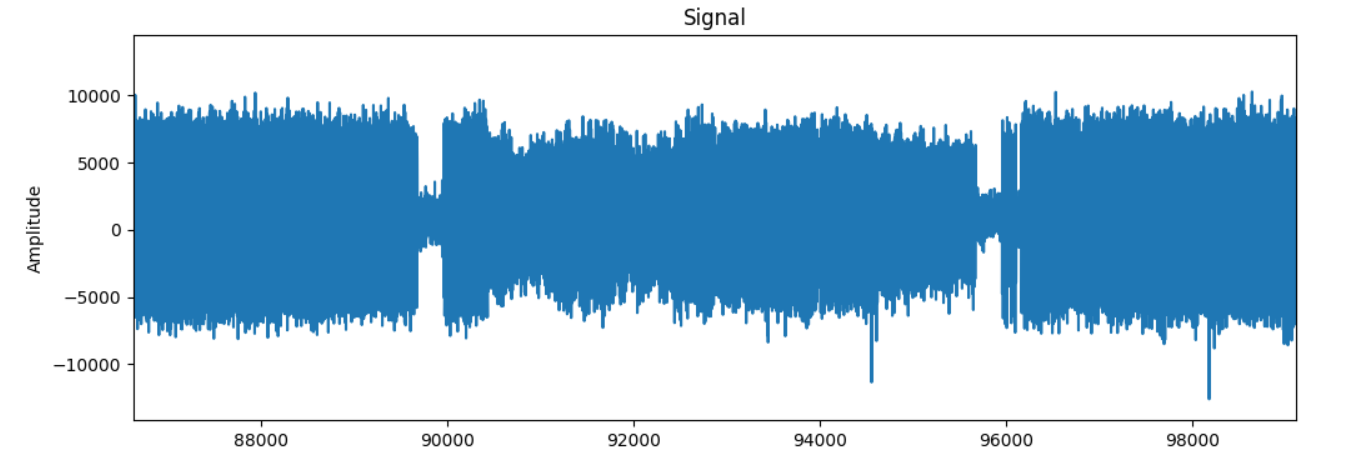
Step 1 . Let's load the file using the scipy library and display it on the screen. I only display a fragment from 20 to 21 seconds, otherwise rendering will be too long.
import scipy.io.wavfile as wav
import scipy.signal as signal
import numpy as np
import matplotlib.pyplot as plt
fs, data = wav.read('HDSDR_20201227_070306Z_137100kHz_AF.wav')
data_crop = data[20*fs:21*fs]
plt.figure(figsize=(12,4))
plt.plot(data_crop)
plt.xlabel("Samples")
plt.ylabel("Amplitude")
plt.title("Signal")
plt.show()
A clear signal periodicity should be visible:
Step 2 . To speed up decoding, let's reduce the sampling rate by 4 times, discarding unnecessary values:
resample = 4
data = data[::resample]
fs = fs//resample
Step 3 . The image is transmitted in amplitude modulation, for conversion to AM, it is enough to apply the Hilbert transform:
def hilbert(data):
analytical_signal = signal.hilbert(data)
amplitude_envelope = np.abs(analytical_signal)
return amplitude_envelope
data_am = hilbert(data)
You can display the picture on the screen and make sure that we have received the signal envelope:

Step 4 . Conclusion. Actually, the decoding is already finished. The data itself is transmitted in analog format, so the color of the pixel depends on the signal level. We can "unfold" the picture into a 2D image, from the format description it is known that one line is transmitted in 0.5 s:
from PIL import Image
frame_width = int(0.5*fs)
w, h = frame_width, data_am.shape[0]//frame_width
image = Image.new('RGB', (w, h))
px, py = 0, 0
for p in range(data_am.shape[0]):
lum = int(data_am[p]//32 - 32)
if lum < 0: lum = 0
if lum > 255: lum = 255
image.putpixel((px, py), (0, lum, 0))
px += 1
if px >= w:
if (py % 50) == 0:
print(f"Line saved {py} of {h}")
px = 0
py += 1
if py >= h:
break
The putpixel function is not the fastest way to work with images, and the code can be accelerated 10 times using numpy.reshape and Image.fromarray, but the line-by-line method is more descriptive. To convert the signal amplitude to the brightness range 0..255, the values are divided by 32, for another antenna the value may have to be changed.
For ease of viewing, stretch the image vertically and display it on the screen:
image = image.resize((w, 4*h))
plt.imshow(image)
plt.show()
If everything was done correctly, we should get an image something like this:
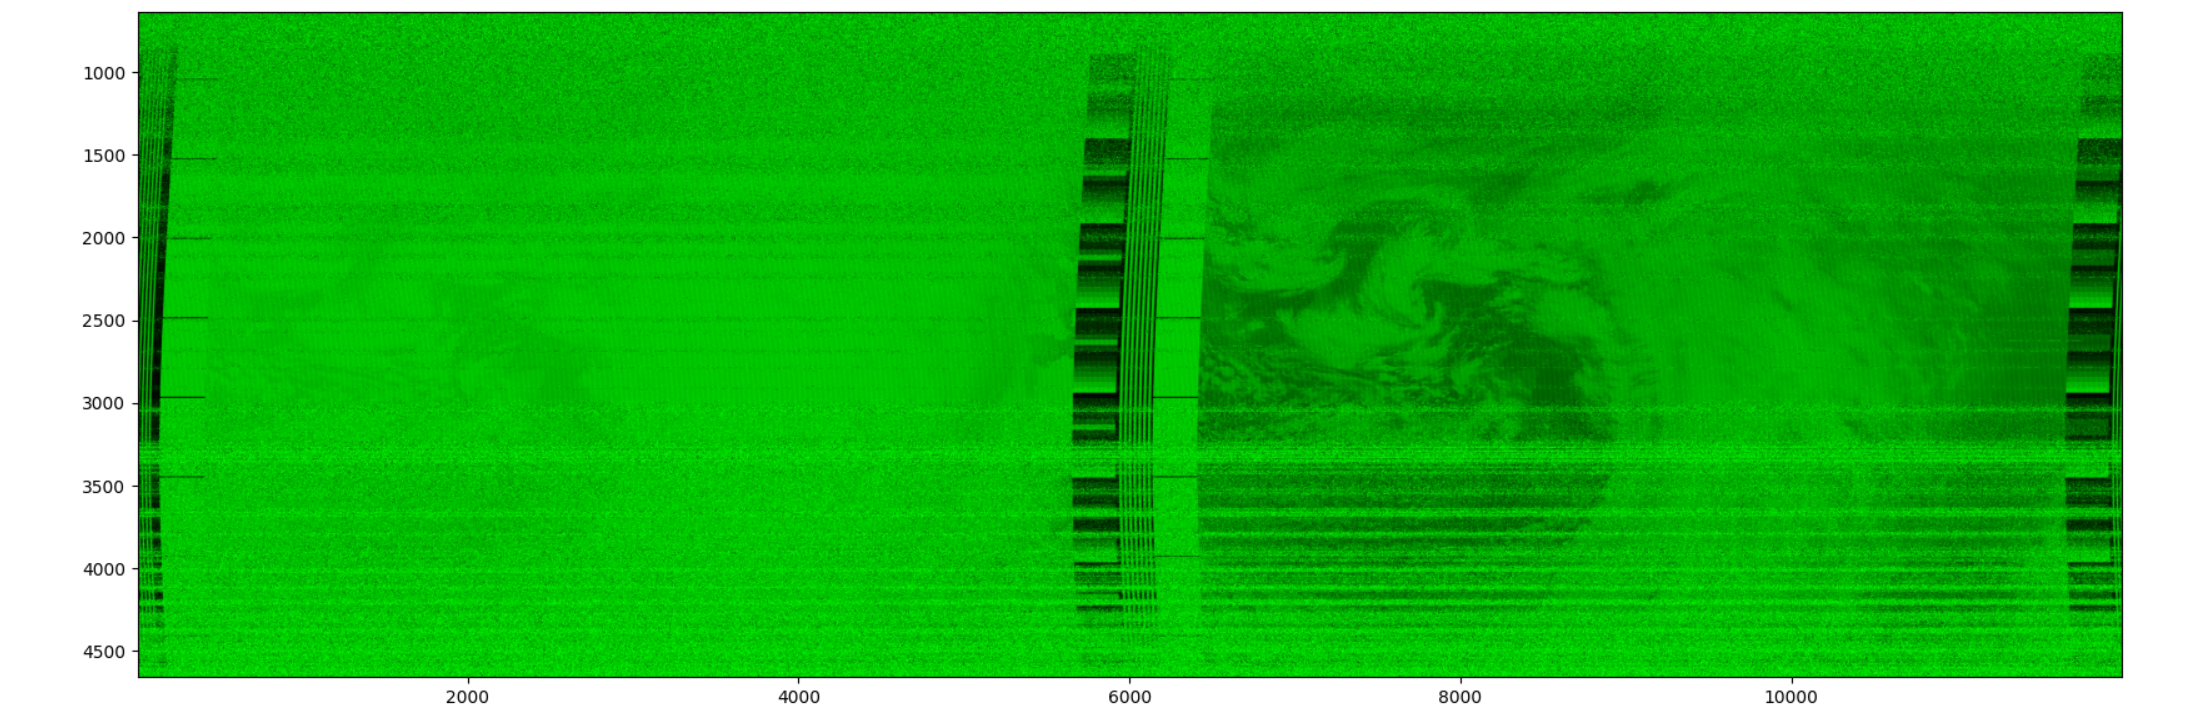
Warm and lamp green was chosen just for beauty, those who wish can change the color gamut at their discretion by changing the parameters of the putpixel function. What do we see on the screen? In APT format, two channels are transmitted. Far IR is transmitted on one half of the frame, near / middle IR is transmitted to the other, the mode is selected depending on whether the satellite transmits a night or day picture. The image also contains synchronization and telemetry markers, those who wish can see the description of the APT formatin details. More advanced programs use these markers to flatten the picture, but may not work on weak signals. The above code never gets out of sync since it is simply not there, even the weakest and noisiest signal will be visible, albeit with less contrast.
Conclusion
As mentioned earlier, there are not so many effective communication systems in the world, the signal of which can be decoded using 20 lines of code. The NOAA satellites are about 20 years old, and when they fail, the new format will most likely be digital and more complex (edit - as suggested in the comments, the new Meteor-M2 is already transmitting data in digital at 137 MHz). So those who want to try something simple and uncomplicated to decode can be advised to hurry up.
Of course, optionally NOAA decode signals only in this way, there are ready-decoders, which have used formore possibilities, such as drawing the outlines of countries and cities, forming pseudo colors from monochrome channels, etc. But it is much more interesting to do it yourself from scratch.
As usual, good luck to everyone.