
The network is the foundation for distributed applications. A distributed application has several microservices, each of which runs on a set of Pods, often located on different Nodes. Problem areas in a distributed application can be at the network level (Flow, network logs), or at the level of unavailability of application resources (Metrics) or unavailability of components (tracing).
Connectivity at the network layer can be influenced by various factors such as routing settings, IP pooling, network policies, etc. When service A cannot communicate with service B over the network, or an external application cannot connect to service A, network logs become an important source of data for troubleshooting connectivity problems. As with a traditional network, network logs allow cluster administrators to monitor the Kubernetes microservice network.

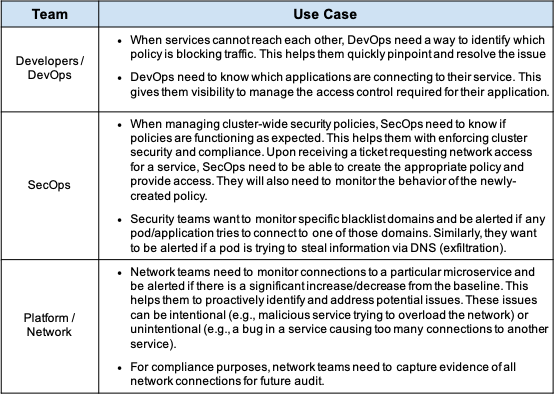
Network Logs Have Multiple Use Cases
Network logs can be used to fulfill the unique requirements of different teams (DevOps, SecOps, Platform, Network). The value of Kubernetes network logs lies in the collected information such as detailed context about the endpoint / endpoint (e.g. pods, labels, namespaces) and network policies deployed when setting up the connection. In an IT environment, DevOps, SecOps, Network, and Platform teams can leverage network logs for their use cases, which are useful in their knowledge domain. Below we show some examples.
Policy Generation and Threat Detection with Data Flow Logs in Calico Enterprise.
Calico Enterprise generates contextual logs of network streams on every connection to the pod. The log is saved to a file on the node, which is then processed by the fluentd agent and sent to the configured destination.

As shown in the above diagram, logs are sent by default to the Elasticsearch engine that ships with Calico Enterprise. You can configure the forwarding of stream logs to your SOC platform. We recommend that you have a single platform for all your magazines. Logs are an essential monitoring and analysis tool for the operations team that already has well-defined processes built on a centralized logging platform. This is important for your planning.
Data Flow Log Characteristics
Stream logs have a lot of storage overhead. By default, Calico Enterprise only stores data from the last seven days. This allows Calico Enterprise to provide features specifically designed to simplify policy development and connectivity troubleshooting in near real time.
- Suggested guidelines for creating policies enable developers to automatically generate network policies to protect their services
- Workflow for policies (recommendation, preview, phased policies) enables SecOps and DevOps teams to efficiently create policies and deploy them in an unobtrusive manner
- Threat detection allows SecOps teams to track each flow to a specific IP address or domain and identify threats
The standard flow log in Calico Enterprise contains all the necessary contextual information:
- Kubernetes context (sub, namespace, labels, policies)
- Sender IP address for external sources, if available via ingress
- Start_time, end_time, action, bytes_in, bytes_out, dest_ip, dest_name, dest_name_aggr, dest_namespace, dest_port, dest_type, dest_labels, reporter, num_flows, num_flows_completed, num_flows_started, http_requests_alrequests, source_name, packin, http_requests_prosallowed source_in, packin, packied source_namespace, source_port, source_type, source_labels, original_source_ips, num_original_source_ips
The DNS log is aggregated for each pod over time and contains the following information:
- Start_time, end_time, type, count, client_ip, client_name, client_name_aggr, client_namespace, client_labels, qname, qtype, qclass, rcode, rrsets, servers
The log entries are available in Kibana as Elasticsearch indexes. You have complete control over indexing parameters, retention time, and storage. Keeping the default settings works well for most deployments.
Reduce operating costs by optimizing thread log storage
Calico Enterprise collects various logs (network / flow, audit, DNS). Stream logs are the most expensive in terms of storage, accounting for over 95% of total storage. Often, for each fully loaded node, there is 5k flow per second. With a modest 200 bytes per flow, this turns into 1 MB / s (megabyte). The daily storage requirement for each node is 86 GB for thread logs. For a cluster of 100 nodes, the daily thread log requirement becomes 8 TB + !!! Obviously this doesn't scale. And more importantly, do you really need to store that much data? Typically, the value of the data contained in the logs decreases exponentially over time and is only relevant for troubleshooting and compliance purposes.
For this reason, Calico Enterprise has aggregation by default, which reduces the thread log storage requirements by over 100 times! We do this without compromising the data (visibility, monitoring, troubleshooting) our clients receive from stream logs. Logs are aggregated by destination port over a specified period of time. This way, you don't need to worry about the cost of storing stream logs when using the default settings in Calico Enterprise. Another way Calico Enterprise can help you lower your storage requirements is by excluding it. You can easily customize specific namespaces or installations that will be excluded from generating stream logs.
Interested in exploring thread logs in depth?
Thread logs are enabled by default. Refer to the following documentation for detailed configuration: