In short, I will say that it emulated a full-fledged, and rather rather big city, in which there was practically everything - from the airport to financial institutions and an amusement park! This gave attackers the opportunity to show their hacking skills, and defenders their skills in detecting and repelling threats.
So, the question arose, how can we “observe” this battle from the point of view of information security? Actually, this article is about the details of the construction of such an observation process and the results we obtained.
We understood that we should not interfere with the operation of the polygon, and that the format of the event does not allow us to engage in detailed adjustment of attack detection profiles, so NTA class solutions (NTA - Network Traffic Analytics) were chosen - these are solutions that identify threats by analyzing network telemetry , or, simply put, the network traffic profile. The implementation of such systems is much simpler and more seamless than, for example, the implementation of classical intrusion detection and prevention systems. This is due to the fact that there is no need to make changes to the network topology, as well as the fact that the core of such systems is machine learning combined with threat intelligence data. This approach allows the system not only to quickly identify typical threats, but also to "learn" over a certain period of time,and then use the knowledge gained to detect abnormal user, system and application behavior. Also, such systems, simply by their approach, are significantly less "noisy" in terms of warning about all kinds of threats and much more accurate in terms of identifying real incidents. On this, I will end a short excursion into this topic, who wants to read more about this, I advise you to pay attention
on this material .
Initially, I decided to use the well-known Cisco Stealthwatch Enterprise product, which is successfully used by many of my colleagues in different organizations. And I was about to call my colleagues at Positive to tell them how many processors, disk space, virtual machines, etc. I need. At that moment, a strange thought came to me - I remembered how many resources, both human and technical, were put into creating this cyber polygon, and I thought that no one expected that I would ask for some of these resources. On the other hand, I did not want to give up the idea, and in the framework of modern trends in the field of information security, I decided to switch to a cloud solution called Stealthwatch Cloud. I must say that this solution is called cloud for a reason, since it can collect and analyze telemetry of private clouds,created inside public clouds through application programming interfaces (API). That is, with the help of this solution, I can analyze, from the point of view of information security, what is happening inside Amazon AWS, Microsoft Azure, Google GCP, as well as Kubernetes containers. But now I needed another application for this product - namely monitoring of private networks. In this case, a sensor (sensor) is simply installed in such a grid, which sends telemetry to the cloud-based monitoring and control console. In the previous sentence I used the word "simple" and now I will try to expand it in more detail.as well as Kubernetes containers. But now I needed another application for this product - namely monitoring of private networks. In this case, a sensor (sensor) is simply installed in such a grid, which sends telemetry to the cloud-based monitoring and control console. In the previous sentence I used the word "simple" and now I will try to expand it in more detail.as well as Kubernetes containers. But now I needed another application for this product - namely monitoring of private networks. In this case, a sensor (sensor) is simply installed in such a grid, which sends telemetry to the cloud-based monitoring and control console. In the previous sentence I used the word "simple" and now I will try to expand it in more detail.
So what does the process look like?
You need to request a trial, it takes a couple of minutes.
Link here .
Then, within a couple of days, various useful letters begin to arrive, and in the end a letter comes about that the portal is activated!
After that, you get yourself a personal portal, the link to which looks like this:
cisco-YOUR_CISCO_USERNAME.obsrvbl.com , for example: cisco-mkader.obsrvbl.com .
Entering there, we see the main screen, from where you can download a sensor virtual machine for monitoring private networks. The requirements for this virtual machine are not great - 2 vCPUs, 2 gigabytes of memory and 32 gigabytes of disk space. In general, the installation process is extremely simple and is described in an unusually simple and convenient manual, made in the form of a scrollable e-book .
I must say right away that the sensor has two interfaces - one serves for communication with the control console and also collects telemetry on itself, for example, NetFlow, and at the same time monitors all traffic coming to it. The second one can work in the mode of capturing packets (promiscuous mode) and generate telemetry on the traffic it caught. In our particular case, we only used the first interface.
After installation, the sensor runs to the cloud where the console is located - this is actually AWS and produces a beautiful message:
{"error":"unknown identity","identity":"185.190.117.34"}
This is the same IP address under which the sensor thinks that it sees itself in the outside world, breaking through a corporate firewall, address translation, etc. Just in case, I will say right away that the sensor needs HTTP and HTTPs, as well as setting up DNS a. After receiving the above message, you just need to take this address and add it to the list of your sensors on the console:
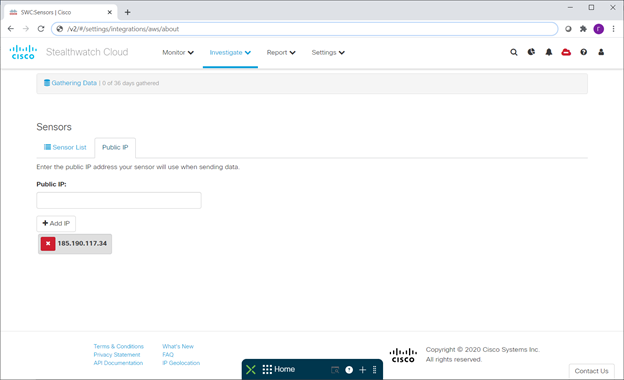
And after a while the sensor turns green - this means that the sensor has established a connection to the console.
And, in general, the launch of the system is completed on this. The next step is to add telemetry sources, in addition to the sensor itself listening. If we want to receive telemetry using the NetFlow protocol, then the site is extremely useful .
On it we can select the network device we need, enter a couple of parameters and get a ready-made configuration:
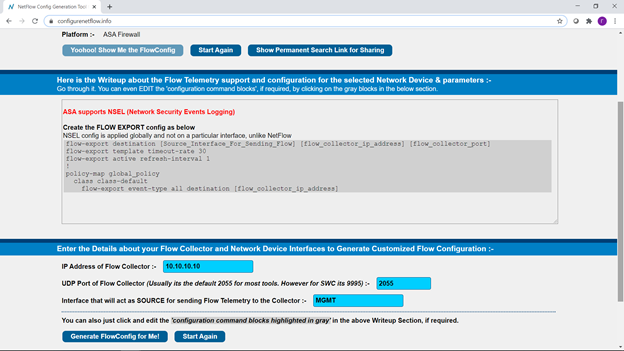
And copy the information received to our network devices. That's it - the system is ready to go! Or rather, it has already started to work.
By the way, examples of Netflow settings from this site can be used not only for Steathwatch, but for any other product that can use such telemetry - for example, Cisco Tetration, IBM QRadar, etc.
Now you can do fine tuning of the system. I want to say right away that I really love to watch how various Cisco information security products inform me about everything that happens on a single Cisco SecureX monitoring and response console. In fact, SecureX is an extremely interesting thing and deserves a separate description. In a nutshell, it is a cloud-based information security monitoring system (SIEM), investigation (Threat Hunting), investigation and response to incidents, and at the same time process automation (SOAR). I highly recommend that you familiarize yourself with this system in more detail, and it is "attached" by default to any Cisco information security product. Well, a little marketing on this topic here .
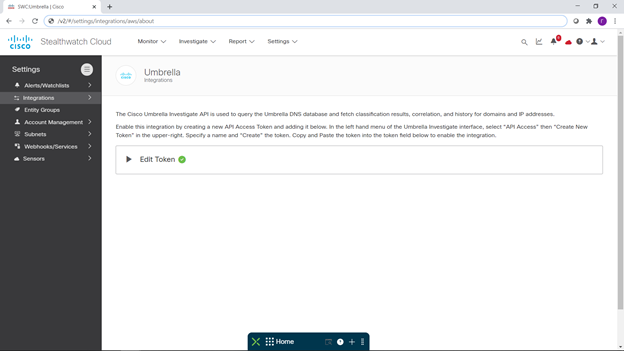
So, first of all, I set up such an integration:

At the same time, I set up integration with our cloud platform for providing security services Cisco Umbrella: https://habr.com/ru/company/jetinfosystems/blog/529174/ .
I did not pin any particular hopes on it, believing that all the most interesting things would happen inside the landfill, and it was not my task to protect this landfill.
After that I created myself a new monitoring console in SecureX. All this took a total of 5 minutes, and maybe even less. A couple of pictures from my SecureX below:


After that, I decided to turn off notifications that were not interesting to me, and turn on interesting ones. To do this, I returned to the SWC console and went to set up these same notifications:
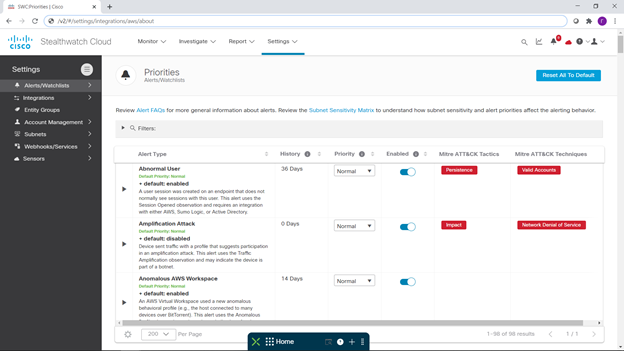
I'll say right away that for each of the notifications you can see what it is, how many days of collecting telemetric information is required to detect the corresponding threat, and how it goes if it goes down, for MITER ATT & CK.
The number of detected threats and related notifications is constantly growing as the solution itself evolves. But I don't really need to think about it - the cloud, as they added something new, is immediately at my disposal.
I disabled most of the notifications related to attacks on AWS, Azure, GCP clouds, since they were not used within this polygon, and turned on all notifications related to attacks on private networks.
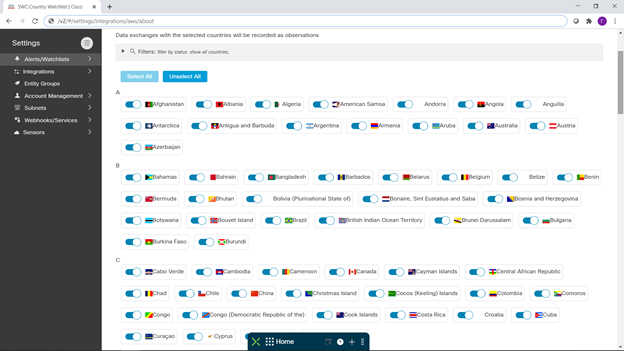
Also, I can manage monitoring policies for different subnets that I want to control. You can separately enable monitoring for the countries of particular interest to us:
At this point I read my text above and realized that it took much longer to write it than it took to configure the system, including all integrations.
Now what have we seen?
In the early days of Standoff, telemetry was given to me by a couple of our virtual ASAv firewalls, but then the number of sources increased slightly - more firewalls were added, as well as Netflow from a central traffic broker.
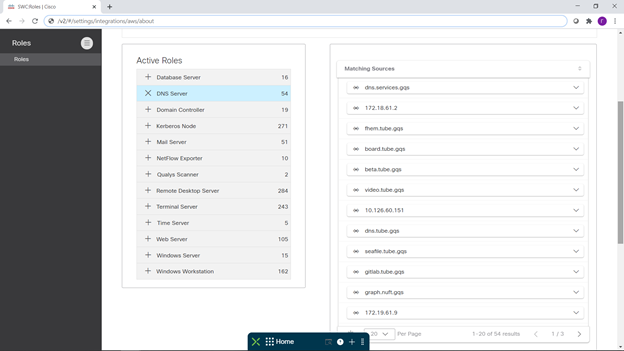
The first notifications came in very quickly and, as you would expect, they were associated with numerous scans. Well, then it became more interesting to watch the process every hour. I will not describe the entire observation process here, but just tell you about a few facts. Firstly, we managed to collect good information about what is what at the test site:

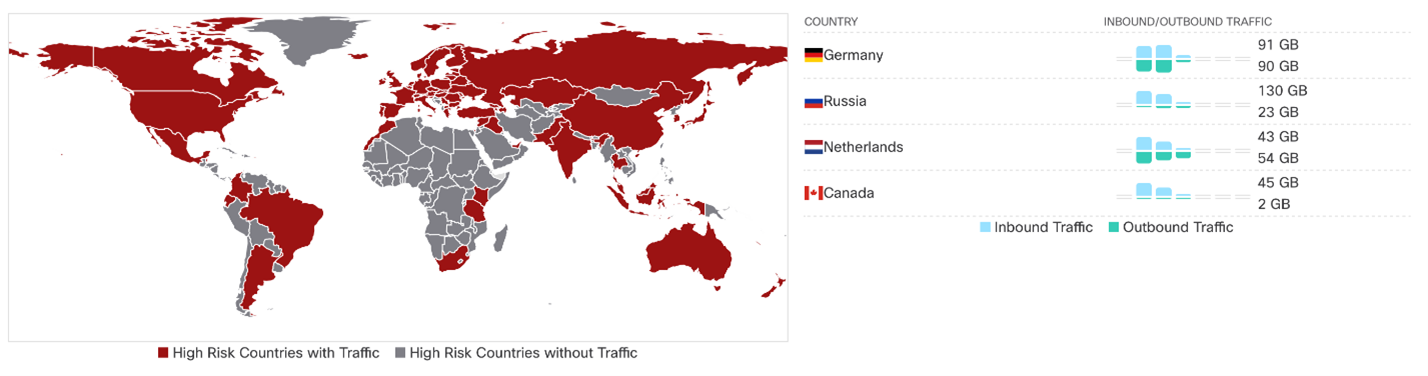
Secondly, to assess the scale of the event - with which countries was the most active traffic exchange:
In fact, there is a more convenient format for presenting this data, but here I decided to show more detail.
So, the main "external", besides Russia, the users of the landfill were the USA, Germany, Holland, Ireland, England, France, Finland, Canada, although there was some interaction with almost all countries, including the countries of South America, Africa and Australia:
Of course, we could see who owns the addresses they saw:

And, if desired, ask about them from other useful analytical sources:

What allowed us to see, for example, active interaction with Microsoft resources in many countries.
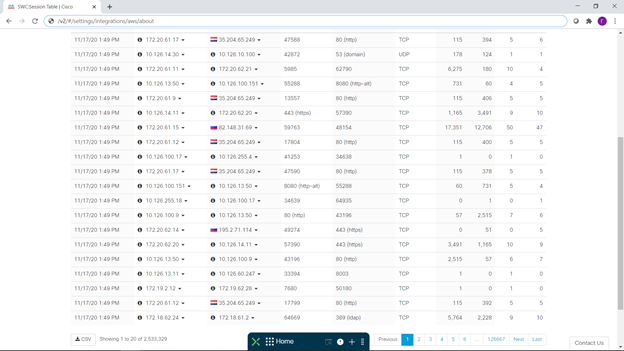
Moreover, the table of the most active interactions could be seen in the form of a dynamic picture of connections with the possibility of its more detailed analysis:
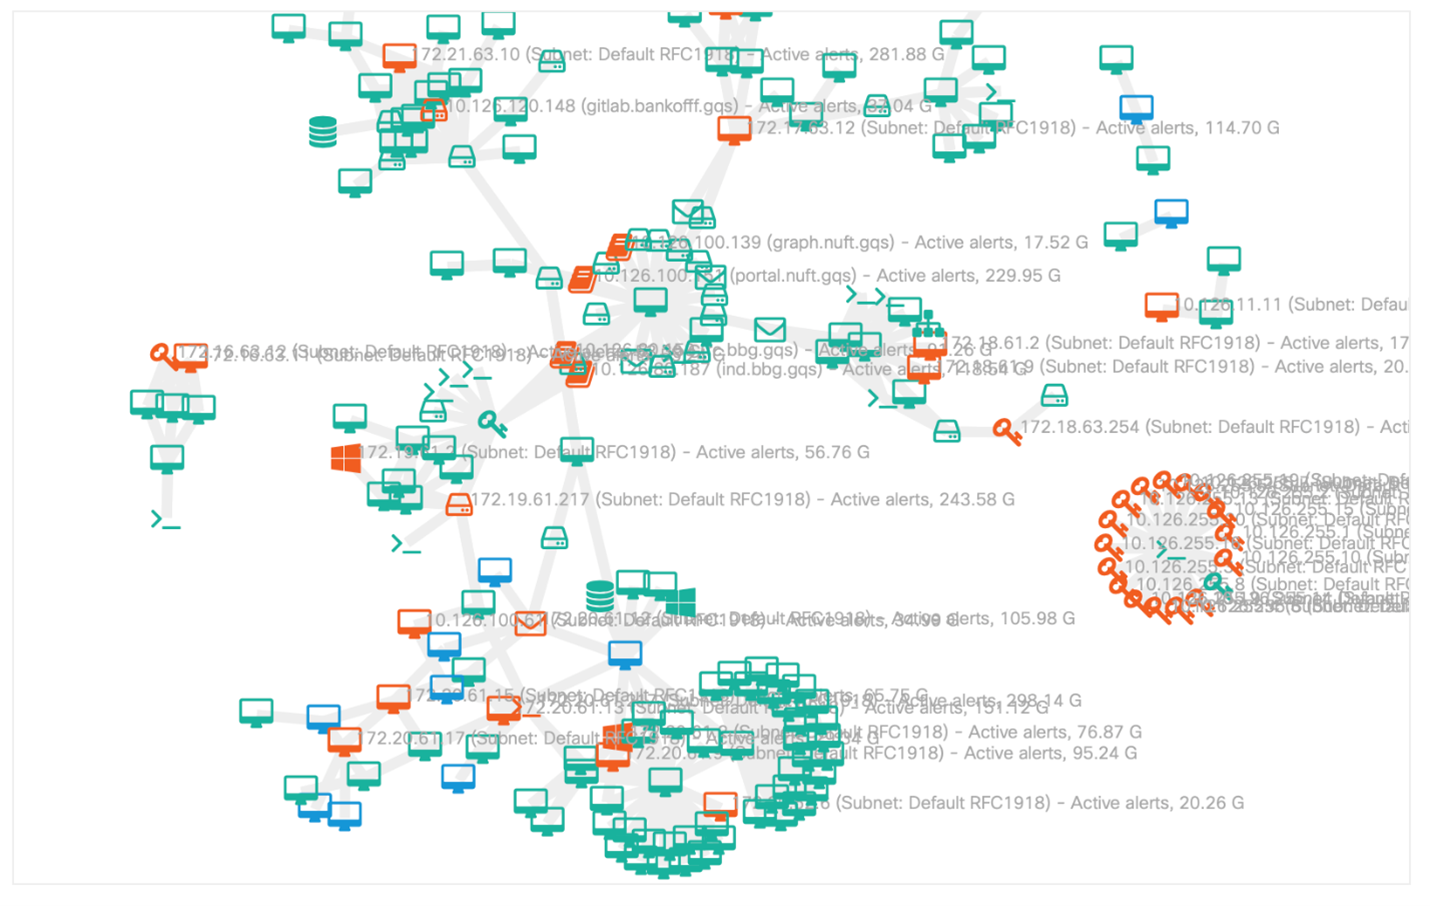
But what have we collected exactly from the point of view of attacks?
The list of notifications tells us about this, some of which you see below:
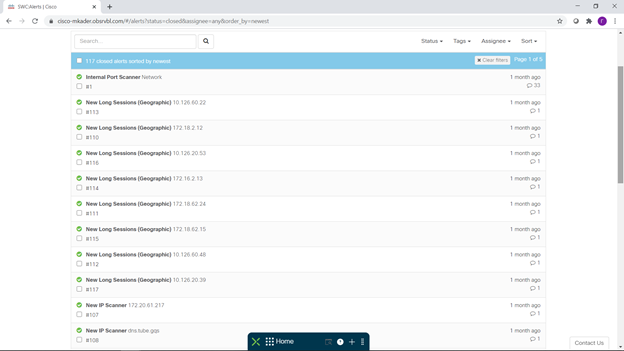
In total, 117 attacks were identified, confirmed by many observations (Observables) We see here network scans, suspicious long sessions, problems with SMB, incorrect use of network ports and services, strange behavior network nodes, unexpected changes in their behavior and other oddities that should alert an information security specialist.
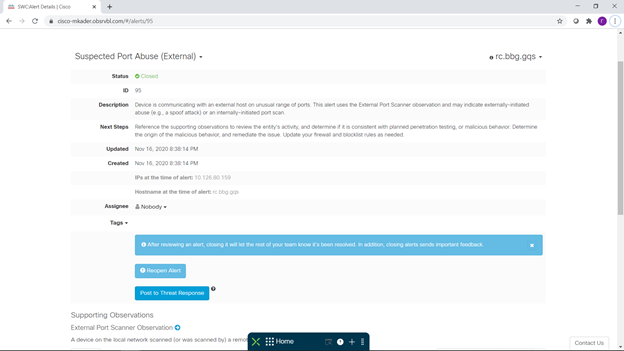
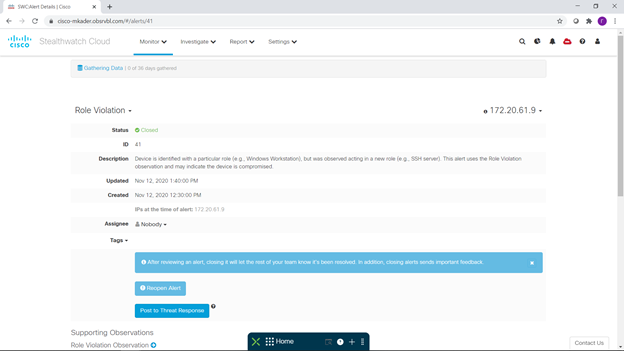
For each event of interest to us, we can get detailed information, including what it is, what it is bad and recommendations for prevention. A couple of such interesting events can be seen below - an unexpected launch of an SSH server on a Windows workstation and the use of a non-standard port range. You can also pay attention to the fact that, with the configured integration, you can go directly from the event description to the SecureX Treat Response investigation console for a detailed analysis of this incident:
So, a few short conclusions based on the results of this small and entertaining pilot.
First, Positive Technologies conducted excellent cyber exercises and it was very interesting to observe them a little "from the inside", and it was convenient, easy and simple.
The second one, which I have to say, cloud security solutions are fast, simple and convenient. And if there are still a lot of them, and you can set up integration between them, it is also very effective.
Third, the participants of the test site also actively used cloud services, for example, services from Microsoft.
Fourth, automated machine analysis of various network telemetry makes it easy to identify information security incidents, including the planned activities of intruders. And I advise you to pay attention to the fact that there are already many well-developed scenarios for the effective use of the Cisco Stealthwatch solution for the needs of information security. Each of the readers can find a script to their liking here .
Well, and a small final comment - in this article I deliberately did not list the received lists of IP addresses, domains, interaction details, etc. in detail, realizing how much effort it took Positive Technologies to assemble this polygon and hoping that it will be useful to them repeatedly and us in the future. And we will not make life easier for future attackers.