Below the cut - a short story about zoom levels: why in the standard form they are not suitable for large areas and how the scale affects the loading of tiles and the appearance of the map.
Zoom-level
To indicate the scale in the 2GIS WebGL map, as in many other maps, a number is used - zoom-level or just zoom. A zoom of zero corresponds to a map scale that fits the whole world into a 256 × 256 px square.
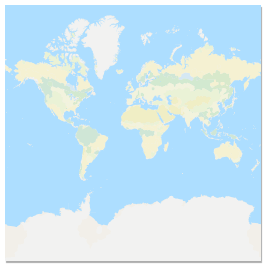
World map at zoom = 0
Zooming in by one unit corresponds to stretching the map twice. At the first zoom, the whole world will be 256 × 2 = 512 px. On the fourth, we get the size 256 × 2 × 2 × 2 × 2 = 4096 px.
This system allows you to designate a range of scales with easy-to-understand numbers. For example, zoom = 11 is about one large city on the screen, zoom = 19 allows you to see buildings and passages between them in detail.
Mercator projection
2GIS maps use the Mercator cartographic projection. A cartographic projection is a way of displaying a spherical surface of the Earth on a flat map.
Since a plane and a ball are not the same thing, any cartographic projection distorts the shape or size of objects. In the Mercator projection, objects at high latitudes on the map appear larger than objects at the equator. Therefore, on such maps, Greenland looks the size of Africa, although in fact its area is 14 times less than the area of Africa. Here you can see how the projection distorts the size of the countries.
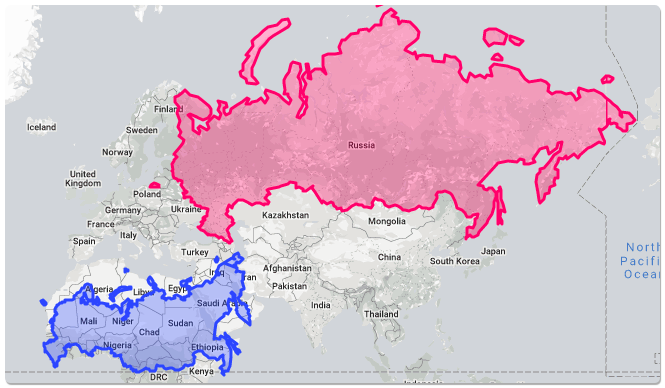
If Russia is brought closer to the equator, its size on the map is significantly reduced
The stretching of objects is proportional to 1 / cos (lat), where lat is the latitude of the object. From this formula it follows that objects at the latitude of St. Petersburg (lat = 60 °) on the map will be stretched twice. And objects at the North or South Poles (lat = 90 °) will stretch indefinitely. That is why poles are never drawn on maps in the Mercator projection - everything north and south of ≈85 ° latitude is cut off on them.
You can read more about the Mercator projection in this visual and fascinating material .
Problems with zoom and Mercator projection
The main problem with zooms follows from the properties of the Mercator projection: the same zoom-level at different latitudes corresponds to different actual map scales.
Let's compare screenshots of the map at the 14th zoom in Murmansk (latitude 69 °) and Tashkent (latitude 41 °).
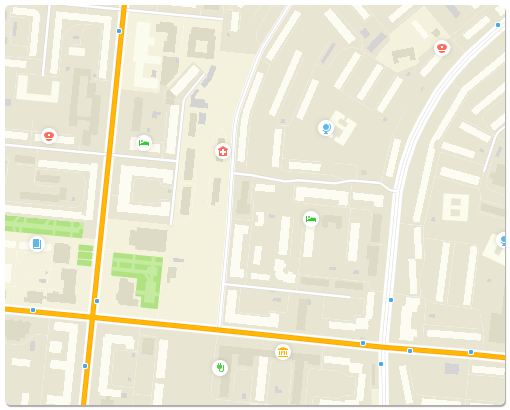
15th zoom in Murmansk
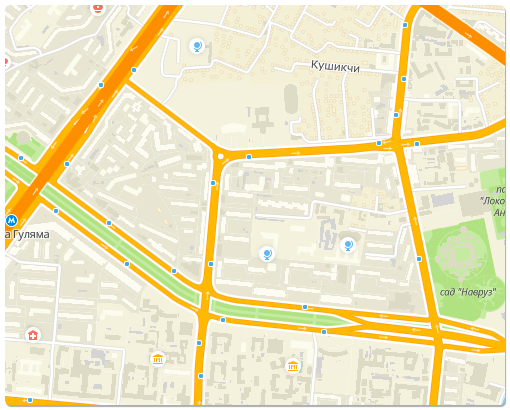
15th zoom in Tashkent You
can see how much the house size differs. In Murmansk, they are large, in Tashkent, the map is shallow.
When styling the map, we want to give it a specific look and feel. To do this, we set the width of the roads in pixels depending on the zoom or the zoom from which we start showing houses. Styles written for one latitude will look very different on another. The meaning inherent in them will be distorted, since the zooms will mean a different actual scale.
Decision
To solve this problem, we introduced the concept of styleZoom, which may differ from the usual zoom.
| Normal zoom | StyleZoom |
| Defines the scaling of objects | Determines which tiles to load |
| Written in url | Determines which scale to apply styles to |
| Used in the familiar getZoom / setZoom methods | Used in the getStyleZoom / setStyleZoom methods |
| Matches bitmap tiles |
styleZoom is calculated from zoom and latitude using the following formula: styleZoom = zoom + log2 (1 / (2 * cos (lat)).
The following styleZoom properties follow from the formula:
- At 60 ° latitude styleZoom = zoom. Since the styles were originally written for Novosibirsk and Moscow, we decided to take this latitude as the base.
- At latitudes <60 ° styleZoom <zoom. At the equator, styleZoom = zoom - 1.
- At latitudes> 60 ° styleZoom> zoom.
Now let's see how Tashkent and Murmansk will look with styleZoom = 15.
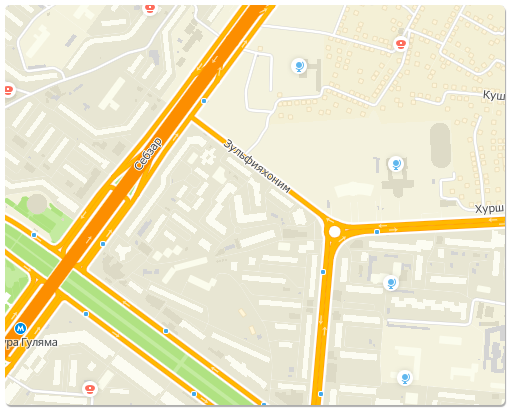
Tashkent, styleZoom = 15 (zoom ≈ 15.59)
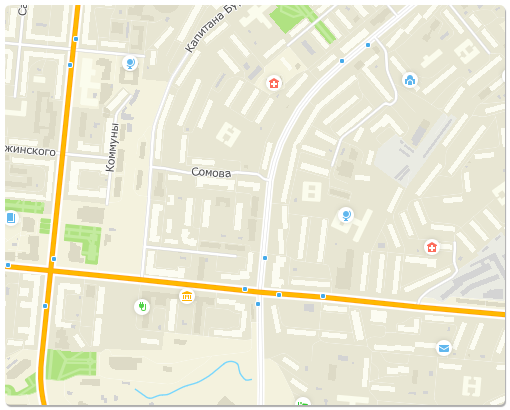
Murmansk, styleZoom = 15 (zoom ≈ 14.53)
It is clearly seen that styleZoom corresponds to the real scale of the map regardless of latitude: visually do not differ in size, the map looks the same in two different cities.
Limitations
The correction mechanism has drawbacks that appear in two scenarios for working with the map.
zoom <9
At small zooms, when the whole world or most of it is visible on the screen, dragging the map up and down leads to large changes in latitude and, accordingly, styleZoom.
While dragging and dropping, this can lead to loading new tiles, switching styles, appearing or disappearing objects, etc. To avoid this effect, at zoom <9 the correction is disabled and styleZoom is set to zoom.
lat> 60 °
At very high latitudes, styleZoom becomes much larger zoom. Since styleZoom is responsible for which tiles to load, it may turn out, for example, that at the 14th zoom we will load and display the tiles of the 16th zoom. The 16th zoom tile is 16 times smaller in area than the 14th zoom tile. And if usually ≈30 tiles fall on the screen, then in this case there will be 480. And the number of tiles greatly affects performance. In order not to load the video card at these latitudes, at lat> 60 ° the correction is disabled, and styleZoom is also set to zoom.
Instead of output
Connect the API of our WebGL maps and design maps for the tasks of your service, without worrying how they will look in different cities.
Special thanks to Lesha Fedosov for the post. Lyokha, hello!