As the year draws to a close, we at JetBrains are rolling out the traditional “steam train” releases for our desktop tools. We have already written about some of them ( WebStorm , DataGrip ) here on Habré. And today it's time to tell you about the update of our cross-platform development environment in C and C ++ - CLion 2020.3!
Briefly about the most important:
- The debugger now has the ability to examine memory dumps and run configuration with administrator privileges. And now you can move the execution point through the code in any direction right during a debugging session.
- For unit testing, we've added support for CTest, a test runner that comes with the CMake design model.
- Qt Qt- UI, , Qt .
- , Makefile, CLion. CMake CMake.
- MISRA C 2012 MISRA C ++ 2008.
- And many other improvements for launch and debug configurations, version control support, and remote development. Various nice UI improvements. And… the long awaited preview of the new collaborative development and pair programming service.
The new version can be downloaded from the website and tried for free for 30 days. If you have an active subscription to CLion or All Products Pack, just update the version to 2020.3. As a reminder, when you purchase an annual subscription for any product, you will receive a backup perpetual license .
Now let's talk about the innovations and improvements in version 2020.3 in more detail.
Debugger
The 2020.3 release marks a major milestone in the development of debugger integrations in CLion. And this is no accident, because this integration is used not by one, but by several of the company's products! CLion, an IntelliJ Rust plugin, and an early preview of the Rider for Unreal Engine game development environment . Together, we were able to implement many important new features in the debugger.
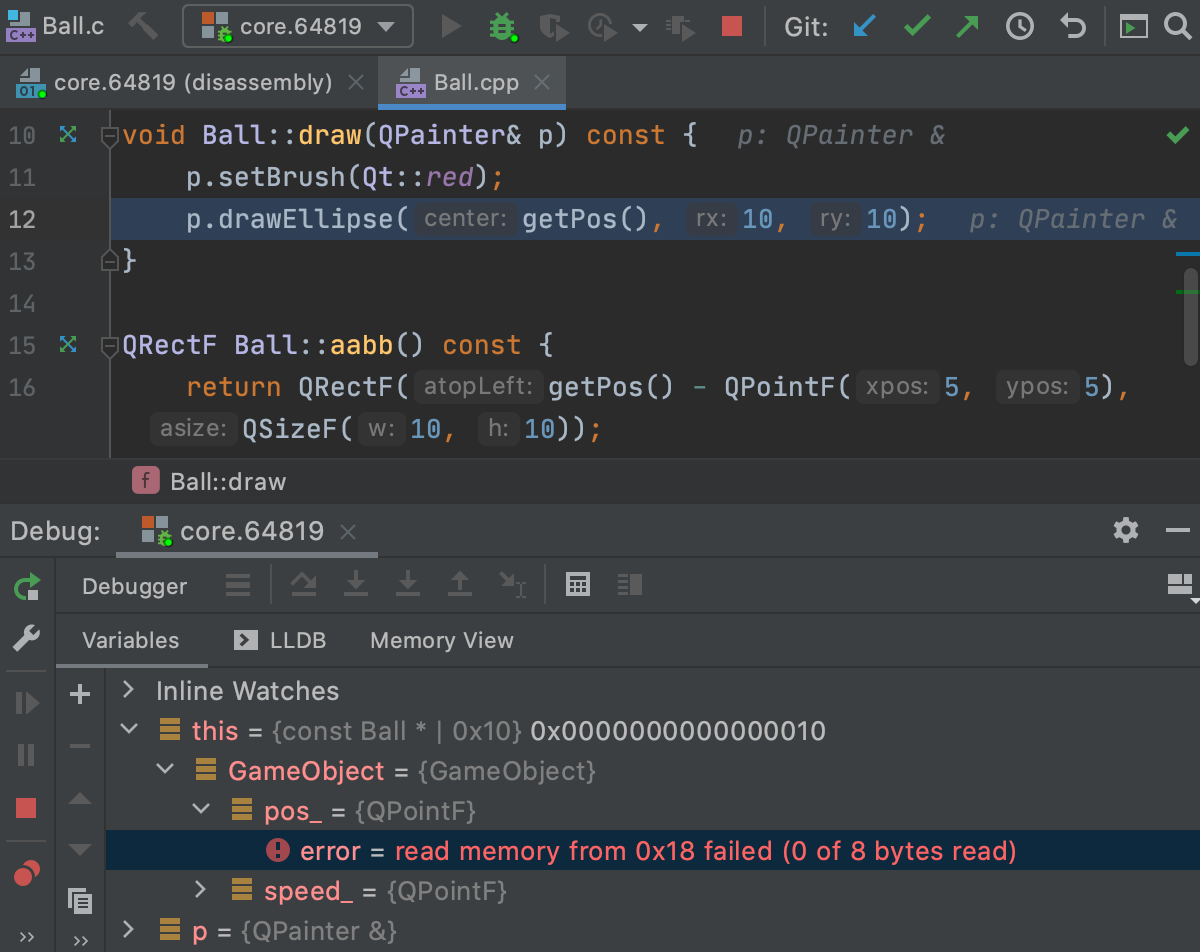
Debugging with memory dumps
The process ended abnormally, in other words, fell, leaving behind a memory dump? New Run Action | Open Core Dump, available for Linux and macOS, will allow you to open a memory dump of a fallen process in CLion for further debugging:
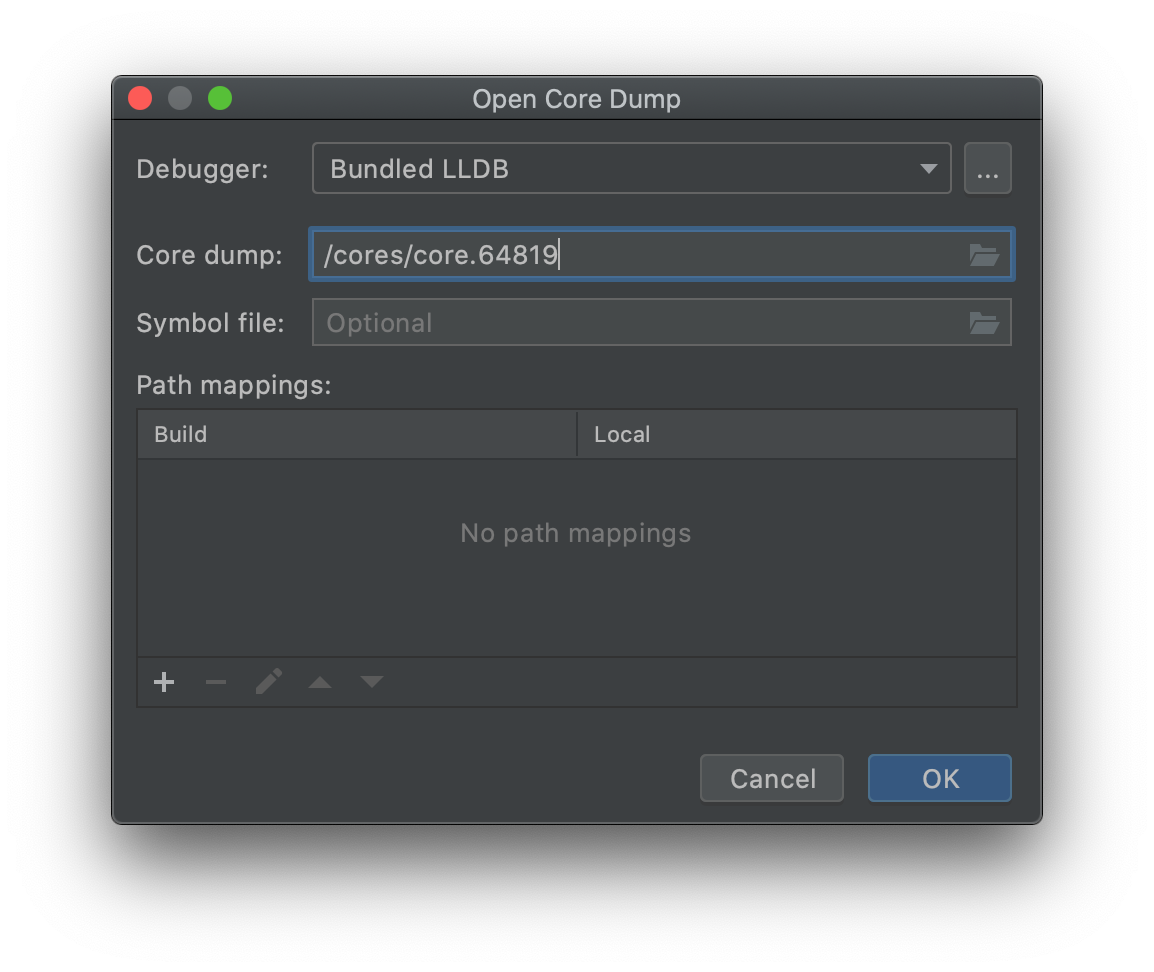
In the dialog you need to specify the path to the memory dump, the path to the file with debugging symbols (for example, the executable file of the program is suitable if the assembly was enabled in debug mode), path matching (if the executable file was built on another machine). CLion will then create a configuration to debug this memory dump that you can run.
The dialog can display a list of already created configurations. Configurations can also be created manually from the Run | Edit Configurations. During debugging with a memory dump, you can analyze information about frames, examine the values of variables, view the state of memory and assembler code, evaluate expressions, and run commands from the debugger console. At the same time, for obvious reasons, step-by-step debugging is disabled and the process output window is not available.
Among the current limitations, in addition to the unavailability of the new function on the Windows platform, it is worth noting that in the case of LLDB, the file with debug symbols is not used yet. And the possibilities for debugging dumps collected on another machine and remote debugging of dumps are very limited ( CPP-22736 , CPP-22656 ).
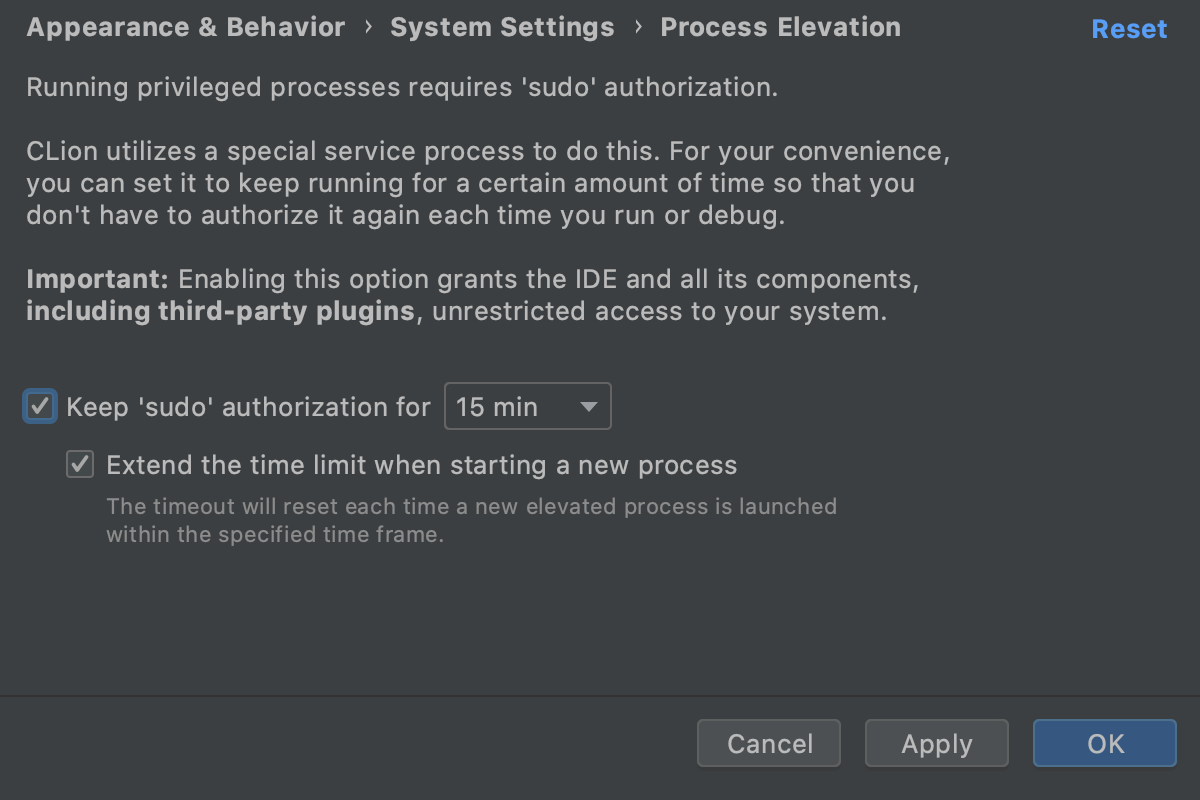
Run and Debug with Administrator Privileges
A new checkbox has appeared in the launch and debug configurations from this release - to launch the configuration with administrator privileges. Customization is supported for many types of configurations: CMake, Makefile, Gradle Native, Custom Build, CTest.
To use the new feature more conveniently in practice, we wrote a special daemon that prompts you to remain logged in as an administrator when running such configurations for a selected period of time:
Read more about how this new feature works here (in English).
Setting the execution point
Visual Studio users may be familiar with a useful feature such as changing the execution point during a debugging session. For everyone else: imagine that you want to skip the execution of an entire loop, change the branch of a conditional statement, go back a few steps in the flow of program execution right during a debugging session. Now, CLion has a new action Set Execution Point to Cursor for this , or you can manually rearrange the yellow arrow to the desired line right in the editor:
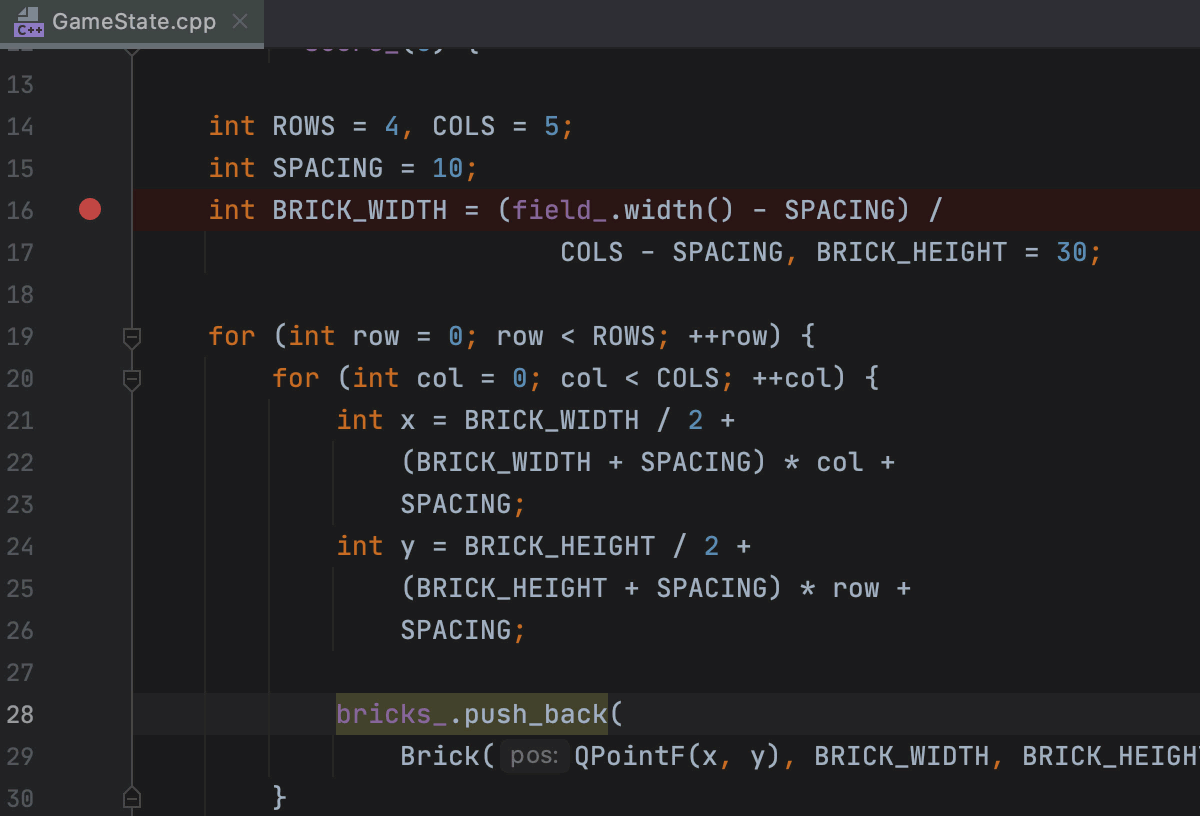
Let's make a reservation that such an action can break the program (for example, if you miss the command to initialize a variable). But if used skillfully, it will allow you to debug your application very efficiently.
Interactive tips
Virtually all of our IntelliJ-based IDEs have interactive tips and built-in watches in version 2020.3. Even before 2020.3, during a debugging session, you could see the values of variables right in the editor. Now these tips have become interactive - you can expand the variable and see the value of all its fields: You
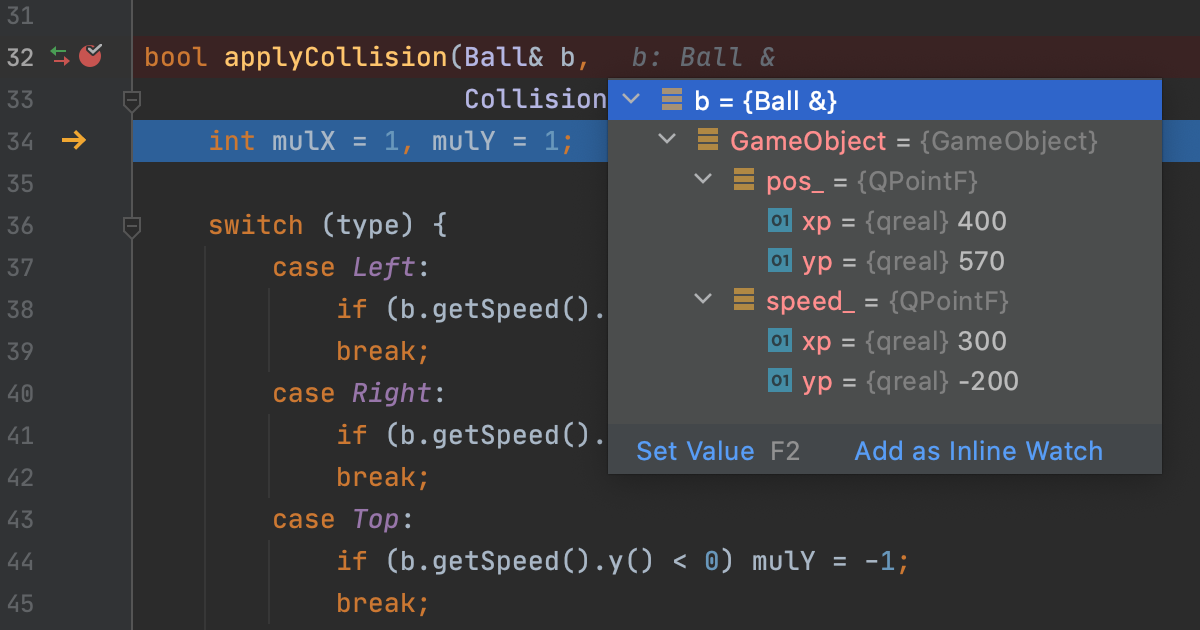
can also add an arbitrary expression for counting and viewing right in the editor (next to the required line of code). This turns out to be more convenient than ordinary watches (which are constantly shown in the debugger window) when the variables used in the expression have meaning only in a specific place in the code (for example, local variables).
Want to see the new features in action? Try it yourself or watch this video from our developer-lawyer:
Unit testing
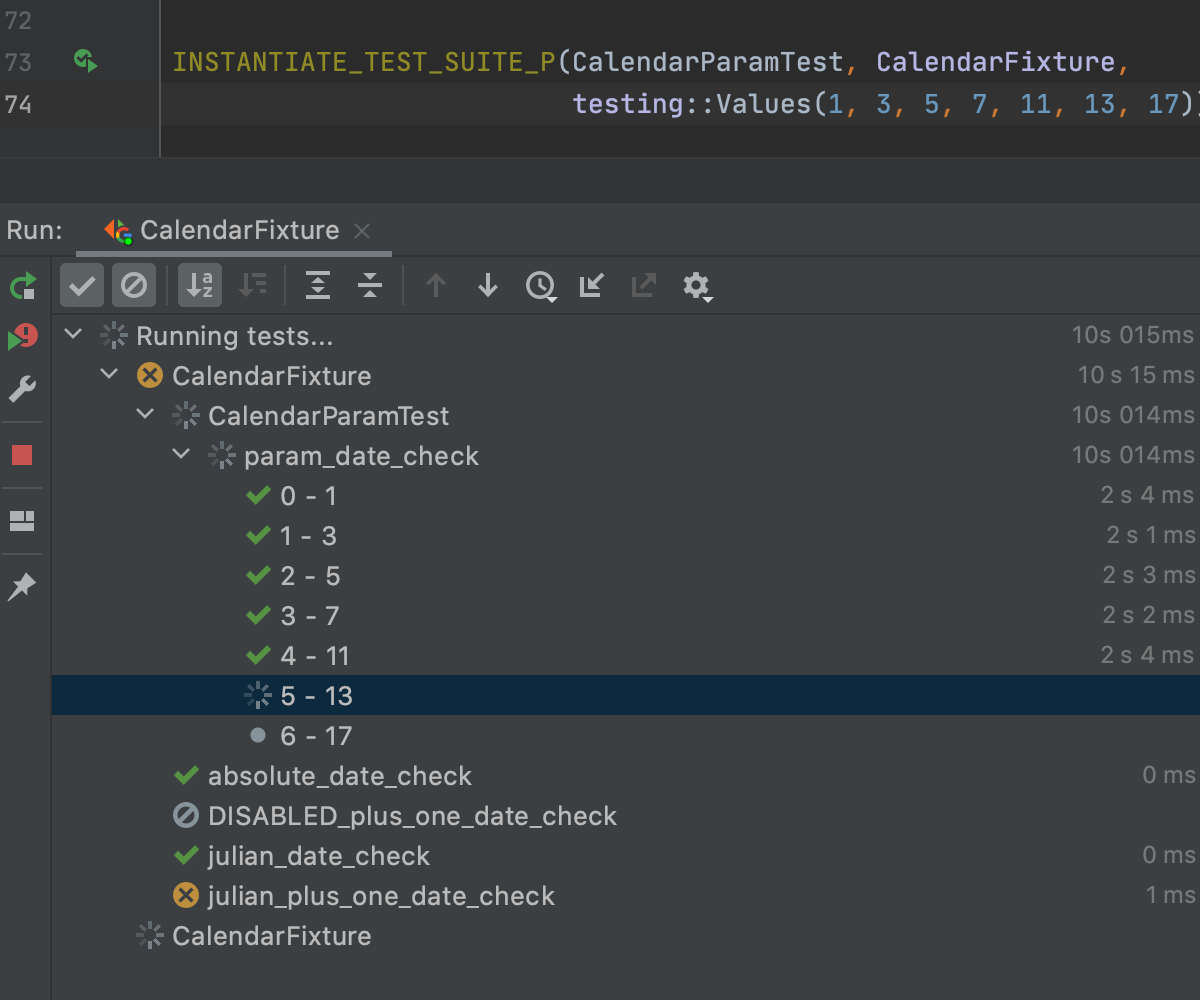
In terms of unit testing frameworks, CLion supports Google Test, Catch (2), Boost.Test, and doctest. According to our 2020 Development Ecosystem Survey, 31% of C ++ developers use Google Test. Therefore, we took the time to improve the presentation of Google Test run results in CLion:
- We learned how to build a test tree right away, even before all the tests are executed.
- Started displaying test parameter values (for parameterized tests).
- We introduced a special icon to mark disabled (DISABLED) tests in the tree.
- And most importantly, they significantly accelerated the process of finding tests in the project.
Our users (in particular, here on Habré) actively asked to add support for CTest, a test runner that comes with the CMake project model. It was not very easy, since CTest is itself a launching tool, and not just another framework, and therefore it did not fit well into the existing API. But we finally did it! CLion now automatically finds CTest tests in the project, creates launch and debug configurations for them, builds a tree displaying test results. You can even debug your tests - this will cause CLion to run the test, not the ctest process.
As for limitations, it's worth noting that CLion supports CTest 3.14 and higher. In addition, if a test block from an already supported framework (Google Test, Catch (2), Boost.Test, and doctest) is run as a CTest test, such a block will have one entry in the result tree (that is, it corresponds to one test).
A traditional video from Phil Nash on improvements for unit testing:
Qt projects
We see that CLion often writes projects using the Qt framework. And, although we do not plan to create our own interface designer or support the qmake project model, we nevertheless decided to do something to improve the user experience in CLion in this direction.
UI project and class templates
The dialog for creating a new project now offers two new types - Qt Console Executable and Qt Widgets Executable:
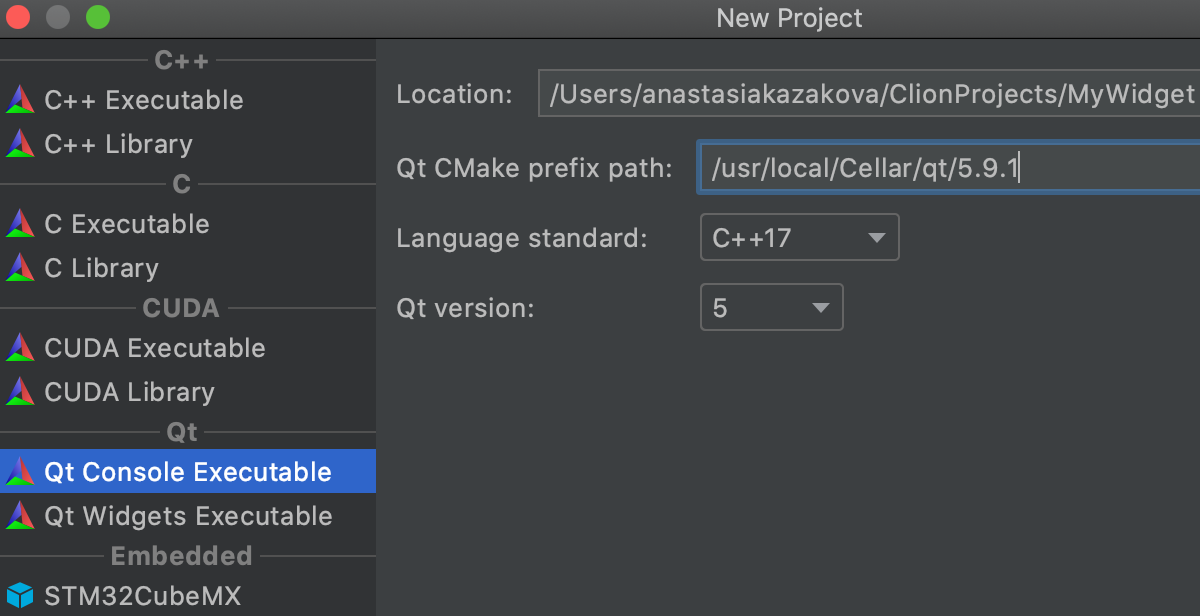
Specify the required values - CLion creates a starting CMake project of the selected type, and now the simplest widget or console application is in your pocket! By the way, speaking of CMake and Qt, Qt6 suggests installing some libraries via Conan (CLion also has a corresponding plugin ) and building them via CMake and Ninja. Isn't there a reason to try CLion for Qt development?
By the way, when adding a new Qt UI class, CLion can create three files at once ( .ui and class files). To do this, select the QT UI Class action in the add new file menu.
Working with Qt Code
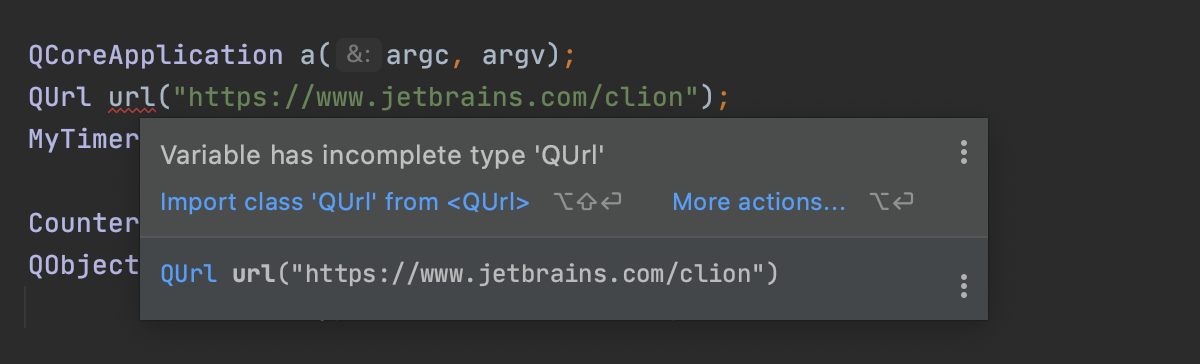
Qt code is generally normal C ++ code, but it has its own quirks. For example, Qt has a certain style of importing header files. For example, it can be enabled correctly
QtCore/qurl.h
, but it would be more correct to use
QUrl
. The style is now supported during auto-import in CLion:
The code completion function now understands when it is necessary to offer variants of signals only or only slots for the main Qt entities:
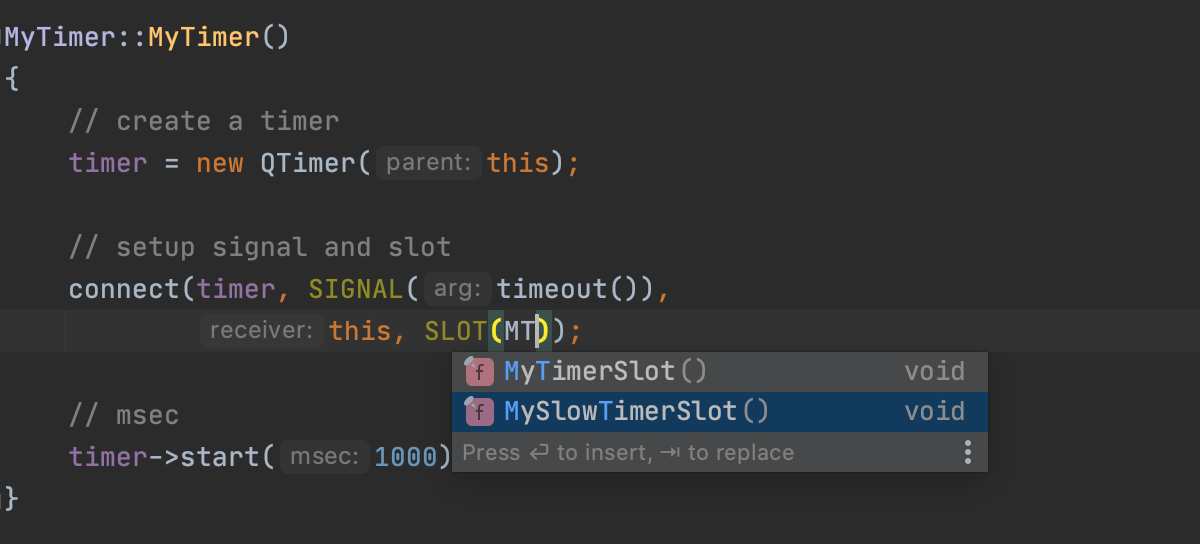
This is convenient, since the drop-down list shows only the variants that fit the meaning, and not all those that match by typed characters.
What Qt feature do you personally lack in CLion? Write in the comments!
Design models in CLion
We are gradually adding support for more and more types of projects using the Makefile into CLion (we keep a list of tested projects here ). In the 2020.3 release, we supported projects that use the ccache , libtool , dolt , slibtool, and jlibtool tools . These are ZFS, PHP, Mono, Curl projects and others. Run and debug configurations for targets from the top-level Makefile are automatically generated. In addition, for Makefile projects, it became possible to recompile a separate file without having to rebuild the entire project (in the default layout - Ctrl + Shift + F9 on Windows / Linux and ⇧⌘F9 on macOS).
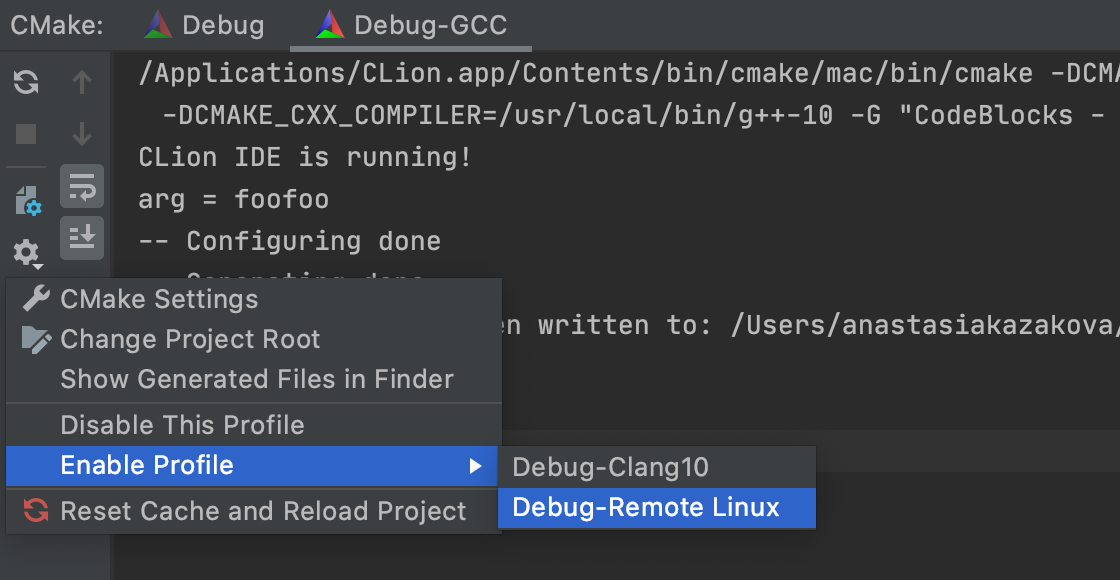
For CMake projectsyou can now disable temporarily unused CMake profiles. This is especially useful if the project has several profiles configured at once for remote development (some of them may be temporarily disabled) or for various toolchains (also not always used all together). When such profiles are disabled, project loading time is noticeably reduced. Previously, you had to delete profiles for this, but now you can simply turn them off. This can be done from the profile settings in Settings / Preferences | Build, Execution, Deployment | CMake or from the CMake download dialog:
For more details on improvements for Qt projects and in project models, see our developer-attorney's talk .
MISRA standards
Our clients include many embedded developers and representatives from the automotive industry. For them, an important part of the development process is code certification according to the MISRA standards. We cannot help with the certification itself, but we are quite capable of pointing out possible inconsistencies with the MISRA standards at an early stage of development! In the CLion 2020.3 version, we began to add checks for the MISRA C 2012 and MISRA C ++ 2008 standards to the built-in static code analyzer:
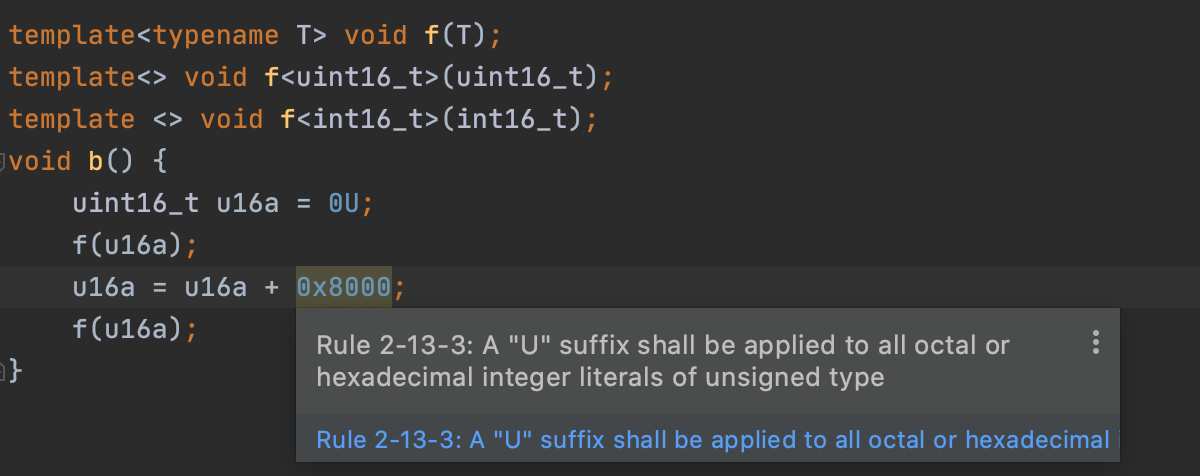
Not all are supported; a complete list can be found on this page . Setting up inspections is quite simple:
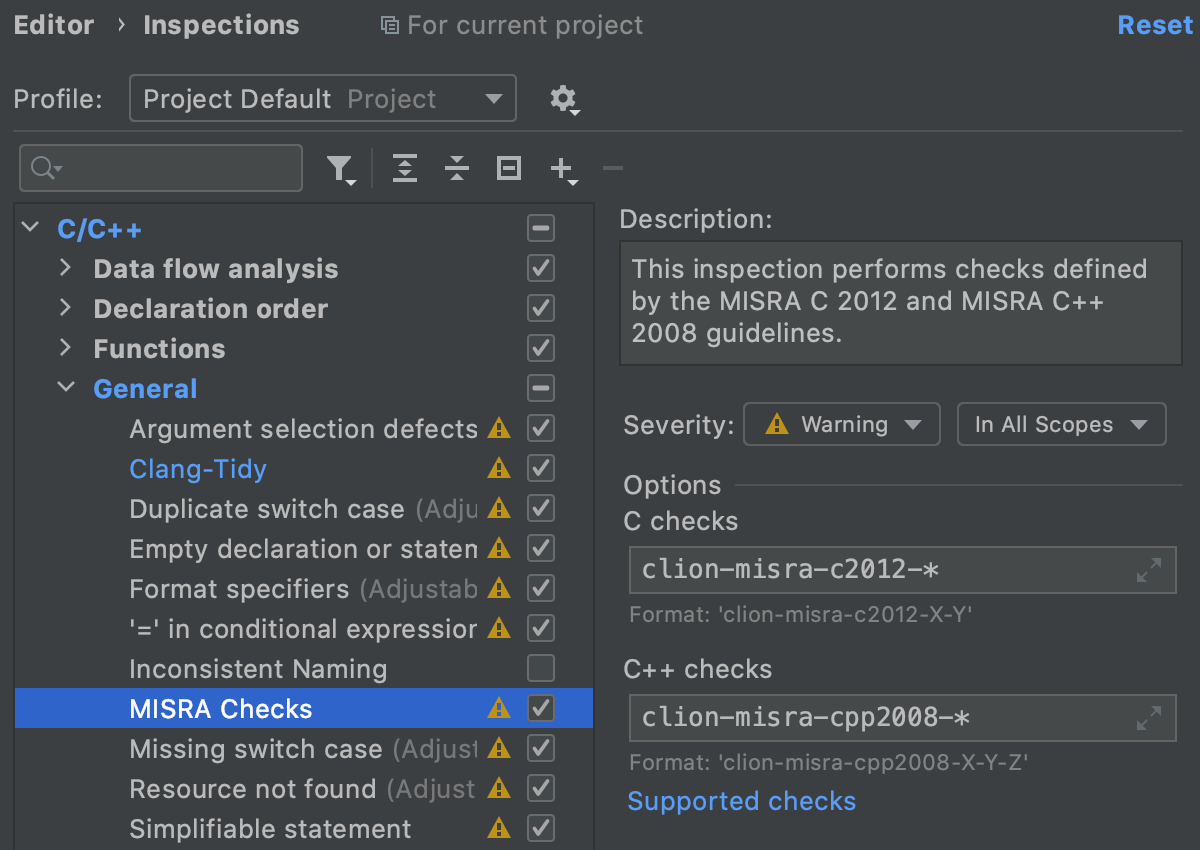
We will add more MISRA inspections in the future. It is possible that AUTOSAR checks will also appear.
Code With Me is a new collaborative development tool
Does your team practice pair programming? How about a tool for sharing code? We recently launched an early access program for our new collaborative development tool, Code With Me. Basically, this is a plugin available for almost all of our desktop IDEs (excluding JetBrains Rider and DataGrip so far). It allows you and your team to collaborate on projects right from your IDEs. To try Code With Me, install the plugin in Preferences / Settings | Plugins.
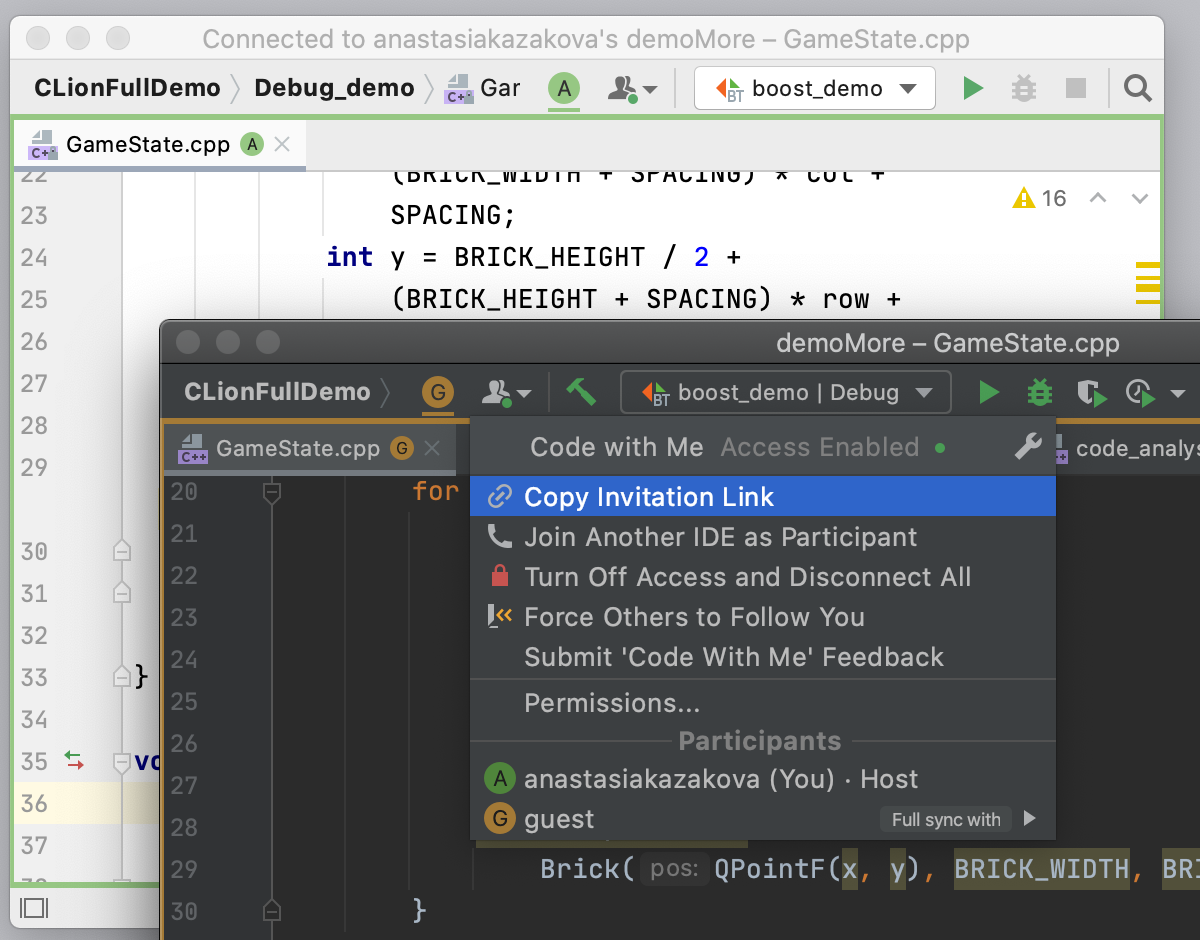
You can read more about the plugin's capabilities in these blog posts . Code With Me is still under active development. If you run into any problems while using it, please let us know here .
And much more
Other important improvements include:
- Now you can use a script to set up the environment in which the run / debug configuration will run. In addition, you can now edit run / debug configurations right during project indexing.
- We have expanded the auto-completion capabilities with Clang snippets. They will help you correct not only keywords, but also the syntax of integer expressions:

- CLion's color scheme can now be synchronized with your operating system theme. To enable this feature, go to Settings / Preferences | Appearance & Behavior | Appearance and select the Sync with OS option.
- , (Drag&Drop). Open in Right Split, Project, Recent Files Search Everywhere.
- Git-. VCS , VCS (, Git). Search Everywhere Git. , , .
That's all for us. We are glad that you have read to the end. Thanks for attention! Leave your questions, thoughts and suggestions in the comments - we are interested in what you think, and we are always happy to help!
CLion Team
The Drive to Develop