
Procurement guidelines are a good example where simple rules lead to complex and confusing business designs. As a result, the business finds itself in a "case" of restrictions that negatively affect it. It is impossible to overcome this - everyone works according to the rules.
You can change the rules, but then troubles begin. There is evidence that often very simple rules lead to unpredictable dynamics. This is called the principle of computational irreducibility ( The New Kind of Science ). The result of applying a not very complex set of rules is not intuitively predictable. It can only be calculated (simulated) by performing the appropriate operations.
Let's discuss the following topics:
- dynamics of purchases of manufacturing enterprises;
- what is wrong in the regulations;
- why the system still works;
- KPI research through Gröbner bases.
1. Analysis of procurement data
Below are the data of purchases of 5 operating enterprises and one under construction.
Data taken from ERP. They are very simple:
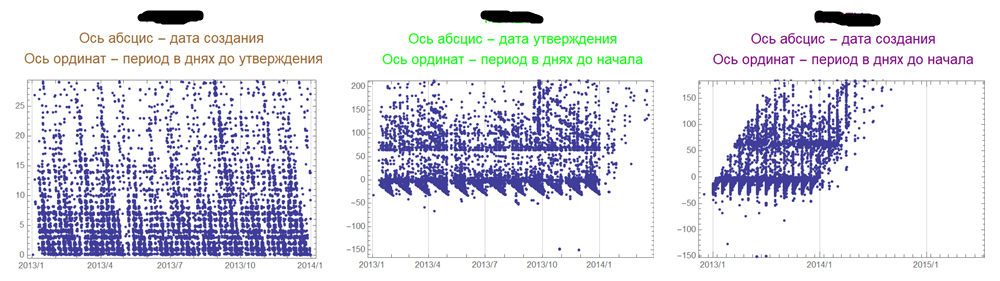
- the date the requirement request was created;
- date of approval of the requirement after the approval procedures;
- start date of deliveries.
Operating plant 1.
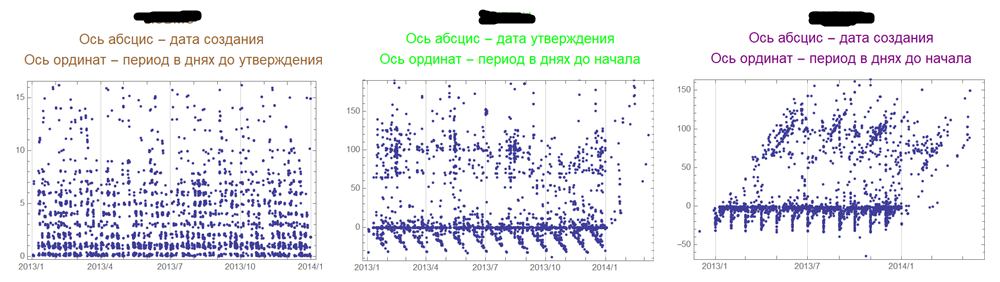
The first schedule corresponds to the coordinates <date of requirement creation - date of purchase approval>. The second graph corresponds to the coordinates <purchase approval date - delivery start date>. The third is the general picture without the approval date in the coordinates <demand creation date - delivery start date>.
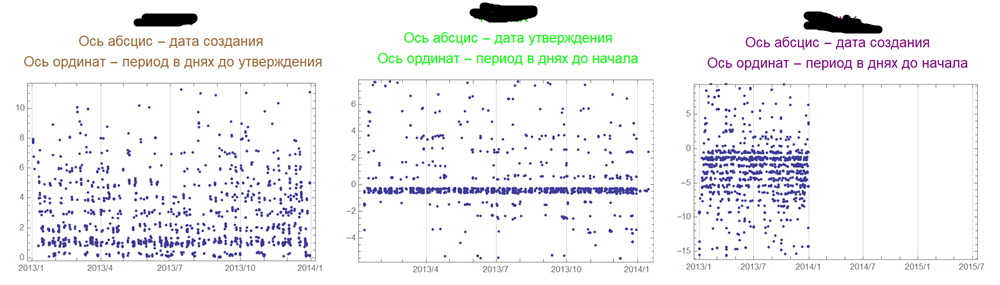
Operating plant 2.
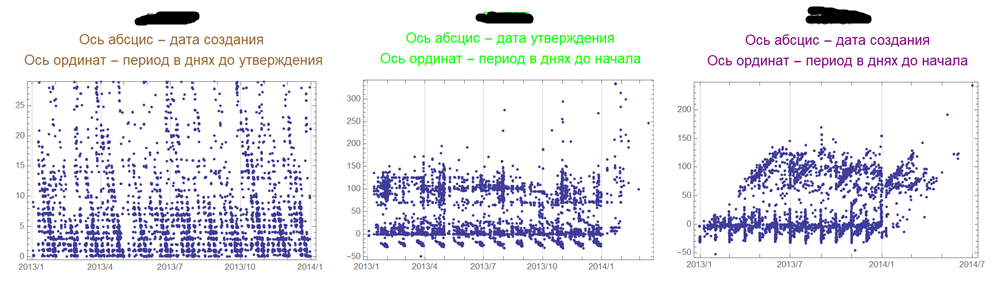
You need to understand that the procurement regulations are a strict procedure: with one amount you run in a small circle, with another - for a large one, and with a certain amount you need to get a collegial decision.
Operating plant 3.
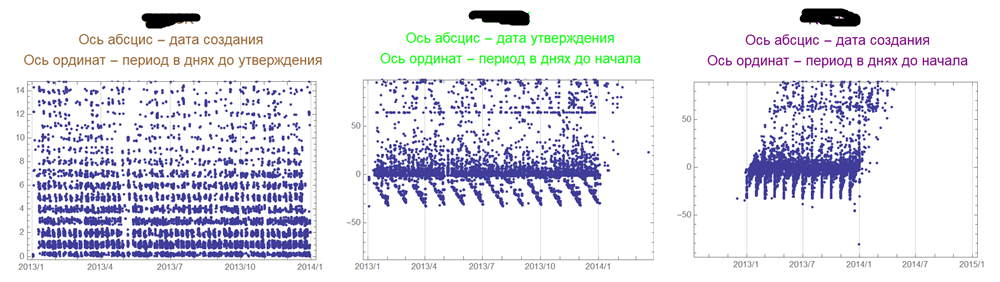
While the profile of the plants is the same. The purchases are mainly for repairs, but the graphs show a fairly large uniqueness of the processes from plant to plant.
Operating plant 4.
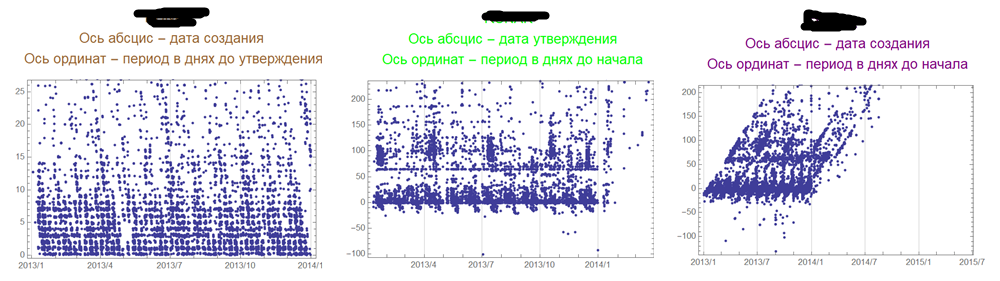
Operating plant 5.
For all the seriousness of the regulations, dates in negative areas are interesting. This means that the delivery takes place before the end of the approval procedures. This is also a note on the question of the relative benefits of ERP: it's bad without it, but with it, a lot of problems (related to its area of responsibility) remain unresolved.
Factory under construction.
The data looks more chaotic, but negative dates are abundant.
2. What the regulations allow in practice
The above data indicate the presence of non-regulatory agreements. Moreover, these agreements are taking place at a very high level. Pay attention to the bottom "notches" in the charts of operating plants. They most likely reflect monthly accounting write-offs. At the plant under construction, there is still no proper accounting discipline and write-offs there occur chaotically.
There can be only one conclusion: the whole mountain of regulations and procurement rules does not work as it should. Moreover, everyone understands this and takes action to fix it. The motives for this may be different.
The first section dealt only with the actual dates fixed in the ERP for procurement processes. But these purchases are made from the allocated amounts determined by the planning regulations, which are the same for all enterprises.
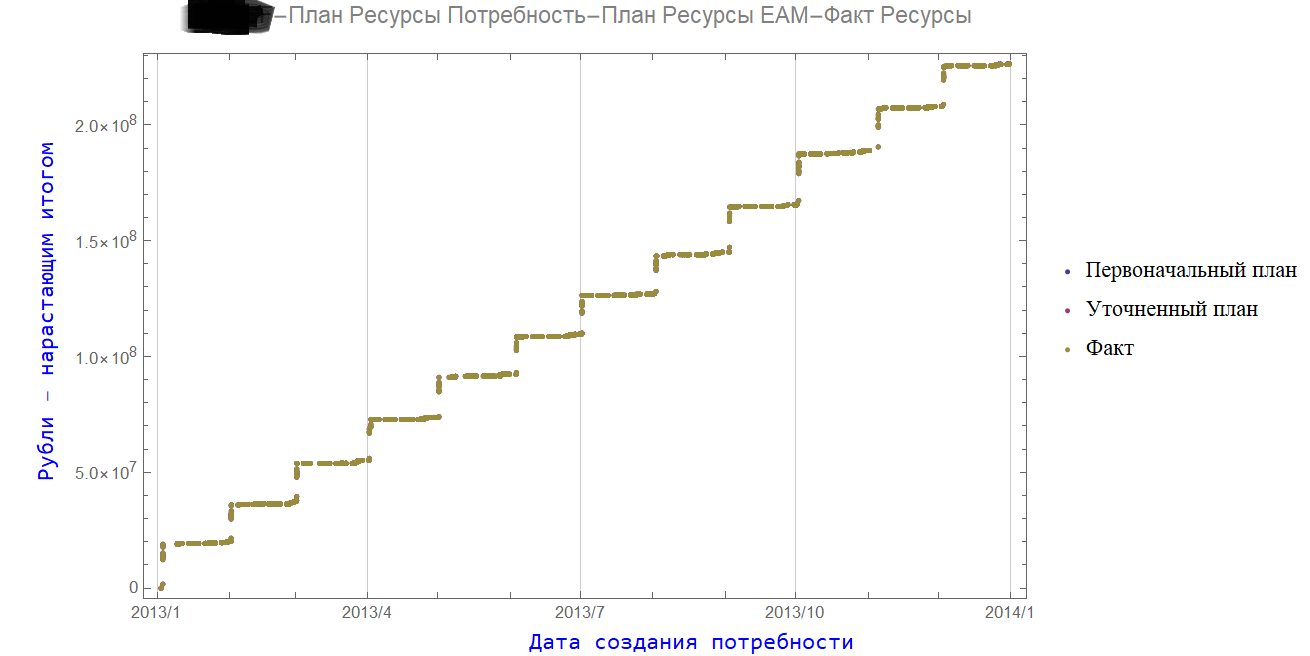
Below are the figures showing the amount of funds for materials. They correspond to the existing plants, the data on which were discussed earlier.
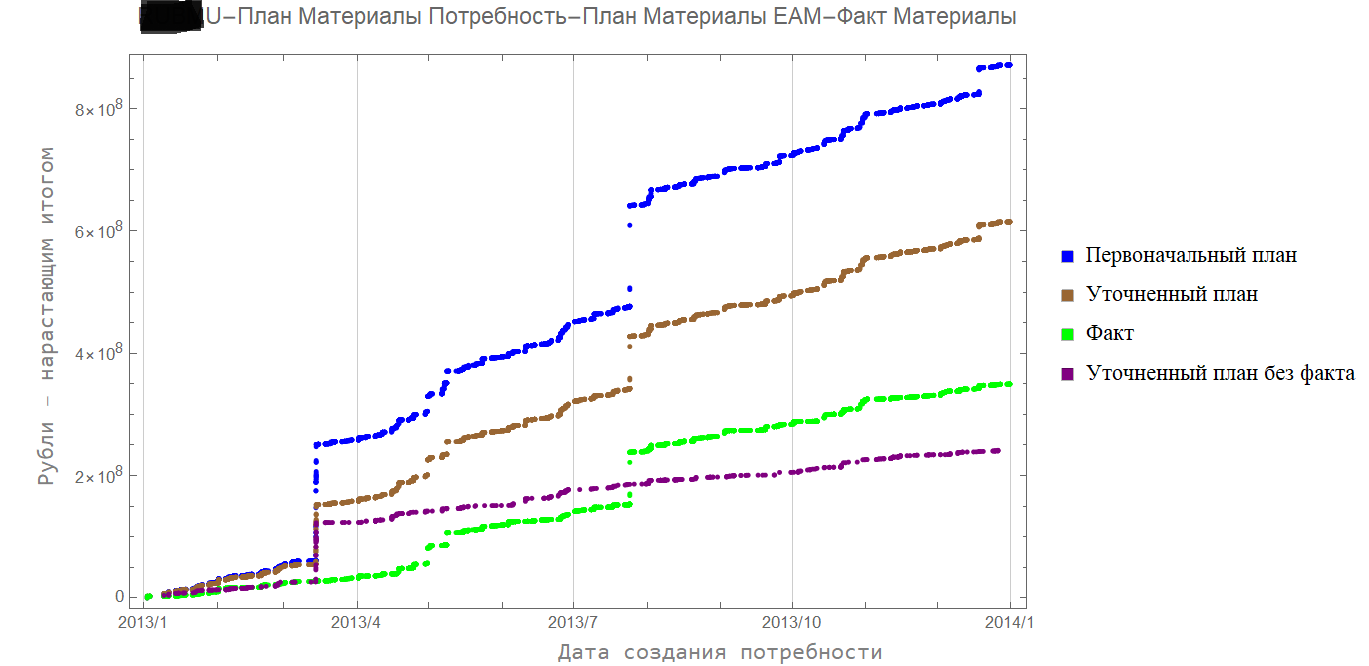
The blue indicates the originally approved plan.
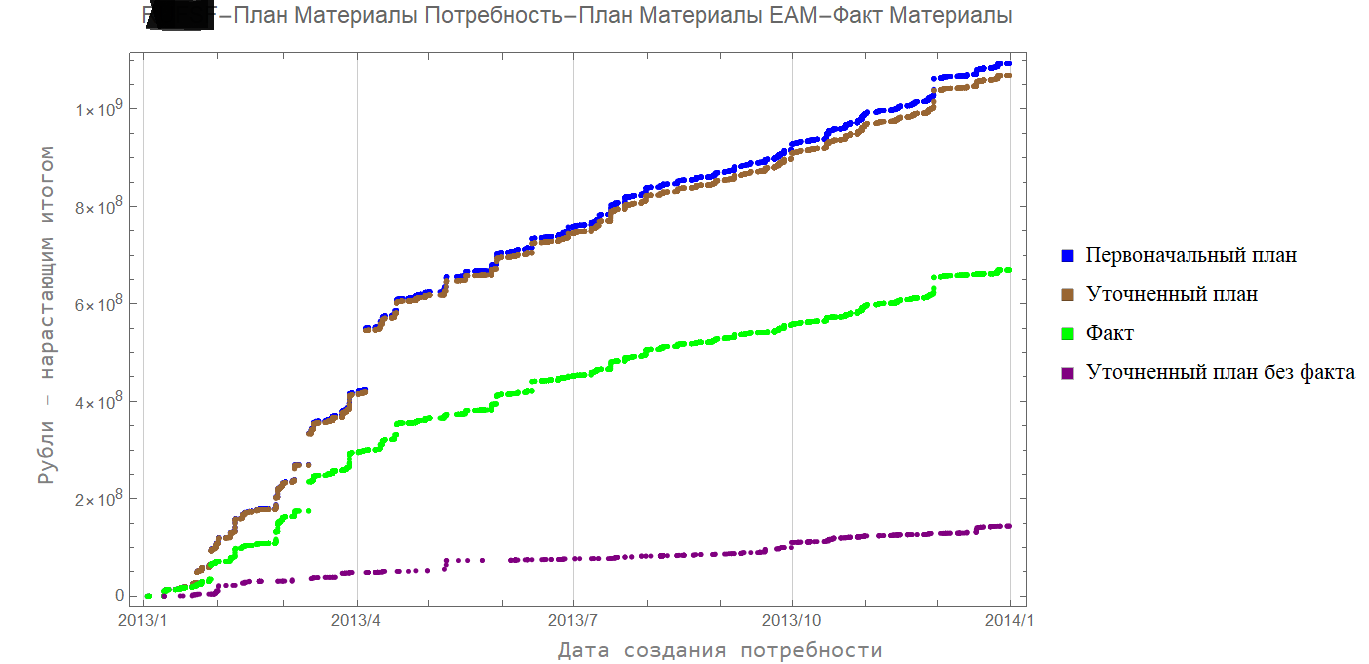
The brown line is the revised plan. The data is historical, the gaps correspond to the revision of the budget parameters.
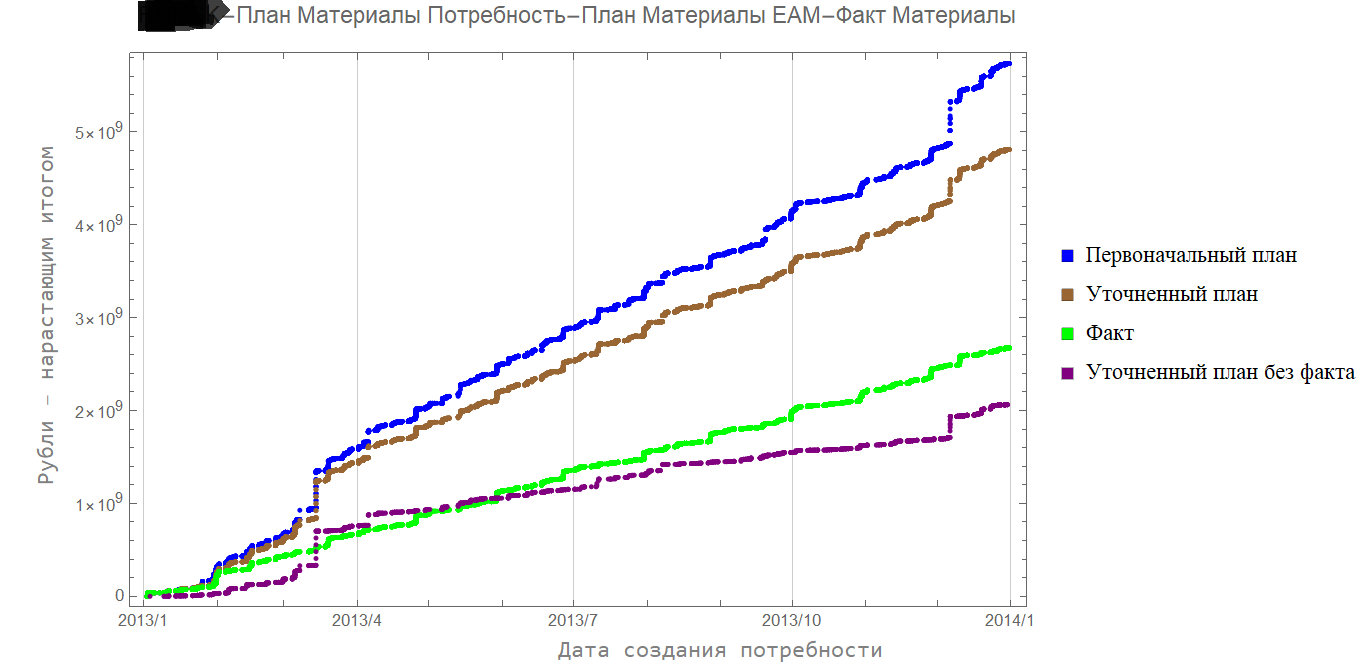
The green line is a fact.
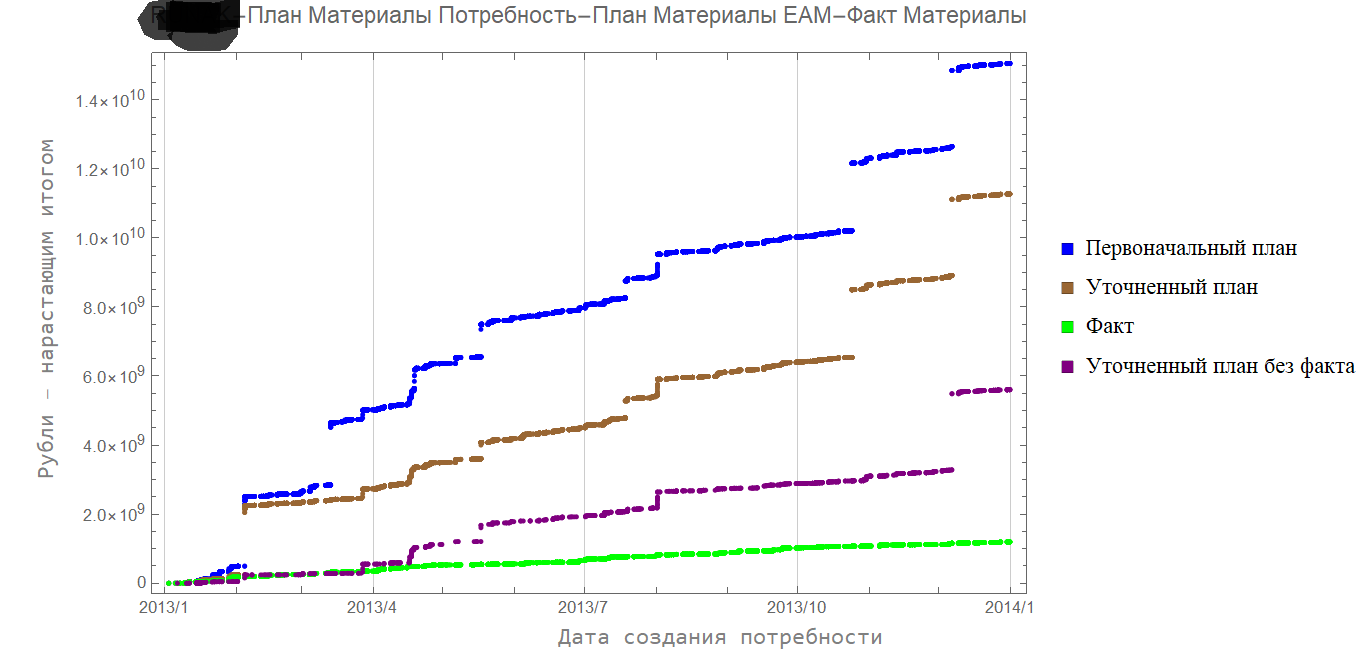
The purple line is a refined plan without fact: it shows how much the needs are initially overestimated.
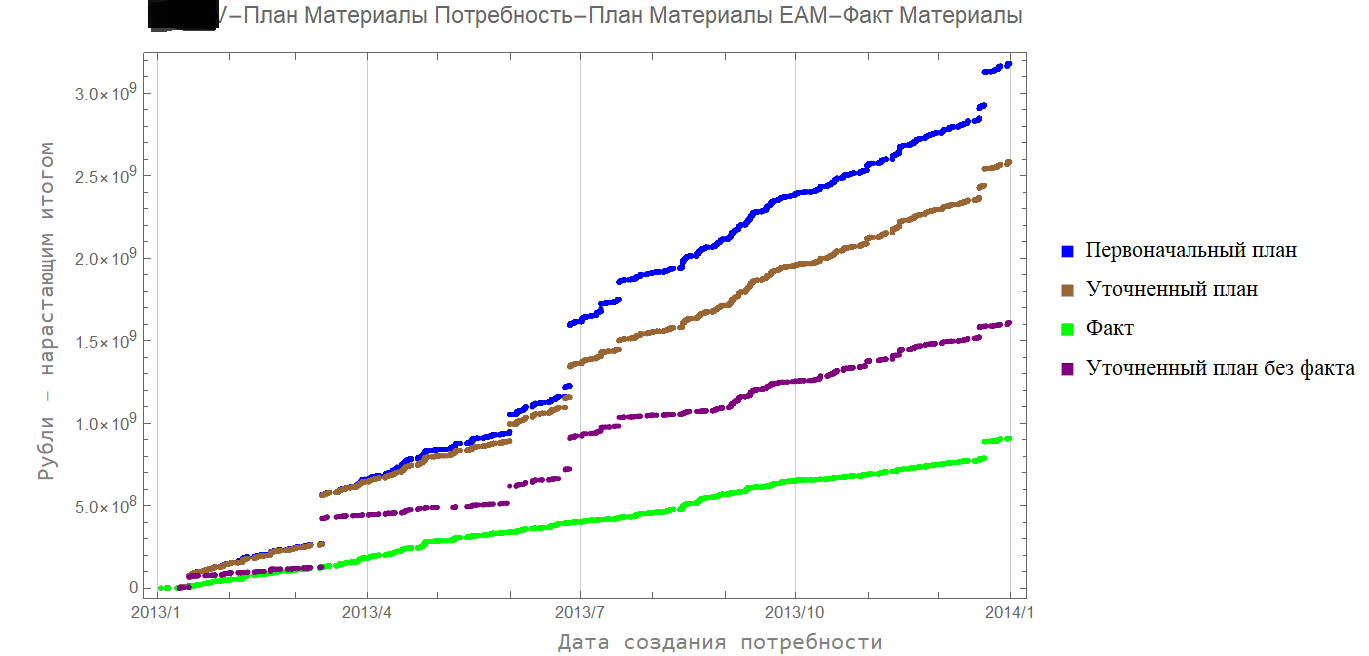
Interestingly, all of these dynamics are consistent with the current regulations.
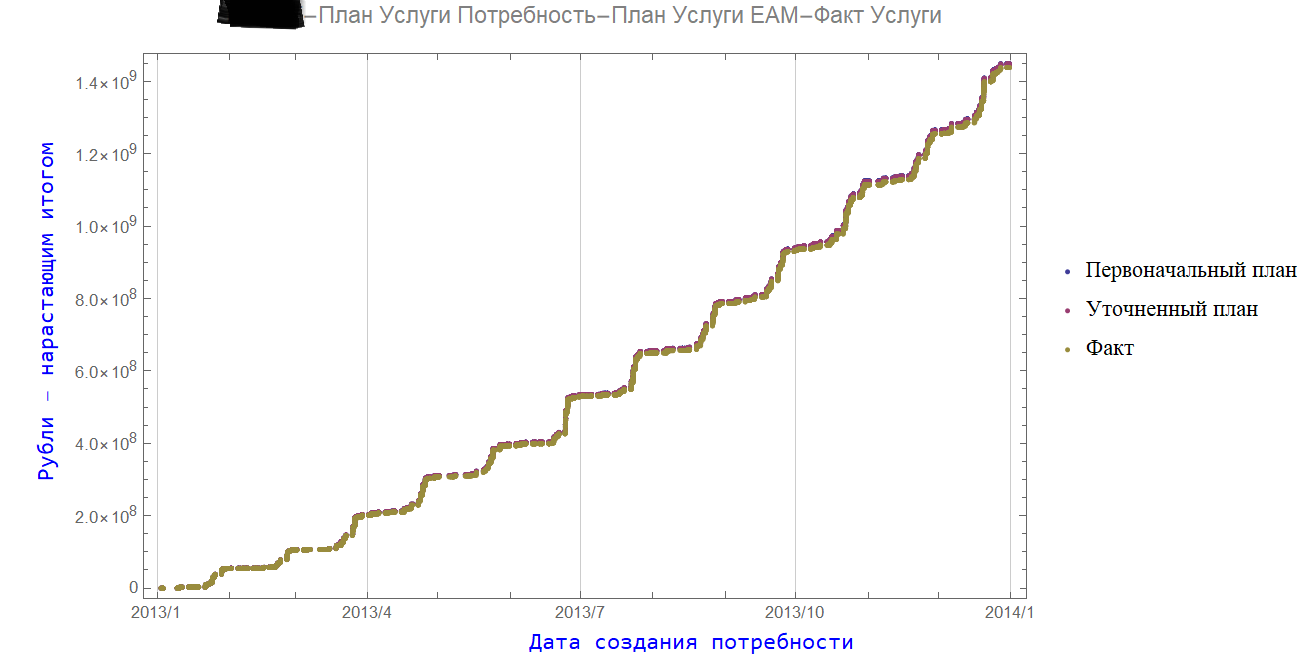
For such items as Resources and Services, the plan is exactly the same (the miracle of forecasting methods).
3. System of rules, KPIs and shadow planning
Science cannot be fooled, and the system of rules in regulations gives an unpredictable result. But in ordinary practice, on paper, the desired result is almost always obtained.
This is not a paradox, but a consequence of shadow planning and correct work with KPIs (we choose ourselves - we report ourselves).
Nobody looks at negative delivery dates (hindsight) and strange dynamics in needs. The main focus is on the ability to stay within budget.
Let's see what happens to the purchase prices.
The picture is the same for almost all enterprises. Below are the data of only one of the enterprises.
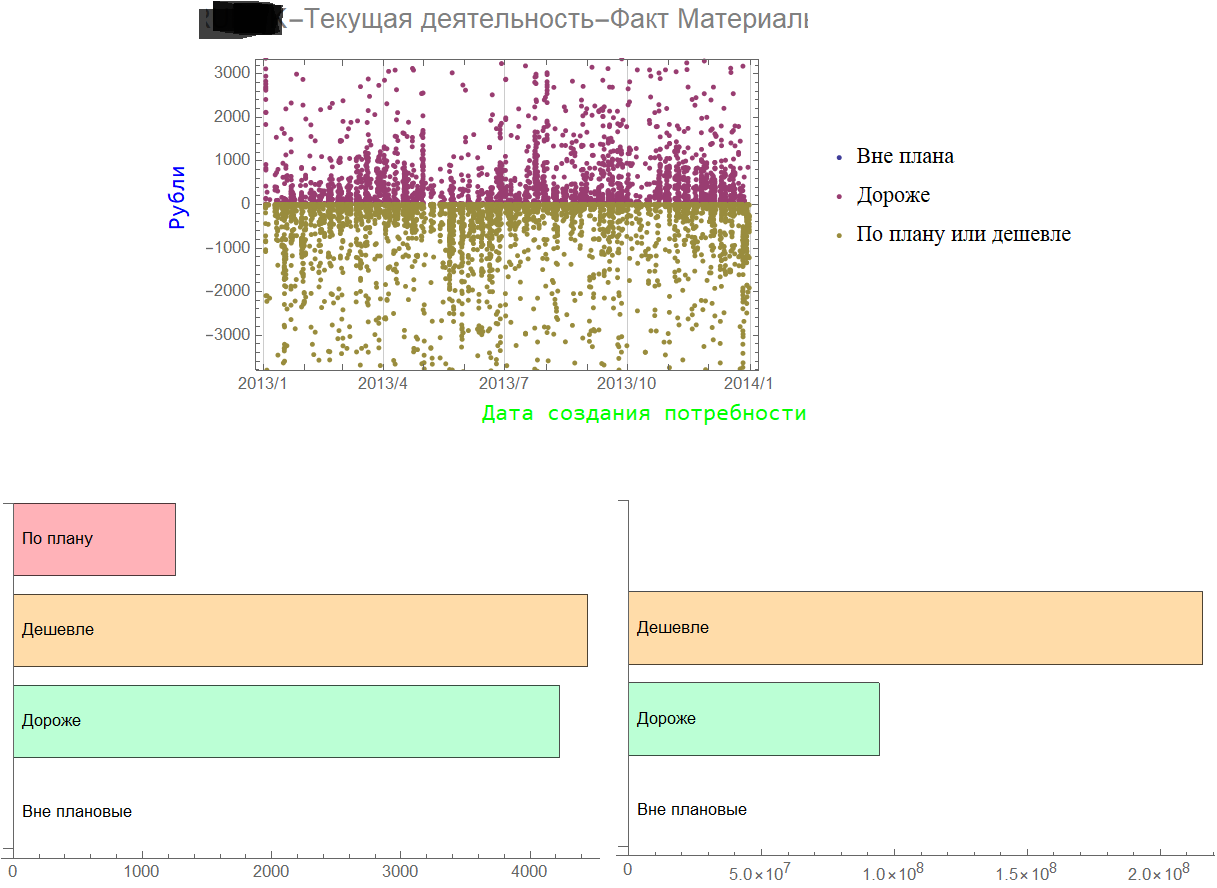
The figure shows the ratio for materials: crimson dots - bought more expensive than stated, brown - bought cheaper.
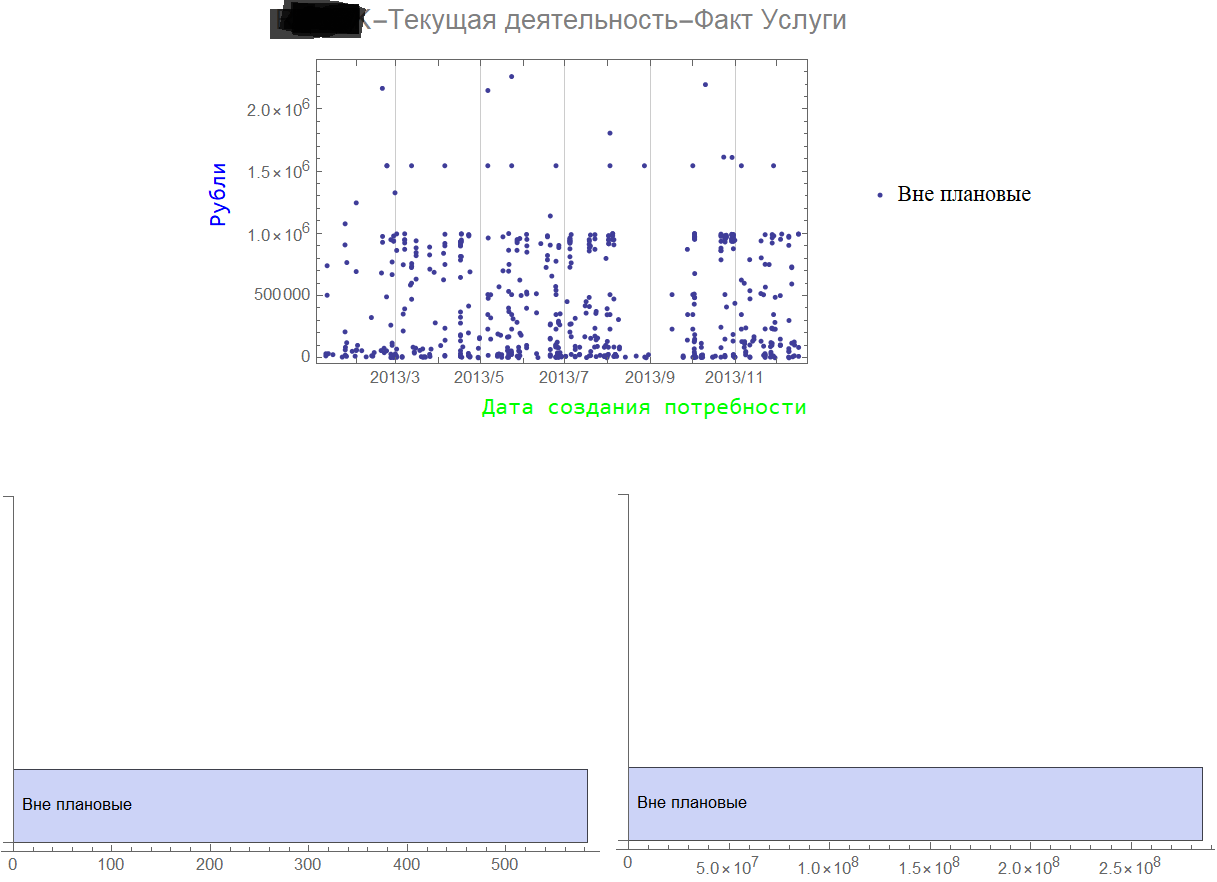
All purchases of services are not planned.
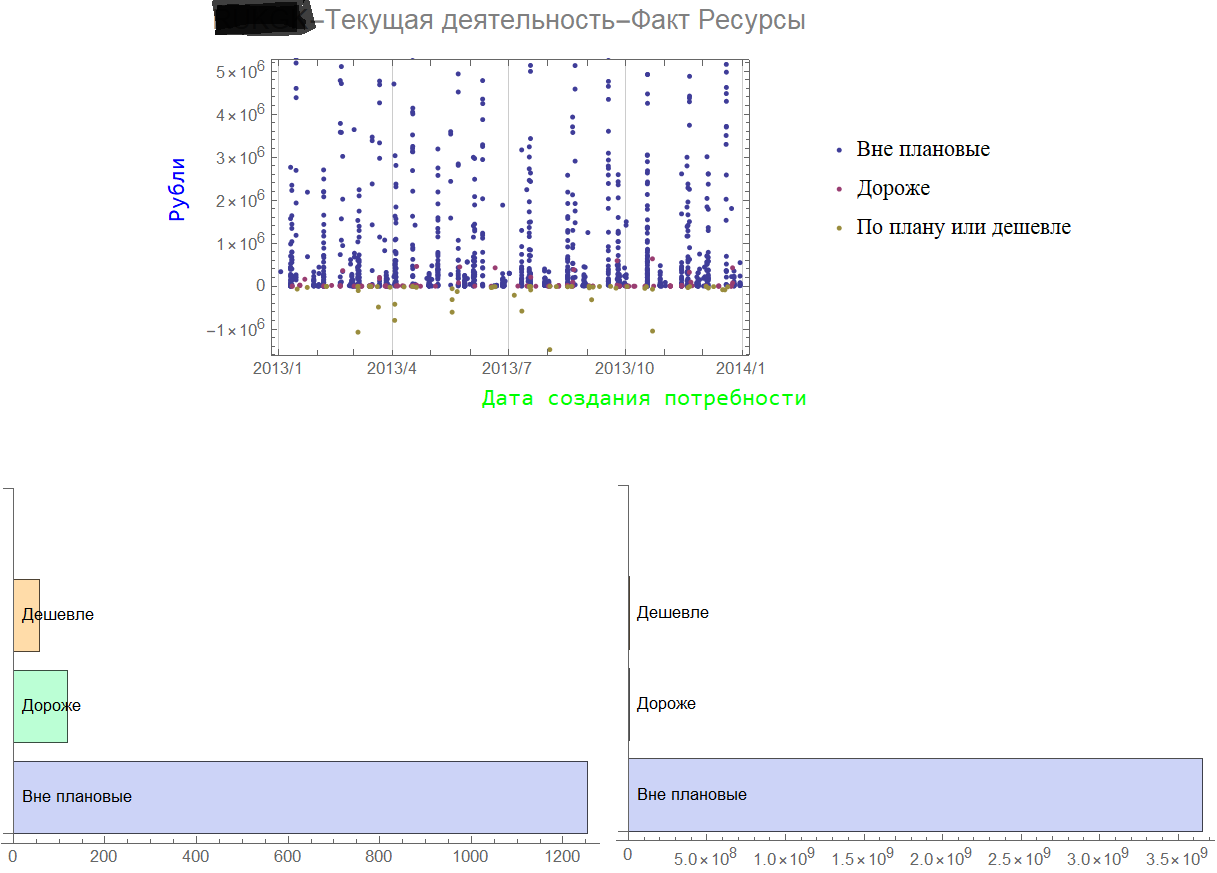
More resources were purchased outside the plan.
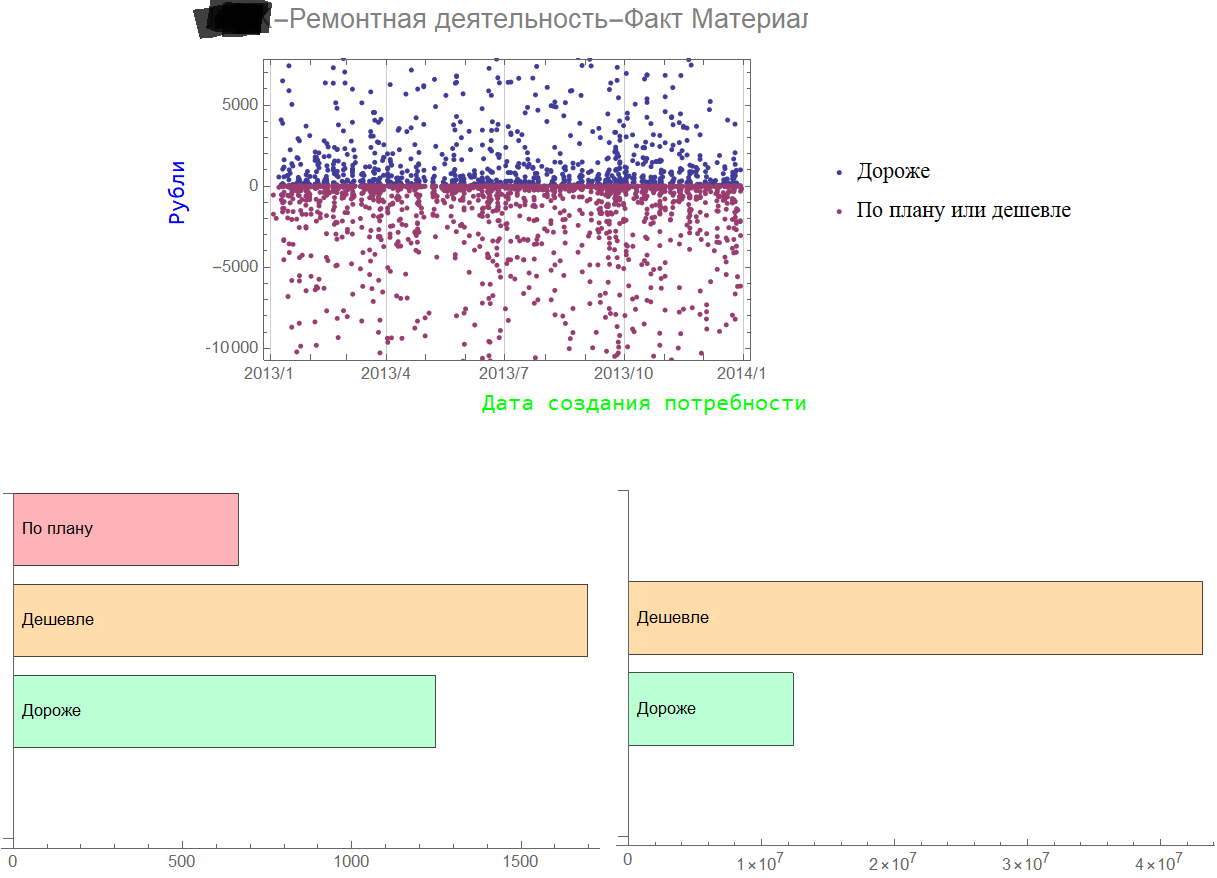
The histograms on the left show the distribution of the number of positions, and on the right - their volume.
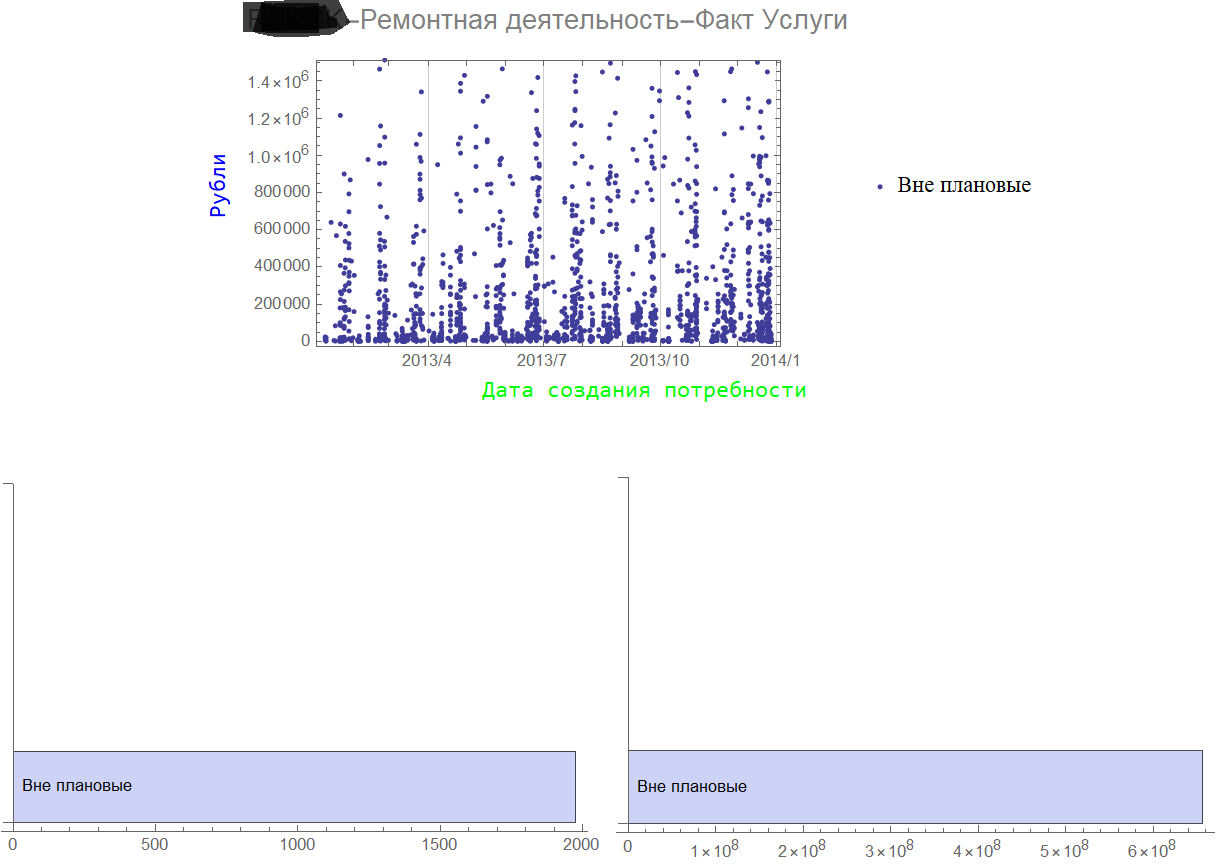
Of course, in an enterprise that has been operating for decades, all repair services must be unscheduled.
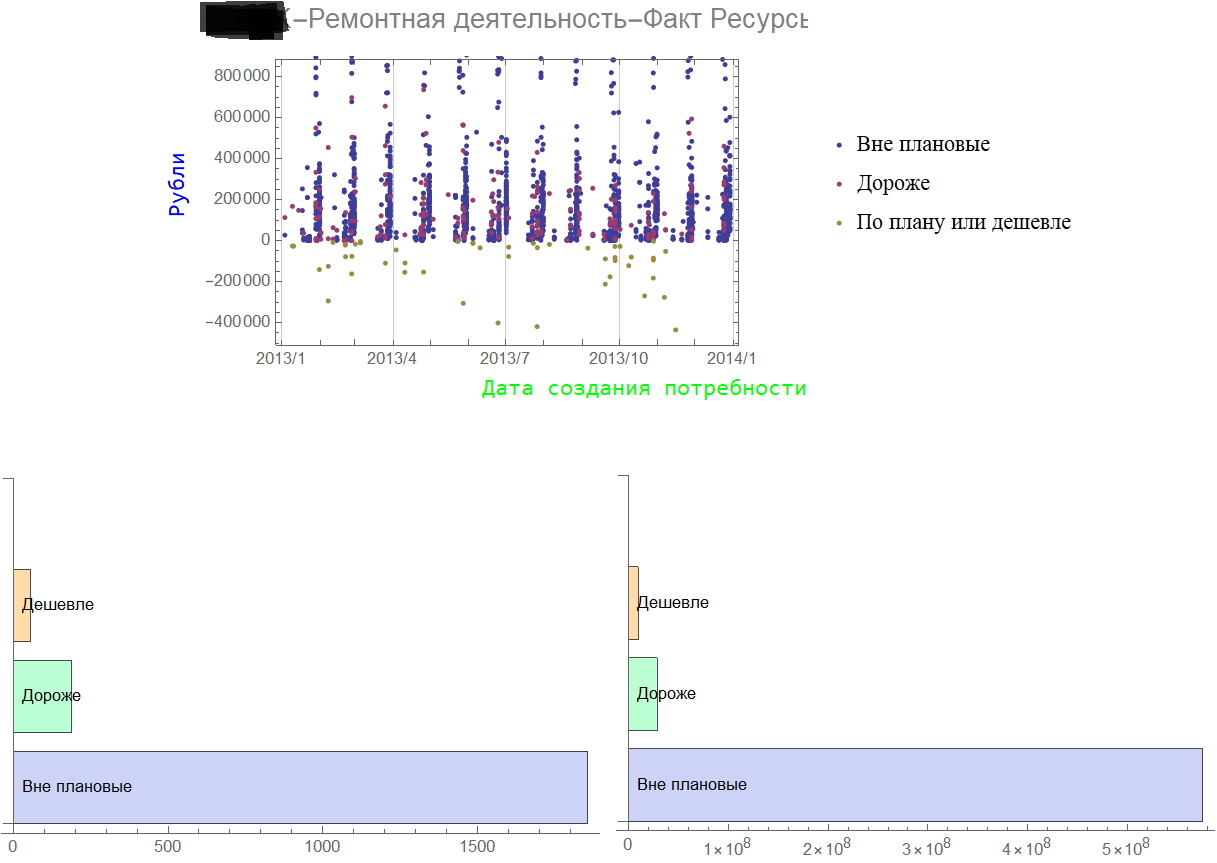
Resource summary for repair activities.
With such profiles, scandals can be avoided only with regular shadow planning, in which “reporting” positions are tracked.
If such planning can take place in constrained circumstances, then the purposeful development of the planning system will undoubtedly be even more successful.
4. What to do? KPI. Gröbner bases
No matter how well-grounded claims to KPIs, they have become firmly established in the business management system.
The way of constantly reviewing KPIs is not the most effective one. It is possible to come up with new KPIs, but for this you need to have good reason to apply certain functional dependencies. In addition, there are restrictions on the part of labor legislation that do not allow simply abandoning the accepted remuneration system.
In general, there are relatively few reserves to manage through KPIs. But an analysis of the current KPI system can tell a lot about the fears of participants in bonus programs. Those positions that are not included in the KPI are the most interesting. For included items (eg sales volume) that are difficult to interpret unambiguously and difficult to achieve, additional easy-to-reach “offset” items are interesting.
The following methodology for objective assessment of existing KPIs is proposed.
All quantitative and qualitative KPIs are translated (according to fairly simple and transparent rules) into functional dependencies:
f1 (x1, x2, x3, x4)
f2 (x2, y1, y2, y5)
f3 (x4, y2, z1, z2, z3) …, Where x, y, z are factors taken into account.
There can be many such dependencies. The same number of KPIs or more.
Formally, the result is a polynomial system in many variables.
To solve such systems, the method of Gröbner bases has been developed. In general, the method is rather complicated and does not always lead to the desired result.
But in the case of KPIs, it fits perfectly.
What does it allow you to do?
First, the method provides an answer as to whether the system is compatible and has a solution. If the system does not have a solution, then the selected KPIs are inconsistent.
Secondly, for consistent KPIs, the method allows you to find functional dependencies (formulas) between KPIs of different departments and analyze their interdependence.
Thirdly, one can understand the level of separatism and disconnectedness of the performance indicators of the units. The KPI system can split (according to formulas) into unrelated (independent) parts.
And finally, a formalized list of factors x, y, z,… fixes a set of business projections taken into account. All other projections are forgotten.
Before moving on the path of improving the planning and management system, try to test the set of KPIs of your company.