- Let's get started. I will tell you about convenient logging and the infrastructure around logging that you can deploy to make it convenient for you to live with your application and its life cycle.
What do we do? We will build a small application, our startup. Then we will implement basic logging into it, this is a small part of the report, what Python supplies out of the box. And then the biggest part - we will analyze the typical problems that we encounter during debugging, roll-out, and tools for solving them.
Small disclaimer: I will use words like pen and locale. Let me explain. "Handle" is possibly yandex slang, it denotes your API, http or gRPC API or any other letter combinations before APU. "Locale" is when I develop on a laptop. It seems that I have told about all the words that I do not control.
Bookstore application
Let's start. Our startup is the Bookstore. The main feature of this application will be the sale of books, that's all we want to do. Then a little filling. The application will be written in Flask. All code snippets, all tools are generic and abstracted from Python, so they can be integrated into most of your applications. But in our talk it will be Flask.
Characters: me, the developer, the managers and my beloved colleague Erast. Any coincidences are accidental.
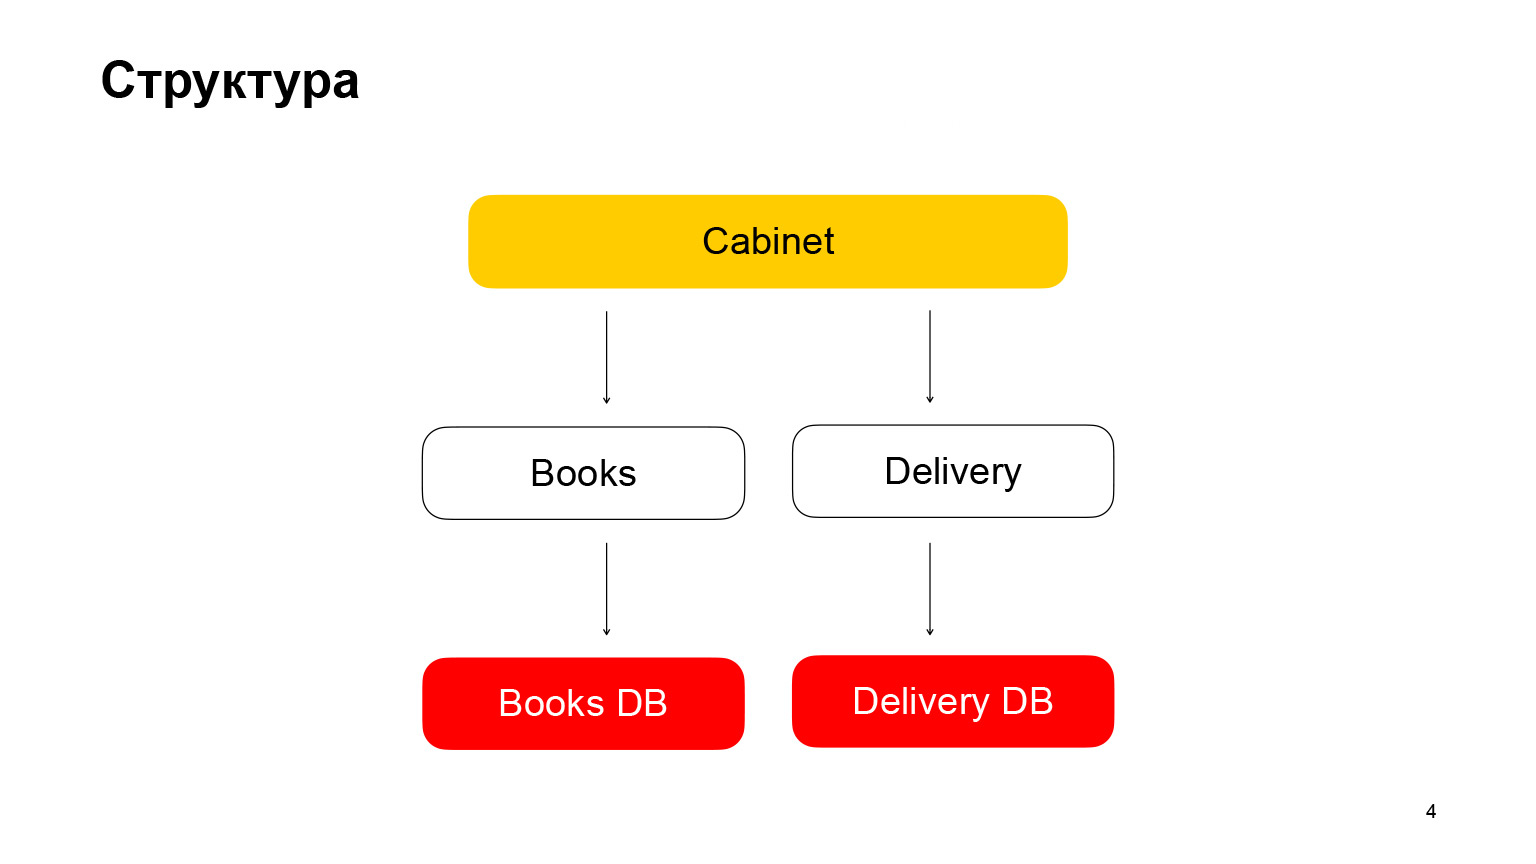
Let's talk a little about the structure. It is a microservice architecture application. The first service is Books, a book storage with book metadata. It uses PostgreSQL database. The second microservice is a delivery microservice that stores metadata about user orders. Cabinet is the backend for the cabinet. We do not have a frontend, it is not needed in our report. Cabinet aggregates requests, data from the book service and the delivery service.
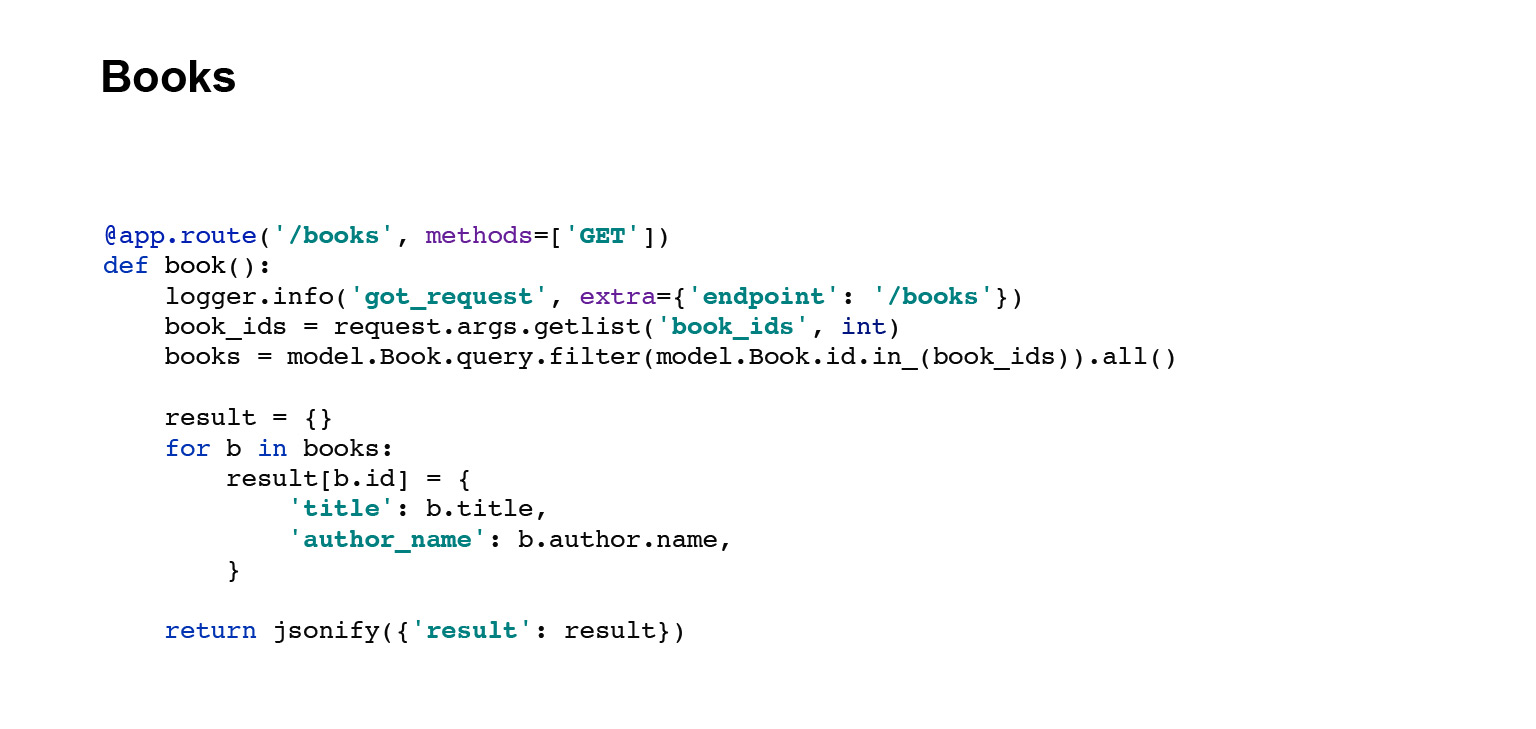
I will quickly show you the code for the handles of these services, API Books. This handle grabs data from the database, serializes it, turns it into JSON and gives it back.
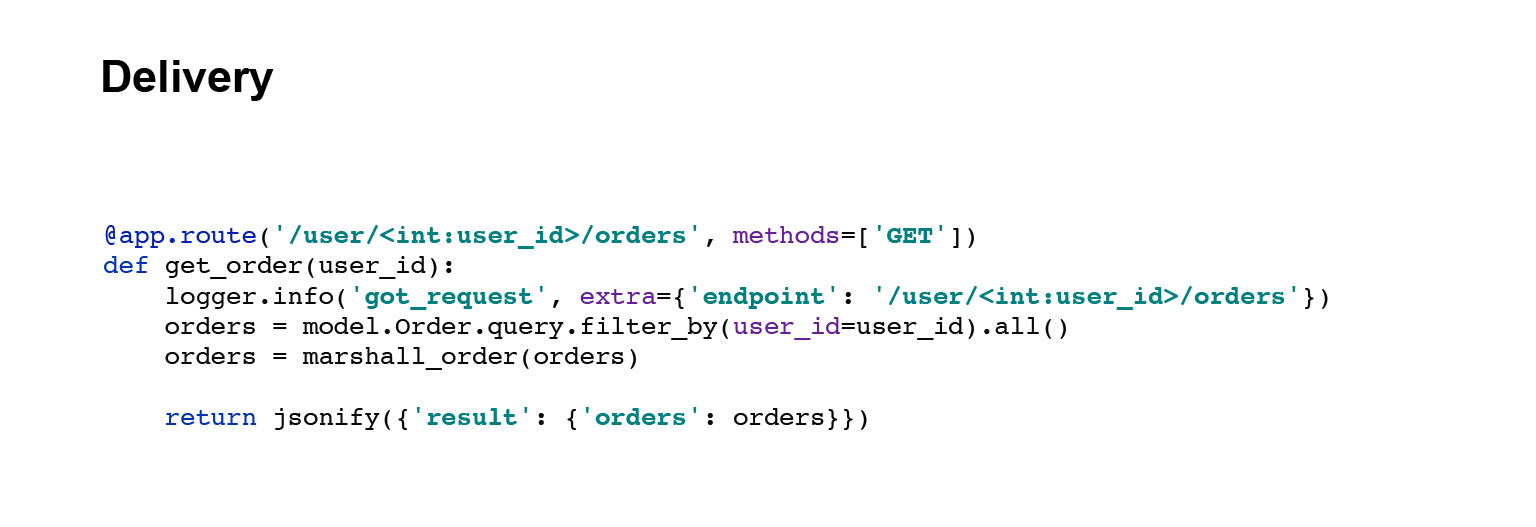
Let's go further. Delivery service. The handle is exactly the same. We grab the data from the database, serialize it and send it.
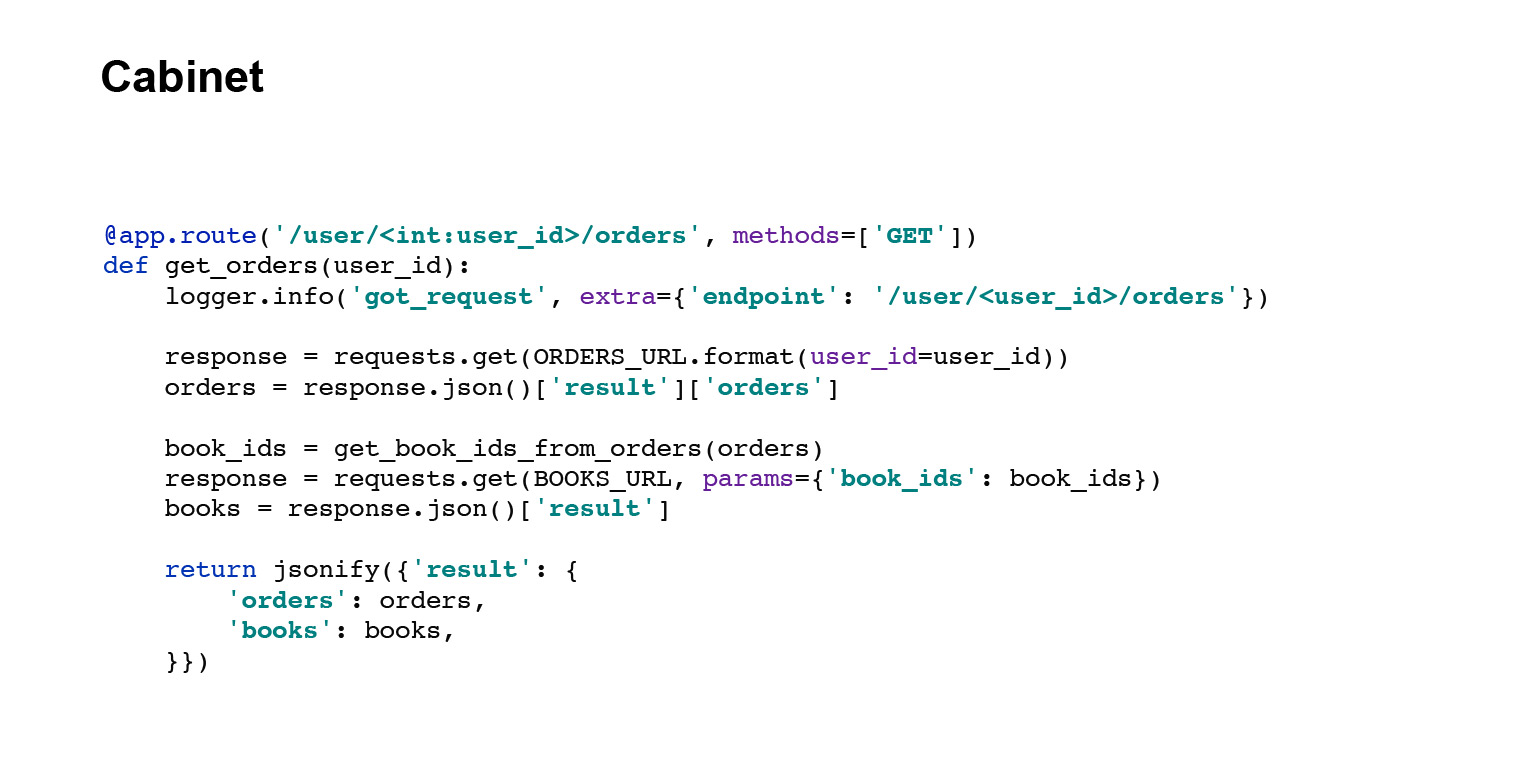
And the last knob is the cabinet knob. It has slightly different code. The cabinet handle requests data from the delivery service and from the book service, aggregates the responses and gives the user his orders. Everything. We quickly figured out the structure of the application.
Basic logging in the application
Now let's talk about basic logging, the one that we sawed in. Let's start with the terminology.
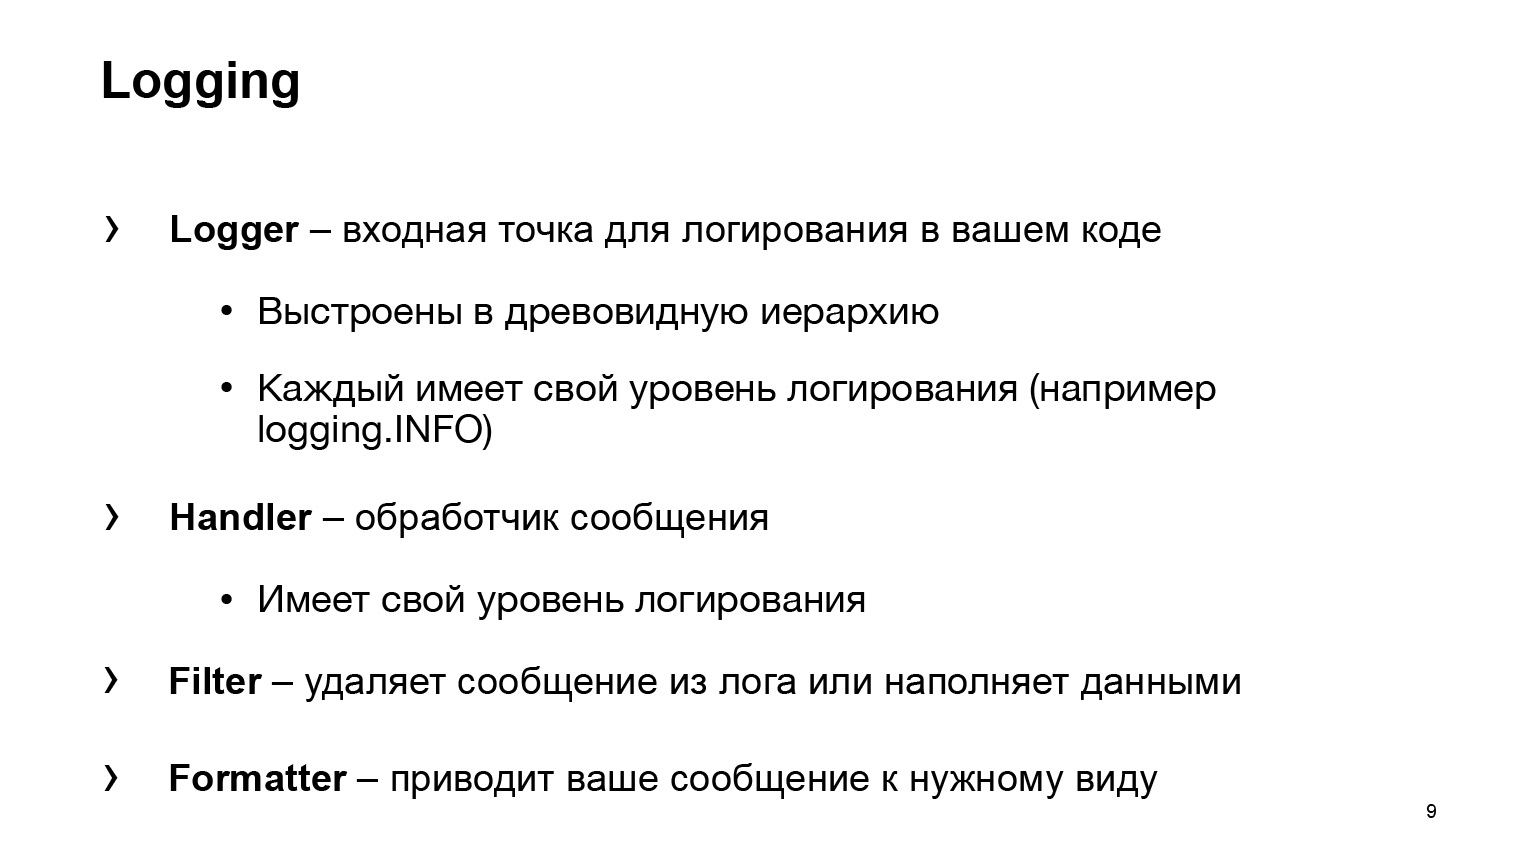
What does Python give us? Four basic, main entities:
- Logger, the entry point for logging in your code. You will use some kind of Logger, write logging.INFO, and that's it. Your code will no longer know anything about where the message went and what happened to it next. The Handler entity is already responsible for this.
- Handler processes your message, decides where to send it: to standard output, to a file, or to someone else's mail.
- Filter is one of two auxiliary entities. Removes messages from the log. Another common use case is data stuffing. For example, in your post you need to add an attribute. For this too, Filter can help.
- Formatter brings your message to the desired form.
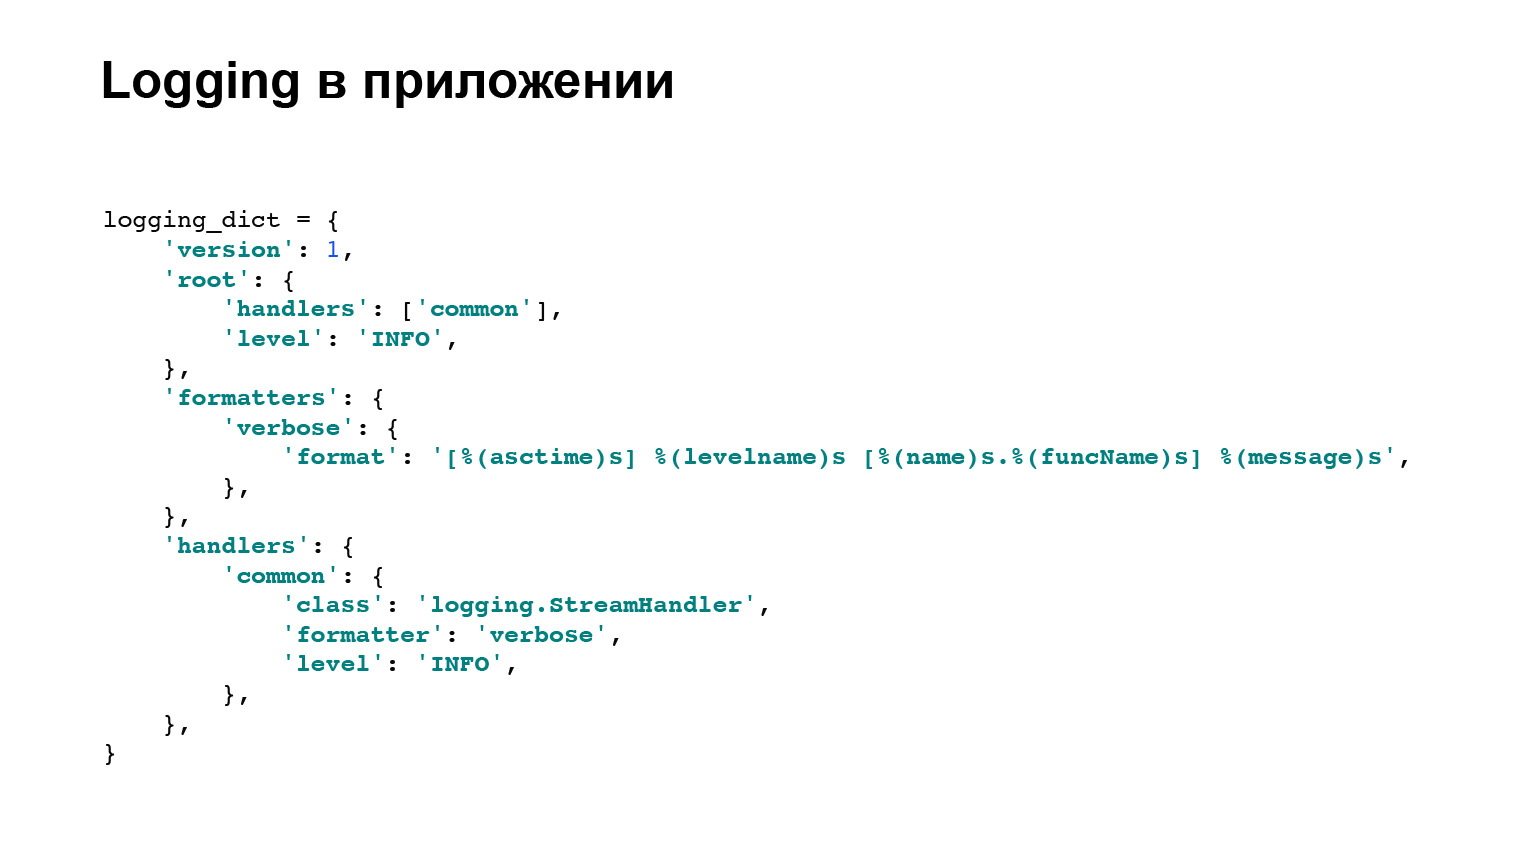
This is where we finished with the terminology, we will not go back to logging directly in Python, with base classes. But here is an example of the configuration of our application, which is rolled out on all three services. There are two main, important blocks for us: formatters and handlers. For formatters, there is an example, which you can see here, a template for how the message will be displayed.
In the handlers, you can see the logging.StreamHandler is used. That is, we dump all our logs to standard output. That's it, we're done with it.
Problem 1. Logs are scattered
Moving on to the problems. To begin with, the first problem: the logs are scattered.
A bit of context. We have written our application, the candy is already ready. We can make money on it. We are rolling it out into production. Of course, there is more than one server. According to our conservative estimates, our most complex application needs about three or four cars, and so on for each service.
Now the question. The manager comes running to us and asks: "It has broken down, help!" You are running. Everything is logged for you, it's great. You go to the first typewriter, look - there is nothing there for your request. Go to the second car - nothing. And so on. This is bad, it must be solved somehow.

Let's formalize the result we want to see. I want the logs to be in one place. This is a simple requirement. A bit cooler is that I want to search the logs. That is, yes, it lies in one place and I know how to rip, but it would be cool if there were some tools, cool features besides a simple grap.
And I don't want to write. This is Erast who loves to write code. I'm not talking about that, I made a product right away. That is, you want less additional code, get by with one or two files, lines, and that's it.

The solution that can be used is Elasticsearch. Let's try to raise it. What are the benefits of Elasticsearch? This is a log search interface. There is an interface right out of the box, this is not a console for you, but the only storage place. That is, we have fulfilled the main requirement. We won't need to go to servers.
In our case, it will be a fairly simple integration, and with the recent release, Elasticsearch has a new agent that is responsible for most of the integrations. They sawed in integration there themselves. Very cool. I wrote a talk earlier and used filebeat, just as easy. It's simple for logs.
A bit about Elasticsearch. I do not want to advertise, but there are many additional features. For example, the cool thing is full-text log search out of the box. Sounds very cool. For now, these advantages are enough for us. We fasten it.
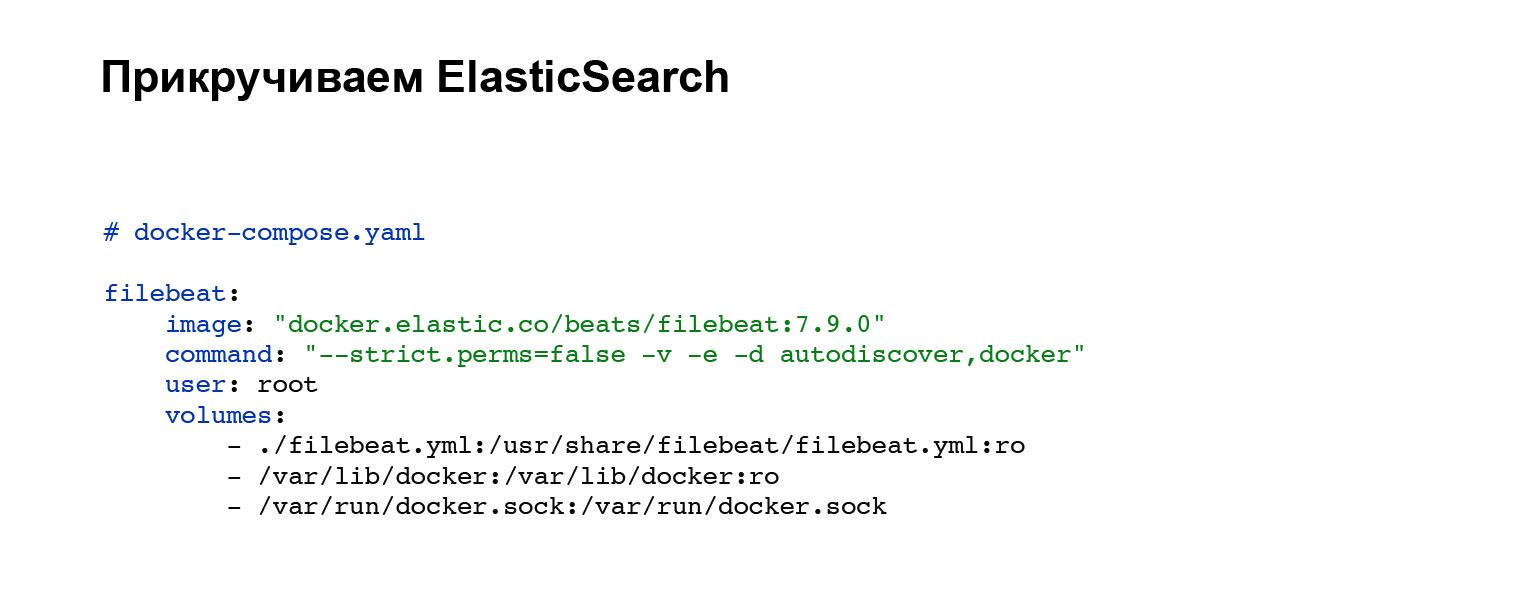
First of all, we will need to deploy an agent that will send our logs to Elasticsearch. You register an account with Elasticsearch and then add to your docker-compose. If you do not have docker-compose, you can raise with handles or on your system. In our case, the following code block is added, integration into docker-compose. Everything, the service is configured. And you can see the filebeat.yml config file in the volumes block.
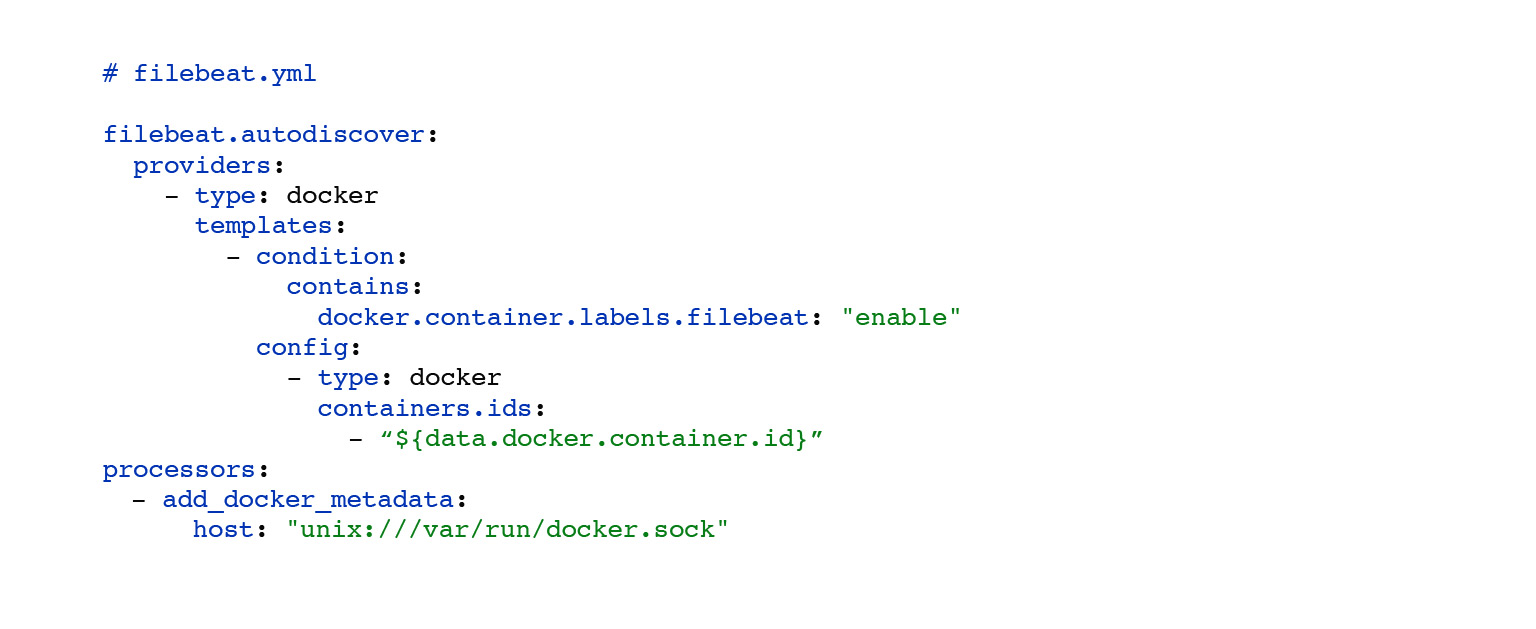
Here is an example filebeat.yml. Here we have set up an automatic search for the logs of docker containers that are spinning nearby. The choice of these logs has been customized. By condition, you can set, hang labels on your containers, and depending on this, your logs will be sent only from certain containers. The processors: add_docker_metadata block is simple. We add a little more information about your logs in the docker context to the logs. Optional, but cool.
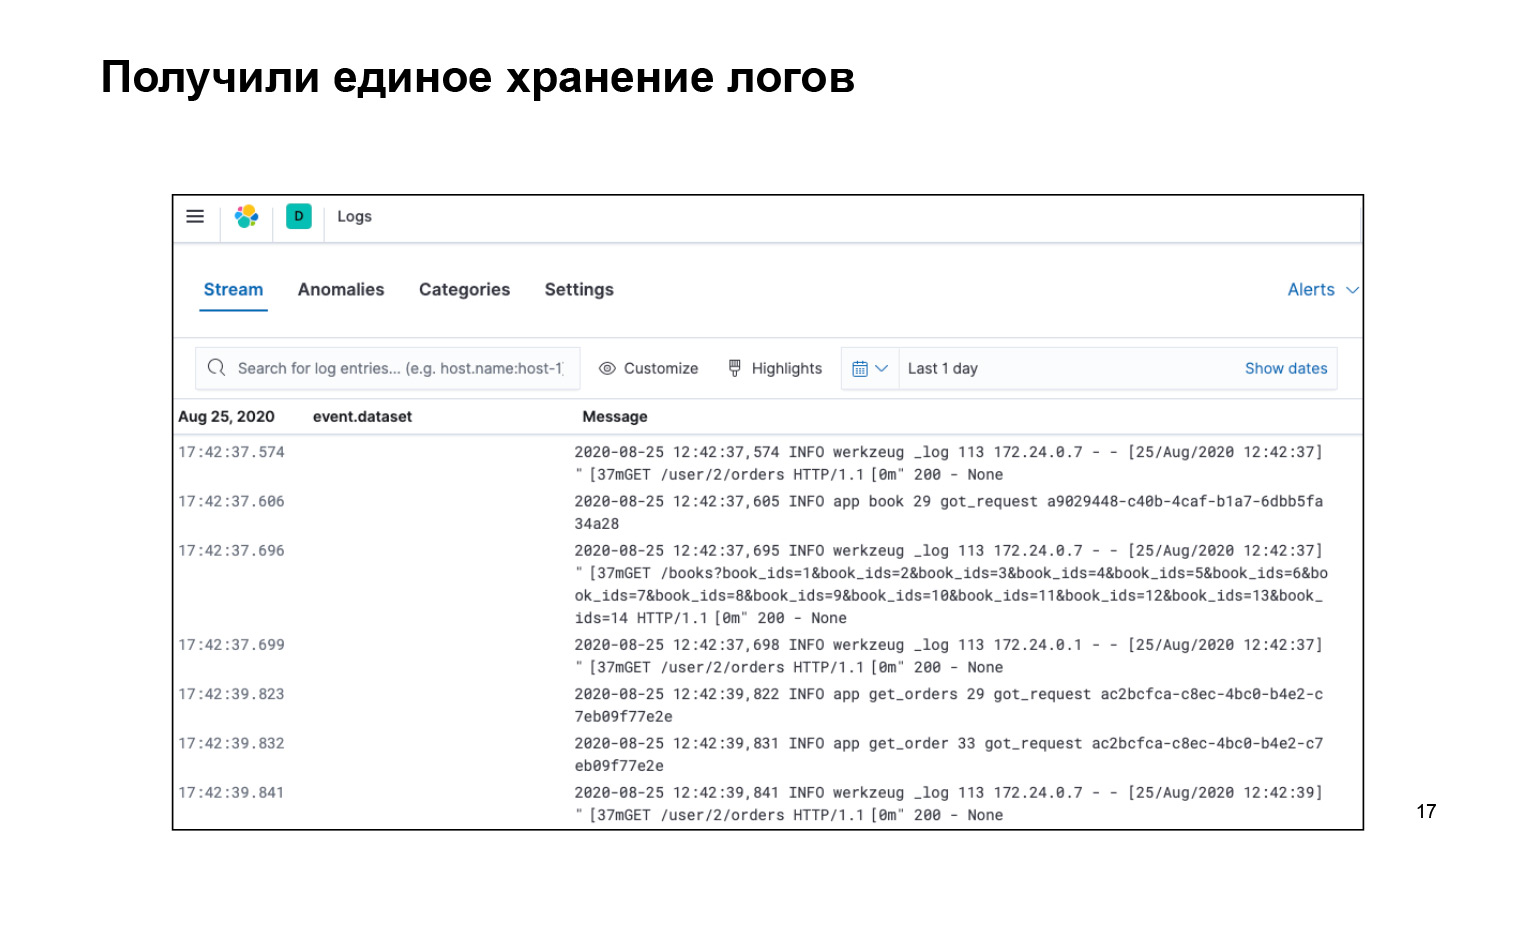
What have we got? That's all we wrote, all the code, very cool. At the same time, we got all the logs in one place and there is an interface. We can search our logs, here is the search bar. They are delivered. And you can even turn it on live so that the stream flies to our logs in the interface, and we saw it.

Here I myself would have asked: why, how to buckle something? What is a log search, what can be done there?
Yes, out of the box in this approach, when we have text logs, there is a small gag: we can set a request by the text, for example message: users. This will print to us all logs that have the users substring. You can use asterisks, most other unix wild cards. But it seems that this is not enough, I want to make it harder so that you can warm up in Nginx earlier, as we can.
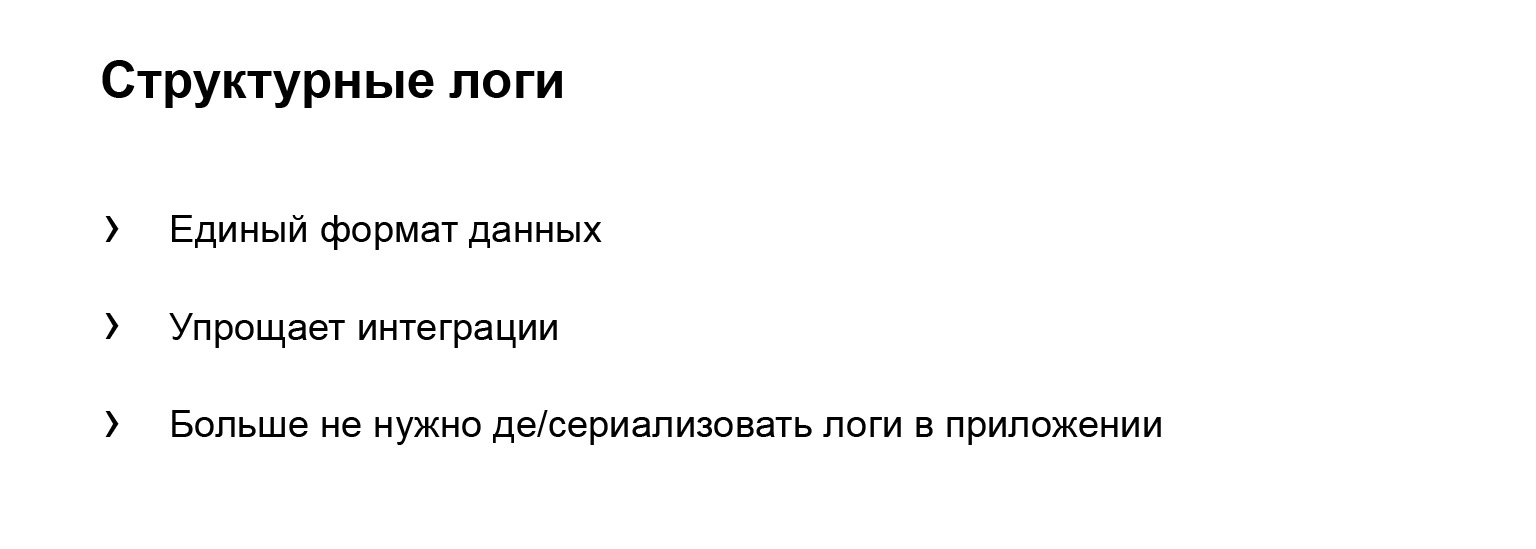
Let's step back from Elasticsearch a bit and try to do it not with Elasticsearch, but with a different approach. Let's consider structural logs. This is when each of your log entries is not just a text line, but a serialized object with attributes that any of your third-party systems can serialize to get a ready-made object.
What are the advantages of this? It is a uniform data format. Yes, objects can have different attributes, but any external system can read JSON and get some kind of object.
Some kind of typing. This simplifies integration with other systems: no need to write deserializers. And just deserializers are another point. You do not need to write prosaic texts in the application. Example: "User came with such and such an ID specialist, with such and such an order." And all this needs to be written every time.
It bothered me. I want to write: "A request has arrived." Further: “So-and-so, so-and-so, so-and-so,” very simple, very IT-style.
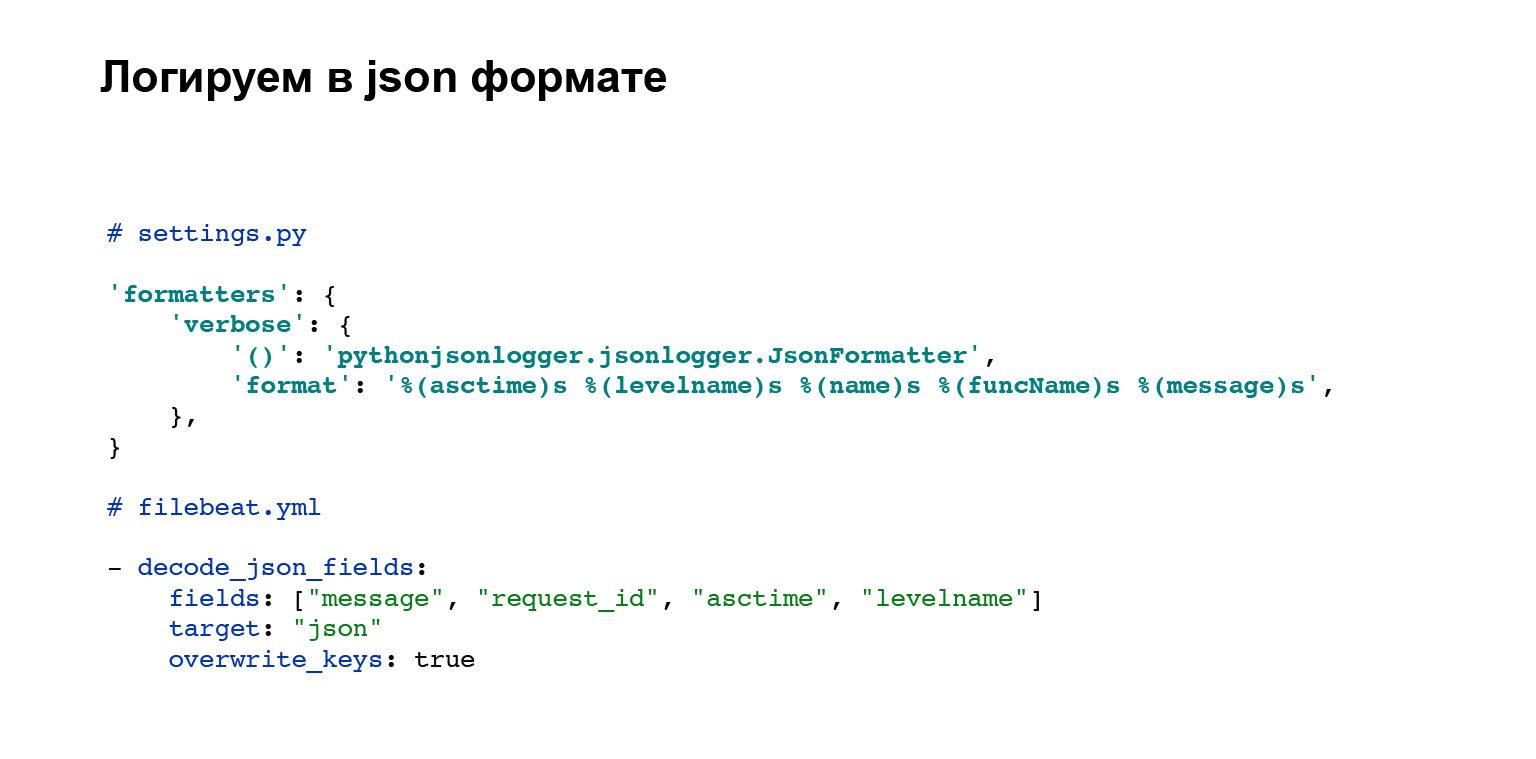
Let's move on. Let's agree: we will log in JSON format, this is a simple format. Elasticsearch is immediately supported, filebeat, which we serialize and try to file. It's not very difficult. First, you add the settings file from the pythonjsonlogger library to the JSONFormatter formatters block, where we store the configuration. This may be a different place in your system. And then in the format attribute you pass which attributes you want to add to your object.
The block below is a configuration block that is added to filebeat.yml. Here, out of the box, there is a filebeat interface for parsing JSON logs. Very cool. It's all. You don't have to write anything else for this. And now your logs look like objects.
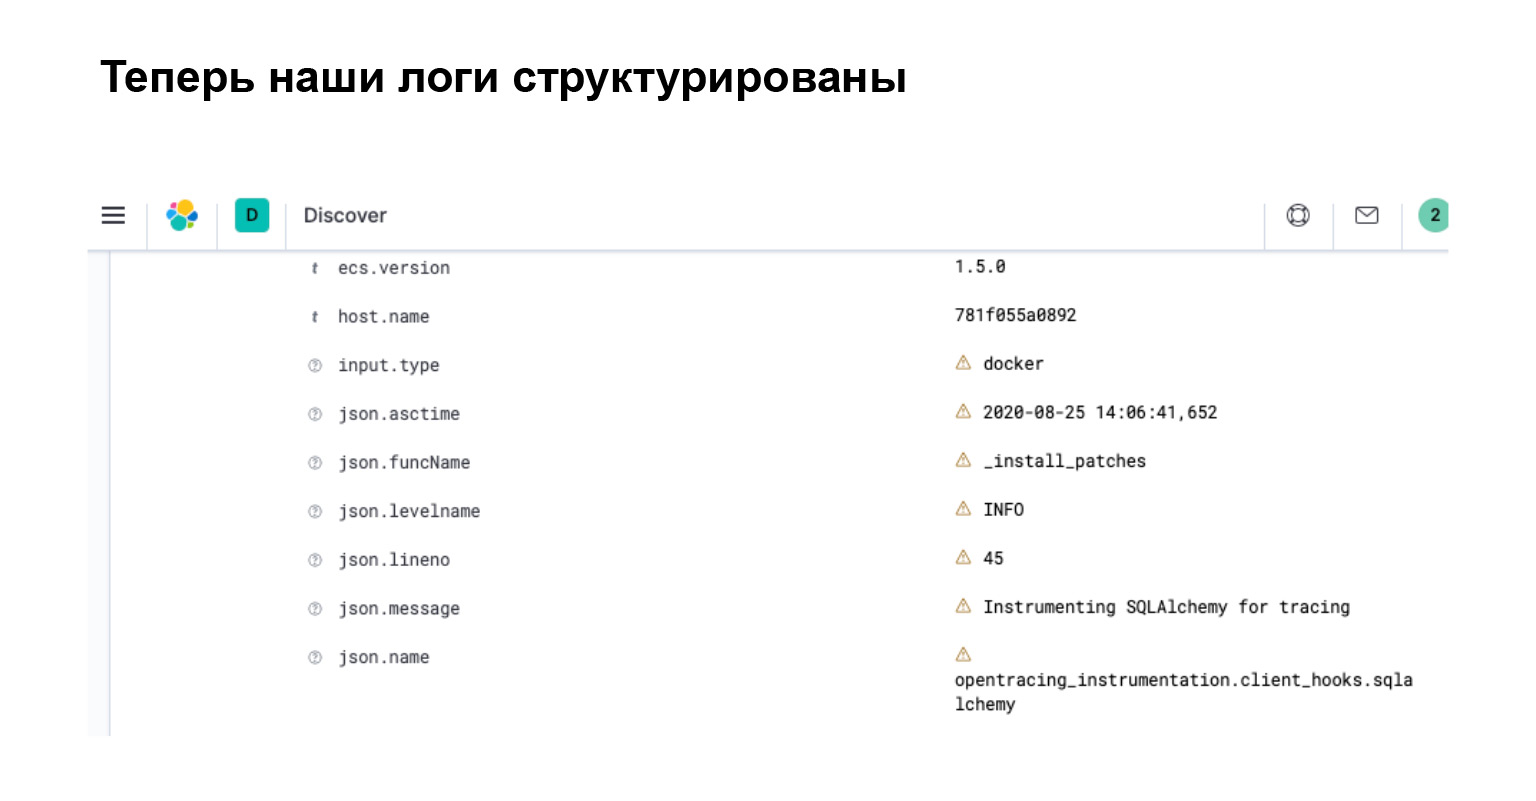
What did we get in Elasticsearch? In the interface, you immediately see that your log has turned into an object with separate attributes, by which you can search, create filters and make complex queries.
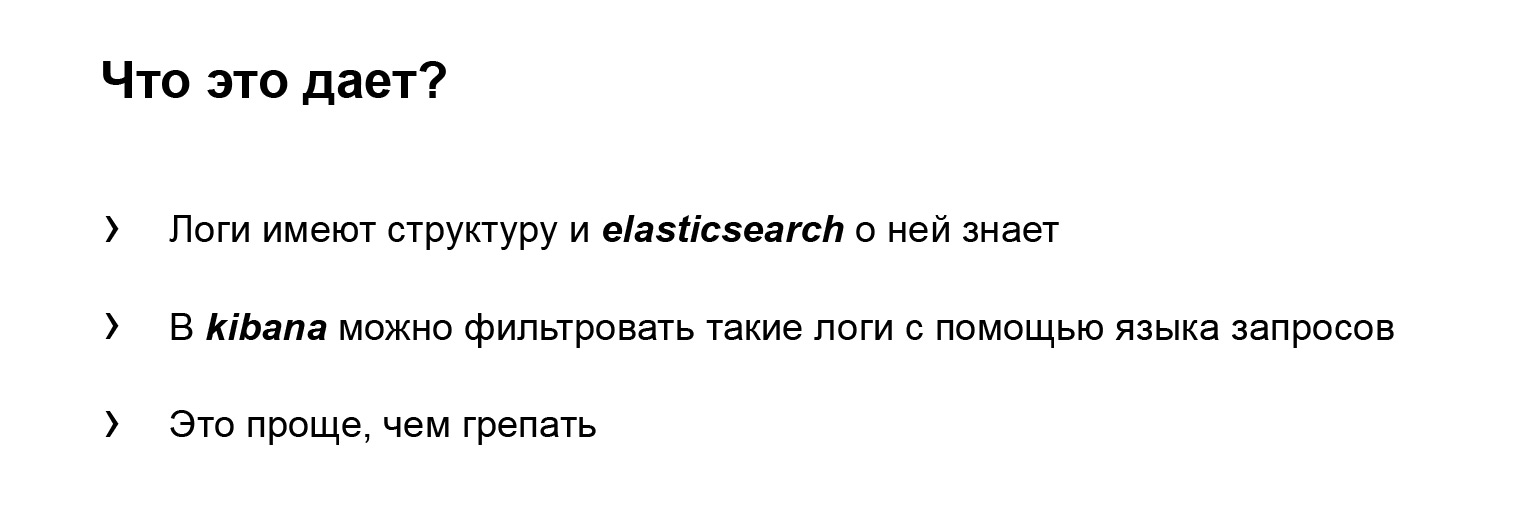
Let's summarize. Now our logs have a structure. They are easy to use and can be used to write intelligent queries. Elasticsearch is aware of this structure since it parsed all of these attributes. And in kibana, which is an interface for Elasticsearch, you can filter such logs using a specialized query language that Elasticsearch provides.
And it's easier than paddling. Grep has a rather complicated and cool language. There is a lot to write about. Many things can be made easier in kibana. With this sorted out.
Problem 2. Brakes
The next problem is brakes. In microservice architecture, there are always and everywhere brakes.

Here's a little context, I'll tell you a story. The manager, the main character of our project, comes running to me and says: “Hey, hey, the office is slowing down! Danya, save, help! "
We do not know anything yet, we climb into our logs in Elasticsearch. But let me tell you what actually happened.
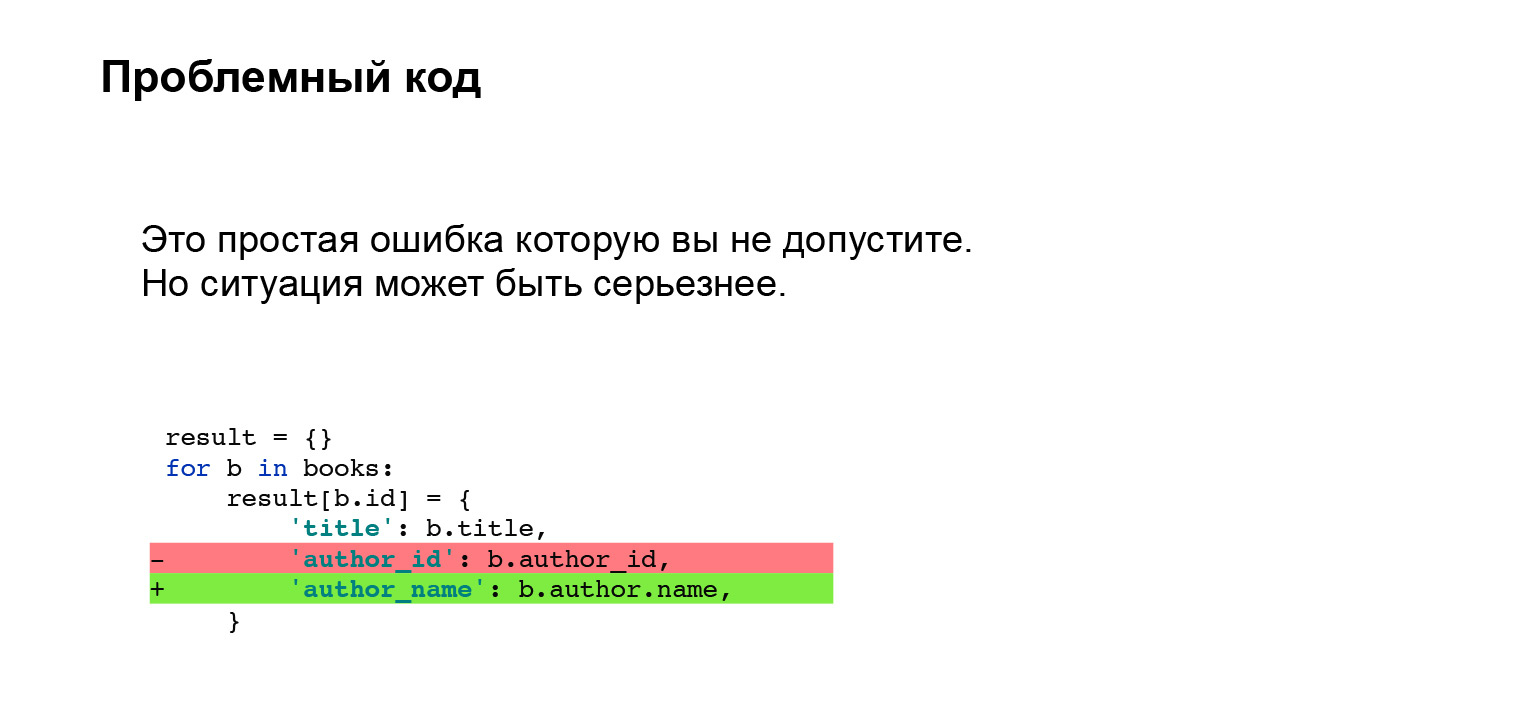
Erast added a feature. In books, we now display not the author's ID, but his name right in the interface. Very cool. He did it with the following code. A small piece of code, nothing complicated. What could go wrong?
You can say with a trained eye that you cannot do this with SQLAlchemy, and with another ORM, too. You need to do a pre-cache or something else so that you don't go to the database with a small subquery in a loop. An unpleasant problem. It seems that such a mistake should not be allowed at all.
Let me tell you. I had experience: we worked with Django, and we had a custom pre-cache implemented in our project. Everything went well for many years. At some point, Erast and I decided: let's keep up with the times, update Django. Naturally, Django doesn't know anything about our custom cache, and the interface has changed. Prikash fell off silently. It was not caught on testing. The same problem, it was just more difficult to catch.
What's the problem? How can I help you solve the problem?

Let me tell you what I did before I started solving the problem of finding brakes.
The first thing I do is go to Elasticsearch, we already have it, it helps, there is no need to run around the servers. I go to the logs, looking for the cabinet logs. I find long queries. I play it on a laptop and see that it is not the office that is holding back. Slows down Books.
I run into the Books logs, find problematic queries - in fact, we already have it. I reproduce Books in the same way on a laptop. Very complex code - I don't understand anything. I'm starting to debug. Timings are quite difficult to catch. Why? It is quite difficult to determine this internally in SQLAlchemy. I write custom time loggers, localize and fix the problem.

It hurted me. Difficult, unpleasant. I cried. I would like this process of finding a problem to be faster and more convenient.
Let's formalize our problems. It is difficult to search the logs for what is slowing down, because our log is a log of unrelated events. We have to write custom timers that show us how many blocks of code have been executed. Moreover, it is not clear how to log the timings of external systems: for example, ORM or requests libraries. We need to embed our timers inside or with some kind of Wrapper, but we will not find out why it slows down inside. Complicated.
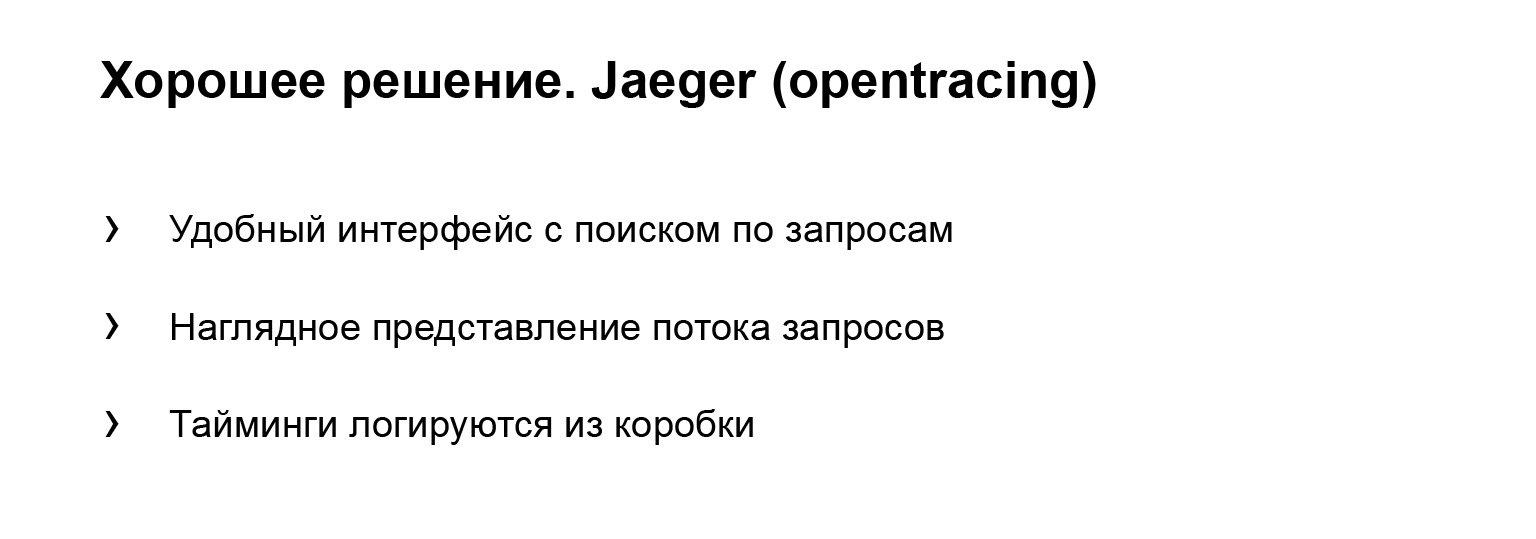
A good solution I found is Jaeger. This is an implementation of the opentracing protocol, so let's implement tracing.
What does Jaeger give? It is a user-friendly interface with search queries. You can filter long queries or do it by tags. A visual representation of the flow of requests, a very beautiful picture, I will show it a little later.
Timings are logged out of the box. You don't have to do anything with them. If you need to check how long it is executing about some custom block, you can wrap it in timers provided by Jaeger. Very comfortably.
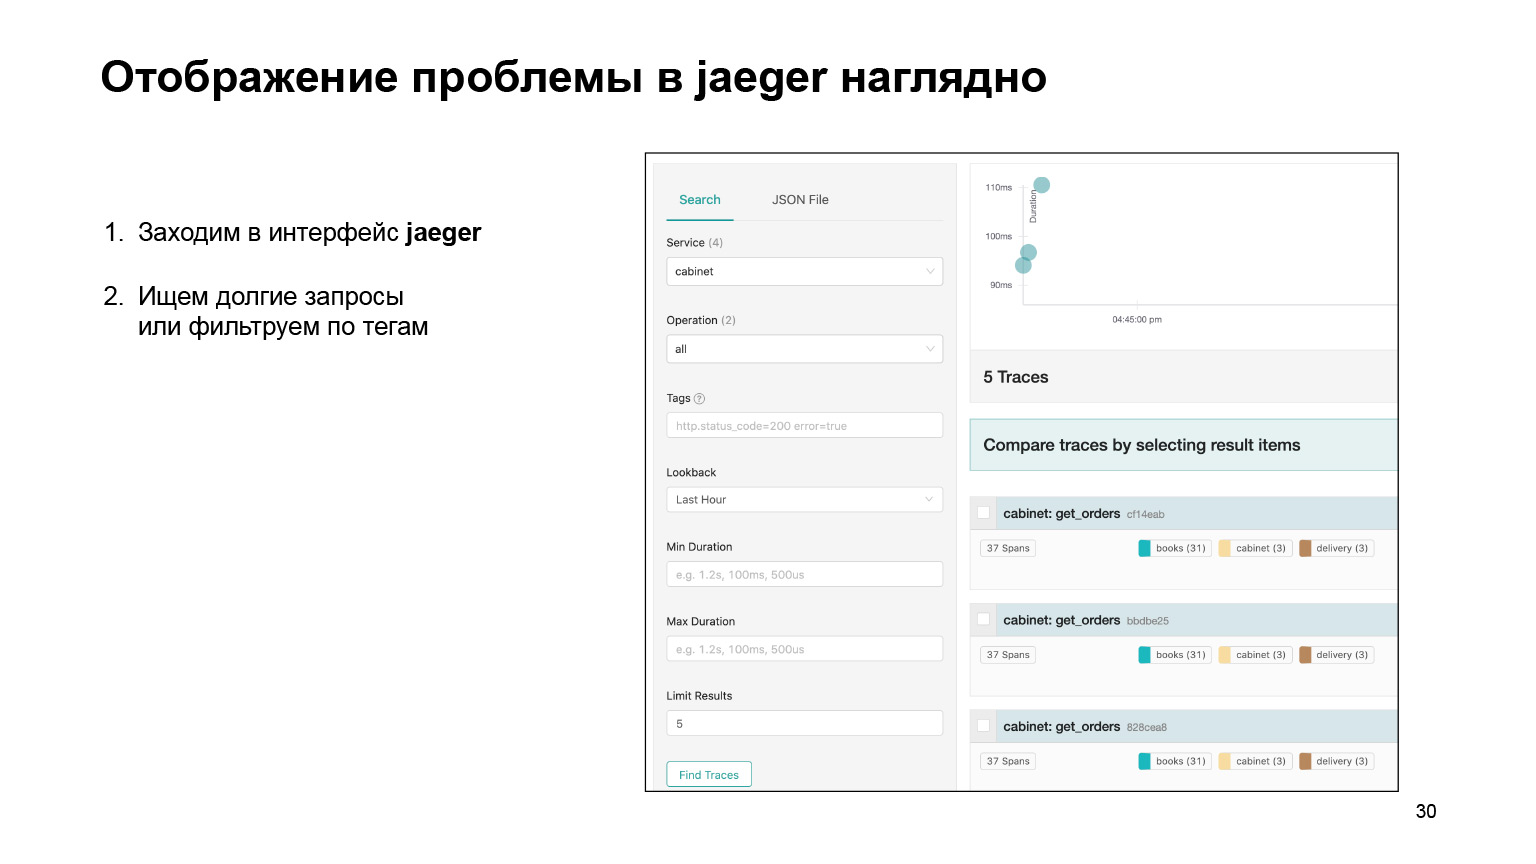
Let's see how it was possible to find the problem in the interface and localize it there. We go into the Jaeger interface. This is how our requests look like. We can search for requests for an account or another service. We immediately filter long queries. We are interested in the long ones, they are quite difficult to find from the logs. We get their list.
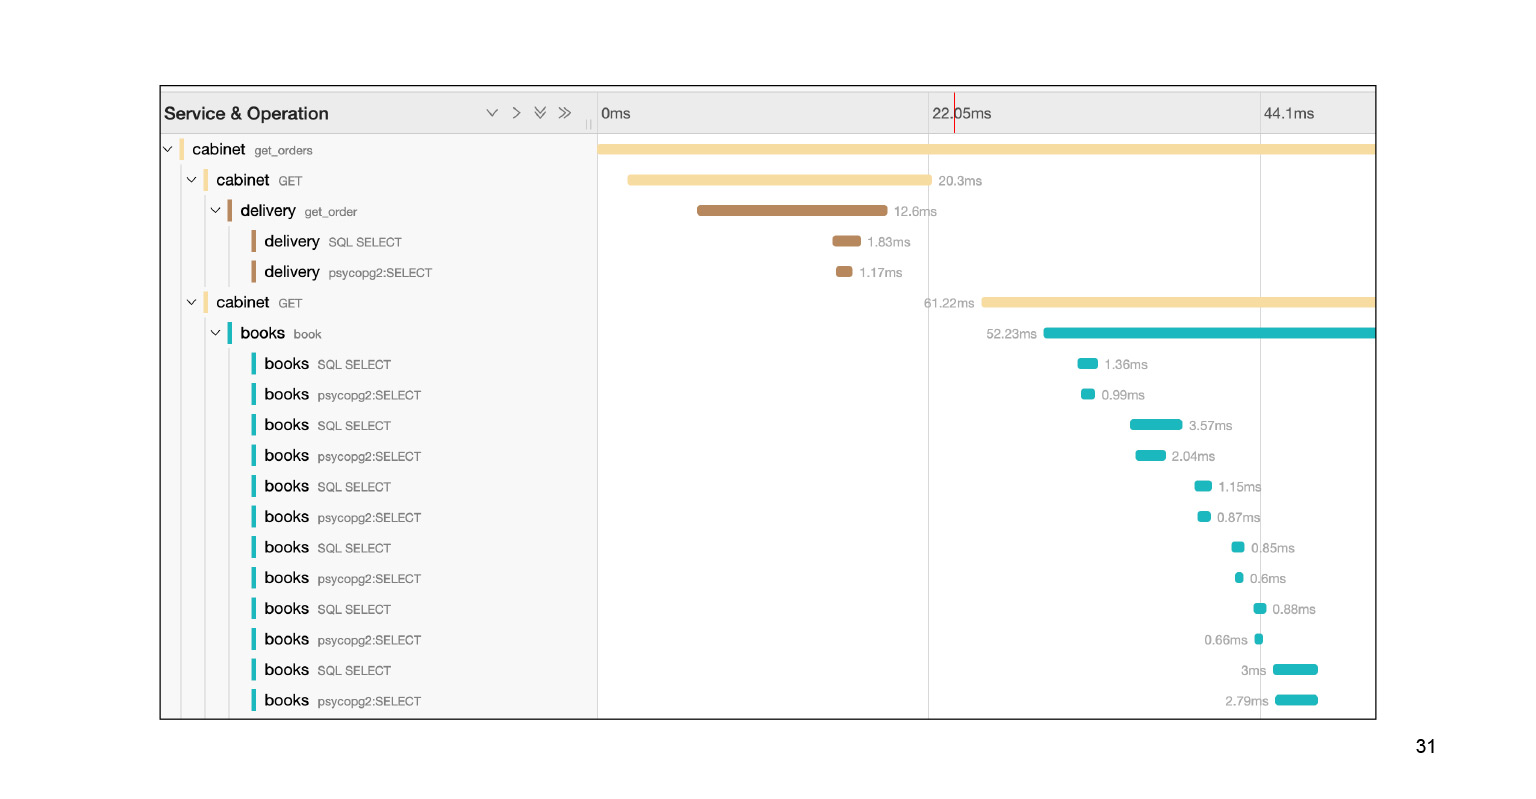
We fall into this query, and we see a big footcloth of SQL subqueries. We can clearly see how they were executed in time, which code block was responsible for what. Very cool. Moreover, in the context of our problem, this is not the entire log. There is still a large footcloth two or three slides down. We localized the problem pretty quickly in Jaeger. After solving the problem, what can the context that Jaeger provides help us?
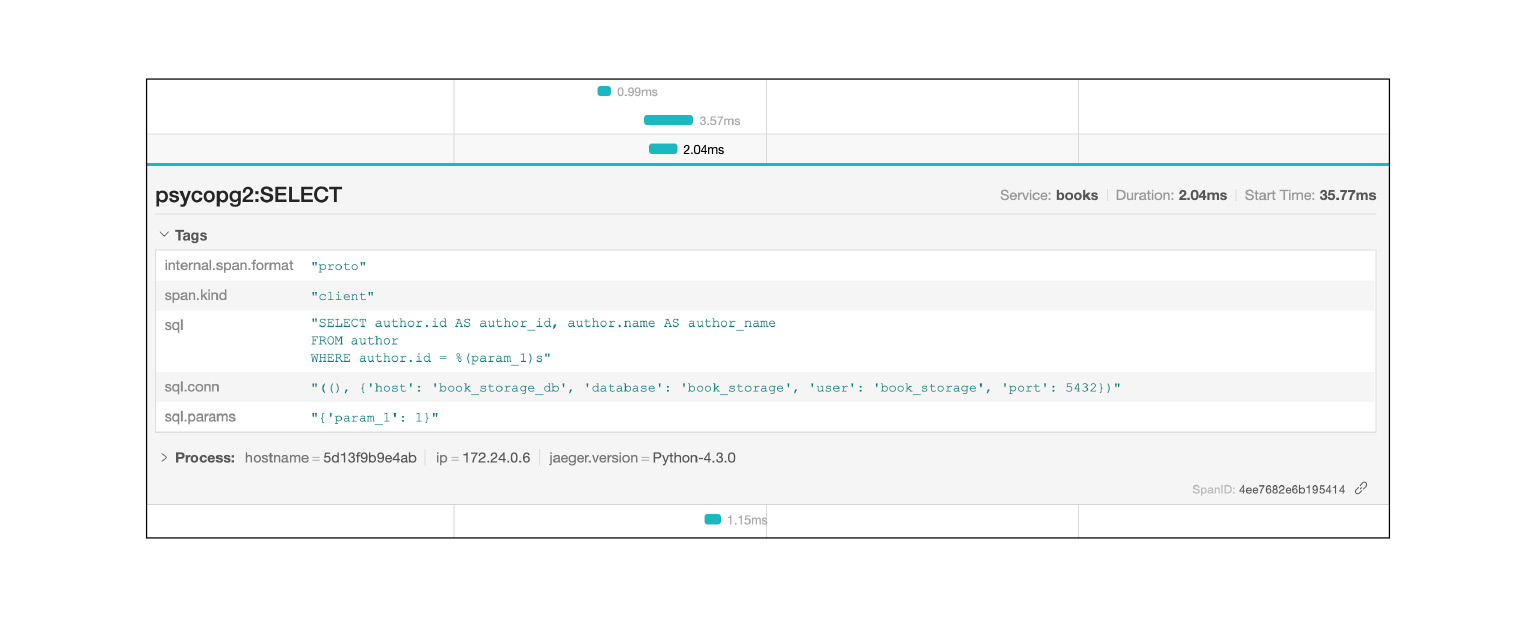
Jaeger logs, for example, SQL queries: you can see which queries are repeated. Very fast and cool.
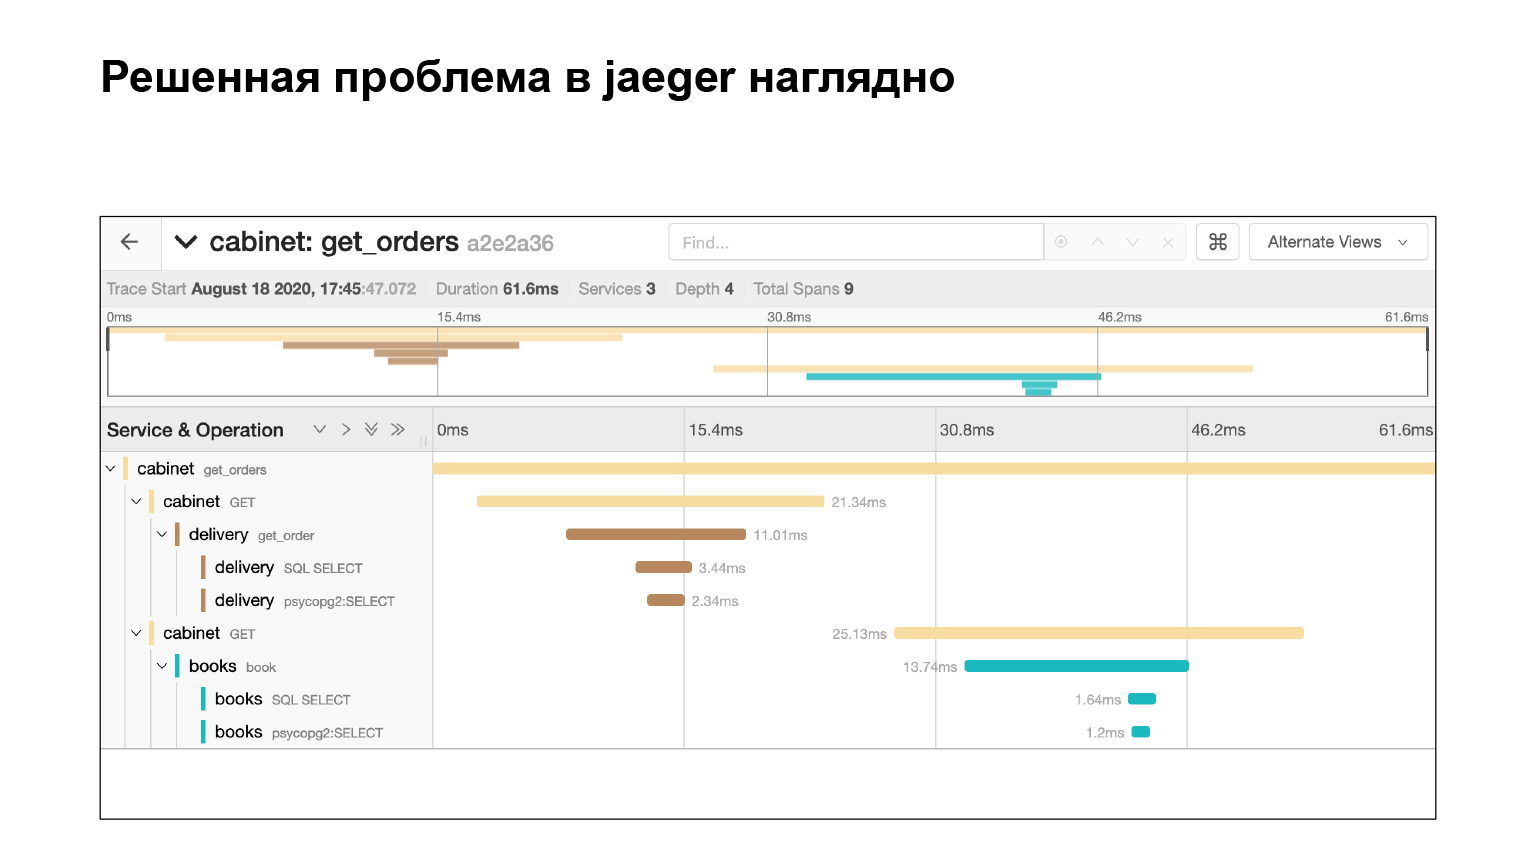
We solved the problem and immediately see in Jaeger that everything is fine. We check by the same query that we now have no subqueries. Why? Suppose we check the same request, find out the timing - look in Elasticsearch how long the request was executed. Then we will see the time. But this does not guarantee that there were no subqueries. And here we see it, cool.
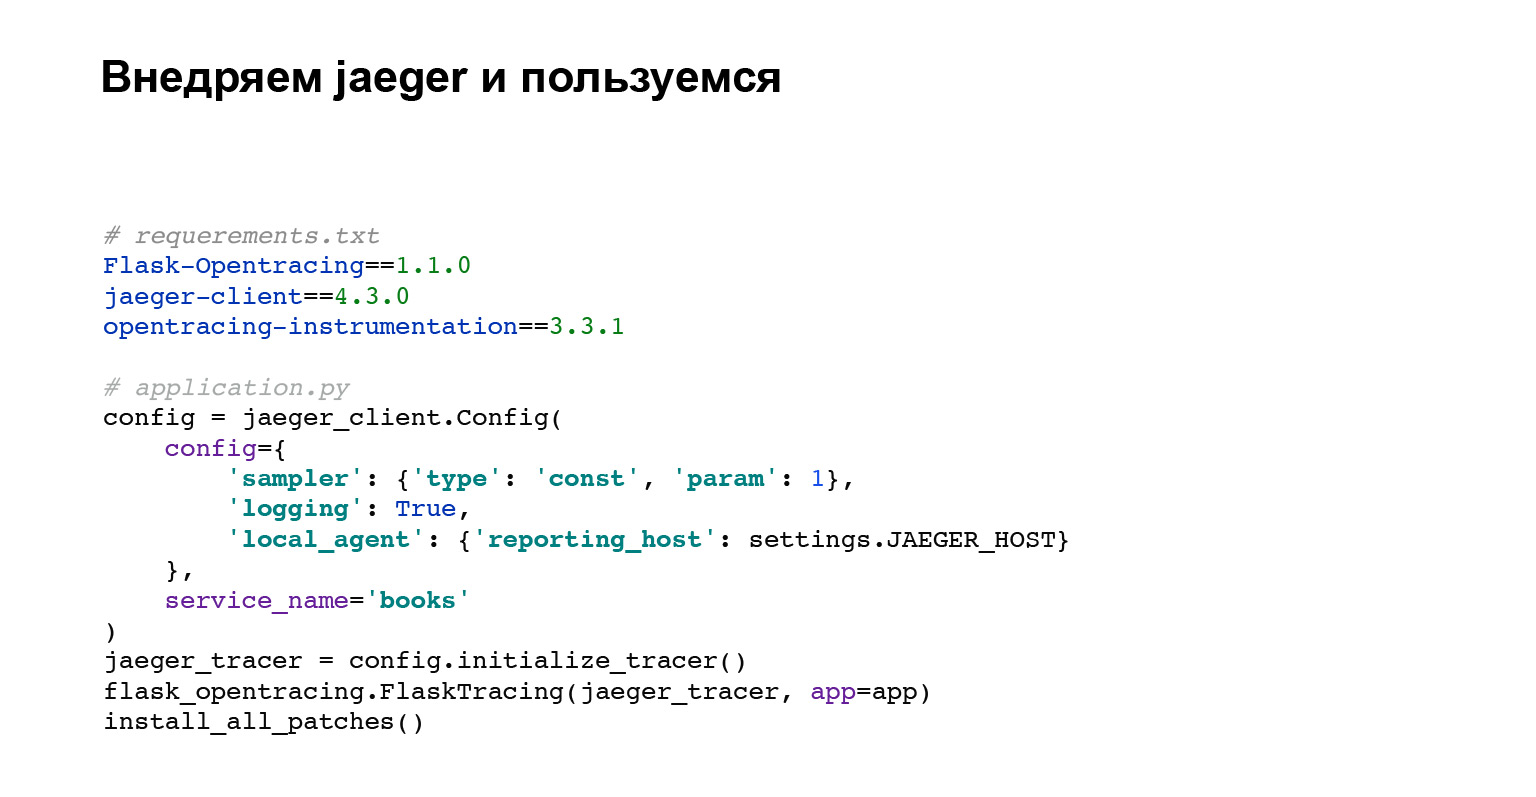
Let's implement Jaeger. Not a lot of code is needed. You add dependencies for opentracing, for Flask. Now about what code we are doing.
The first block of code is the Jaeger client setup.
Then we set up integration with Flask, Django, or any other framework that has integration.
install_all_patches is the very last line of code and the most interesting. We patch most external integrations by interacting with MySQL, Postgres, requests library. We are patching all of this and that is why in the Jaeger interface we immediately see all queries with SQL and which of the services our required service went to. Very cool. And you didn't have to write much. We just wrote install_all_patches. Magic!
What have we got? Now you don't need to collect events from logs. As I said, logs are disparate events. In Jaeger, this is one big event that you see the structure of. Jaeger allows you to catch bottlenecks in your application. You just search for long queries, and you can analyze what is going wrong.
Problem 3. Errors
The last problem is errors. Yes, I'm being cunning. I will not help you get rid of errors in the application, but I will tell you what you can do next.
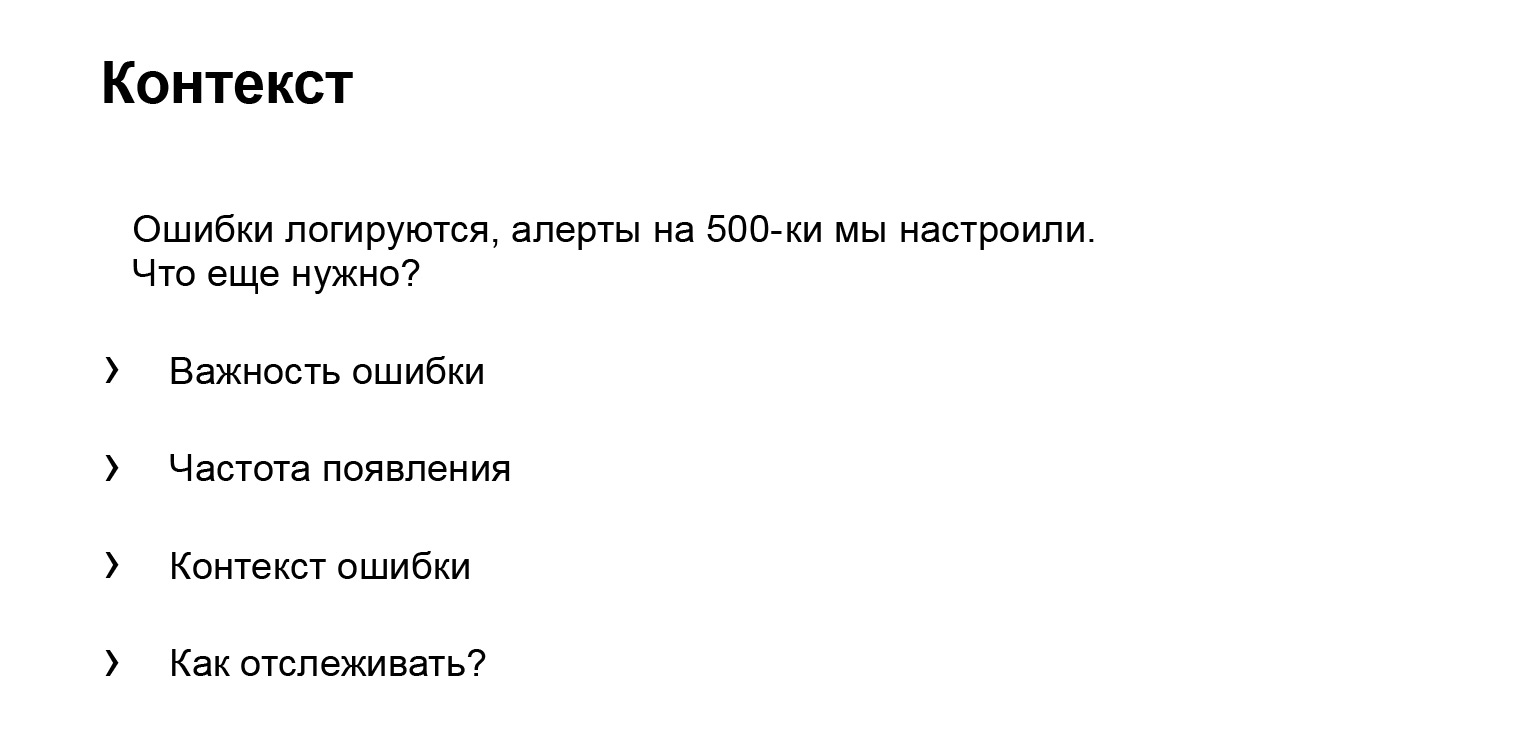
Context. You can say: “Danya, we are logging errors, we have alerts for five hundred, we have configured them. What do you want? We logged, we log and we will log and debug.
You don't know the importance of the error from the logs. What is importance? Here you have one cool error, and the error of connecting to the database. The base just flopped. I would like to immediately see that this mistake is not so important, and if there is no time, ignore it, but fix the more important one.
The error rate is a context that can help us debug it. How to track errors? Let's continue, we had a mistake a month ago, and now it appeared again. I would like to immediately find a solution and correct it or compare its appearance with one of the releases.
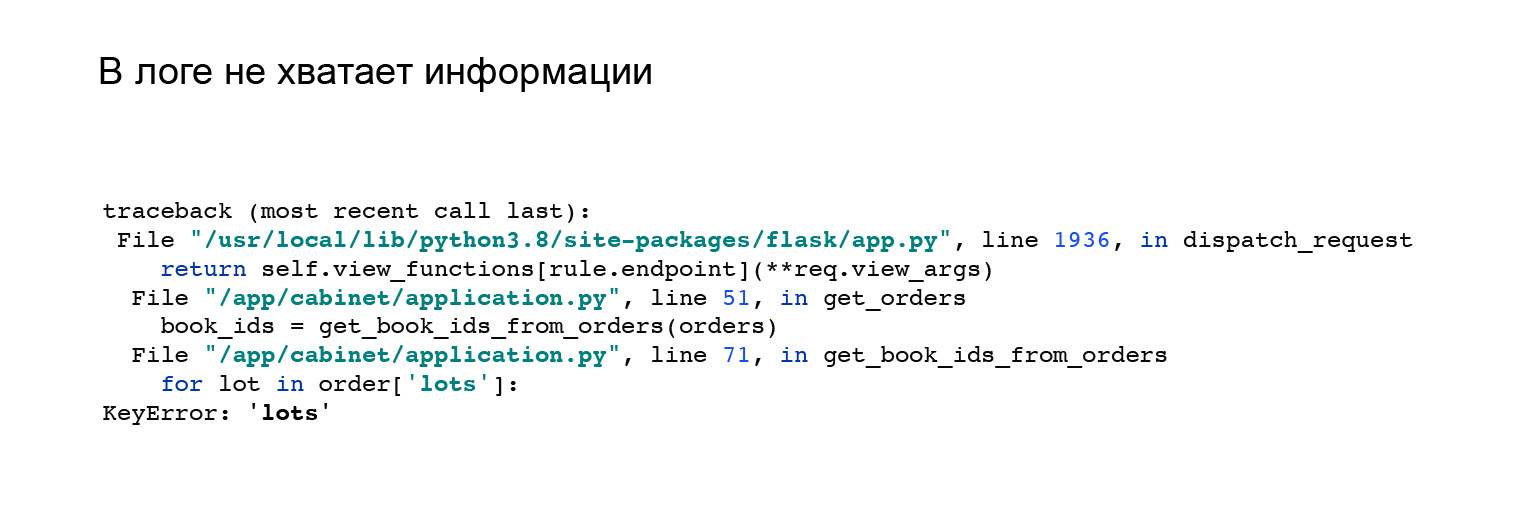
Here's a good example. When I saw the integration with Jaeger, I changed my API a little. I have changed the format of the application response. I got this error. But it is not clear in it why I do not have a key, lots in the order object, and there is nothing that would help me. Like, see the error here, reproduce it and catch it yourself.
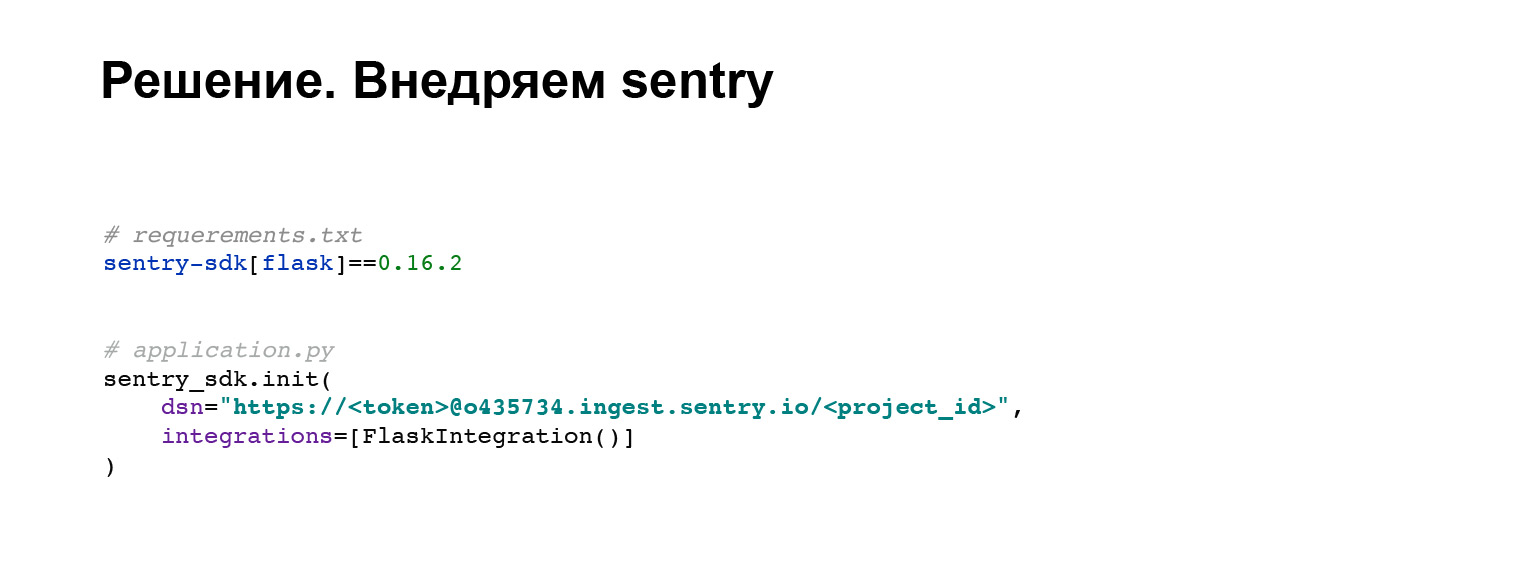
Let's implement sentry. This is a bug tracker that will help us in solving similar problems and finding the context of the error. Take the standard library maintained by the sentry developers. In four lines of code, we add it to our application. Everything.
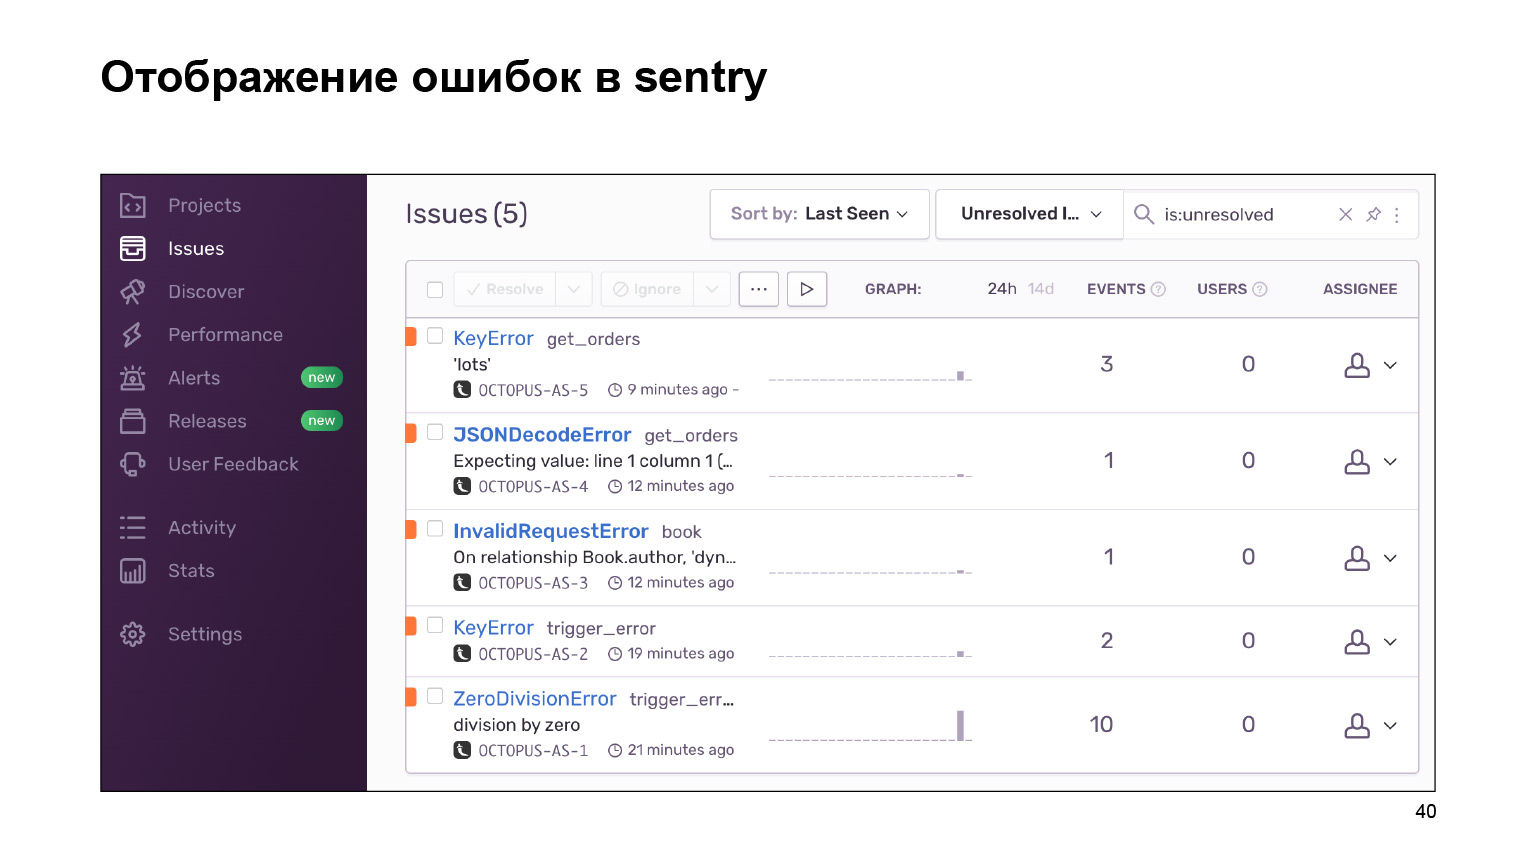
What did we get on the way out? Here is a dashboard with errors that can be grouped by project and you can follow. A huge footcloth of error logs is grouped into identical, similar ones. Statistics are provided on them. And you can also deal with these errors using the interface.
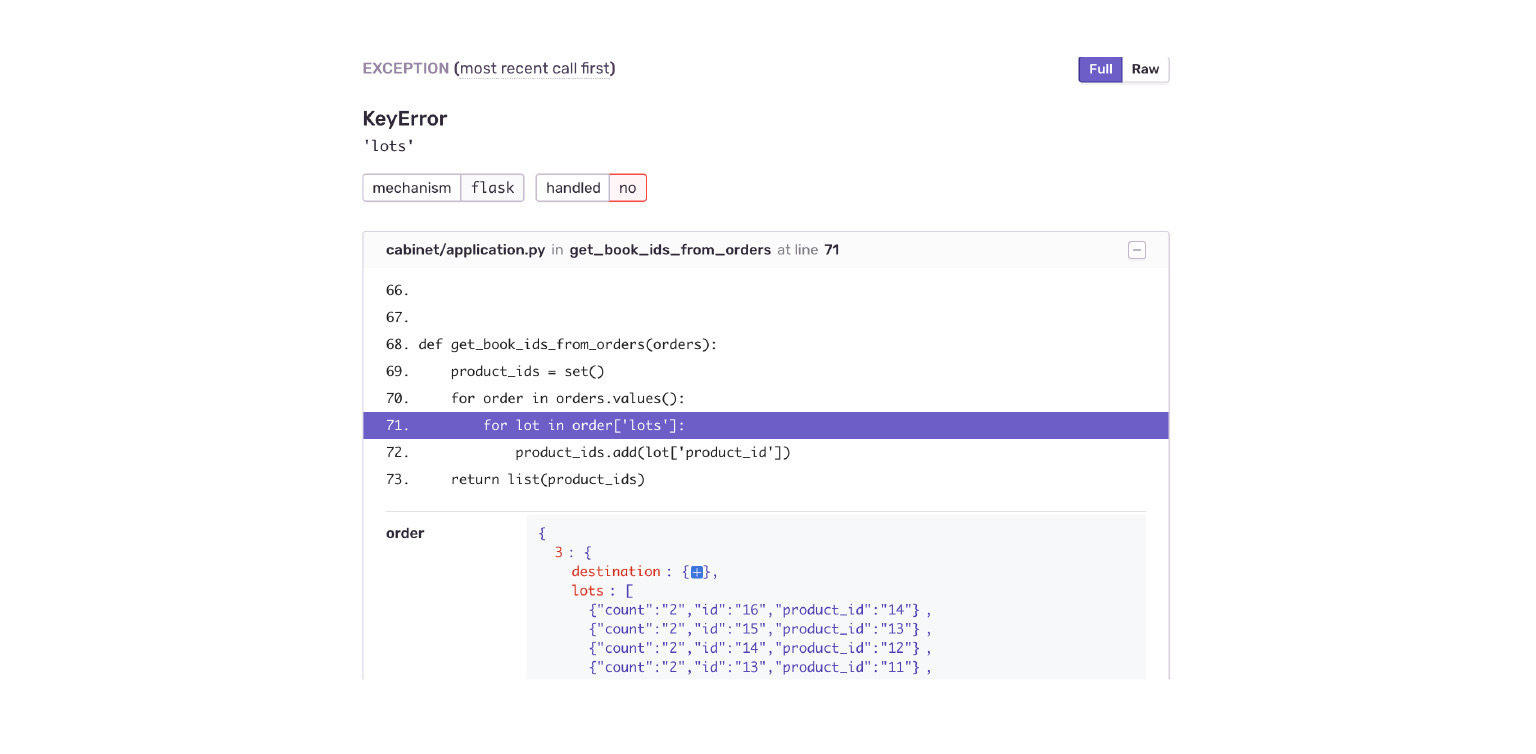
Let's look at our example. Falling into a KeyError. We immediately see the context of the error, what was in the order object, what was not there. I immediately see by mistake that the Delivery application has given me a new data structure. The cabinet is simply not ready for this.
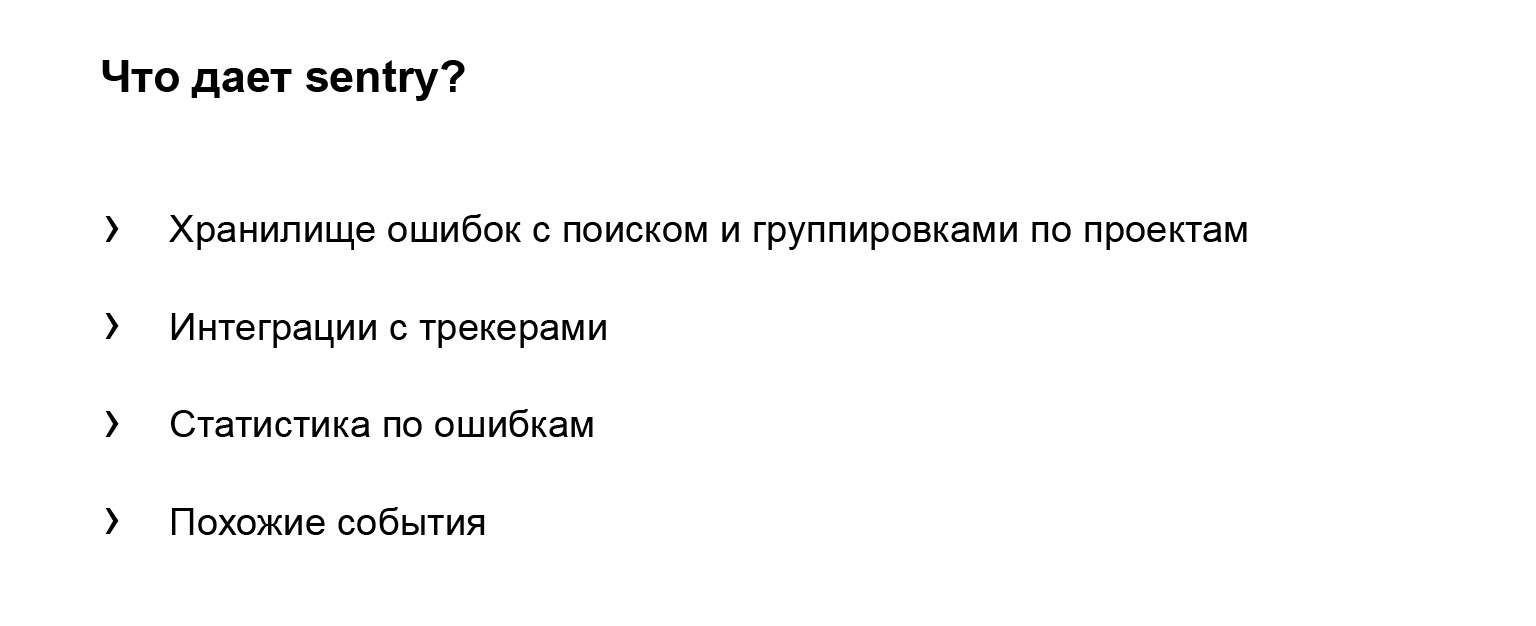
What does sentry give besides what I've listed? Let's formalize.
This is the error store where you can look for them. There are handy tools for this. There is a grouping of errors - by projects, by similarity. Sentry provides integrations with different trackers. That is, you can track your mistakes, work with them. You can just add the task to your context and that's it. This helps in development.
Error statistics. Again, it's easy to compare it with rolling out a release. Sentry will help you with this. Similar events that happened next to the error can also help you find and understand what led to it.

Let's summarize. We have written an application that is simple but meets the needs. It helps you develop and maintain it in its life cycle. What have we done? We have collected logs in one repository. This gave us the opportunity not to look for them in different places. Plus, we now have a log search and third-party features, our tools.
Integrated tracing. Now we can visually monitor the data flow in our application.
And added a handy tool for dealing with errors. They will be in our application, no matter how hard we try. But we will fix them faster and better.
What else can you add? The application itself is ready, there is a link, you can see how it is done. All integrations rise there. For example, integration with Elasticsearch or tracing. Come in and see.
Another cool thing that I didn't have time to cover is requests_id. Almost no different from trace_id, which is used in traces. But we are responsible for requests_id, this is its most important feature. The manager can come to us immediately with requests_id, we don't need to look for him. We will immediately start solving our problem. Very cool.
And don't forget that the tools we have implemented are overhead. These are issues that need to be addressed for every application. You cannot thoughtlessly implement all our integrations, make your life easier, and then think about what to do with the inhibiting application.
Check it out. If it doesn't affect you, cool. You only got the pluses and do not solve the problems with the brakes. Don't forget this. Thank you all for listening.