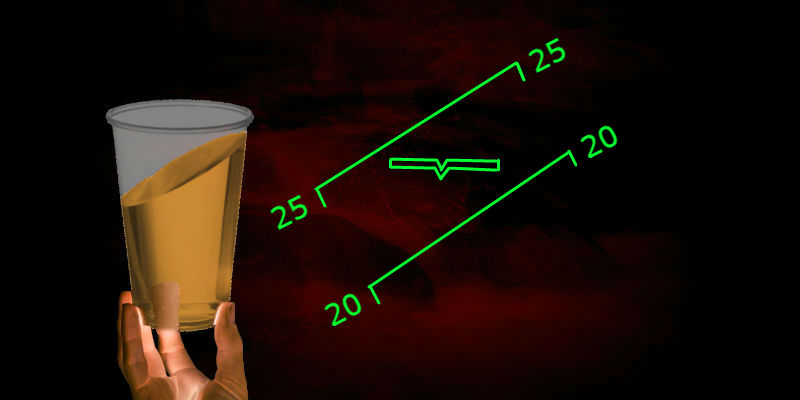
Purpose and scope of the artificial horizon
An artificial horizon in the narrow sense considered here is a visualization of the tilt of an object relative to the local vertical, used to control its movement. The slope is defined by the values of the two Euler angles, roll and pitch . Seafarers prefer the synonym “trim” to the aviation term “pitch”.
Related to the artificial horizon (but not quite synonymous) Russian-language terms: "artificial horizon", "flight command device". In English, the expressions "attitude indicator" , "artificial horizon" or "gyro horizon" are used .
Known visualization techniques
Most of the work on finding successful solutions in the field of pitch and roll indication has been done in the interests of aviation. There is a simple explanation for this: the pilot must read information quickly, and any mistake in his perception of space threatens to become fatal.
Most of the known solutions in the field of roll and pitch indication are based on the use of an aircraft silhouette and a special background. General features:
- the background is divided into two parts, symbolizing heaven and earth, by a line representing the horizon;
- the silhouette of the aircraft is a simplified rear view, contrasting in color with the background;
- the roll angle is determined by the indicator as the angle between the symbolic horizon line and the line connecting the wingtips of the silhouette (usually a reference scale is present for accurate reading);
- the pitch angle is measured along a scale perpendicular to the conditional horizon according to the position of the control point in the center of the silhouette.

Systems implemented in mass production have a number of common solutions:
- information is given by the relative position of the silhouette and the background;
- the change in the roll angle is associated with the angular movement of the silhouette relative to the background;
- the change in the pitch angle is associated with the linear displacement of the silhouette relative to the background.
But it is not hard to guess that the desired relative motion can be realized in several different ways. After a lot of trial and error of the last century, aviation evolution has left two viable combinations:
1. Fixed silhouette, moving in roll and pitch background. Used names: "direct indication", "view from the airplane to the ground", less often "egocentric indication".
2. A silhouette moving only along the roll, a background moving only along the pitch. Used names: "reverse indication" and "view from the ground to the plane", less often "geocentric indication".

Note that the names of clause 2 apply to the system as a whole, but reflect only the principle of roll angle indication adopted in it. The pitch angle indication in both systems used is "straight" and "egocentric".
In existing flight simulators, such as Microsoft Flight Simulator and Digital Combat Simulator , both types of displays can be seen in action.
It is worth noting that not all known solutions fit into the above pattern. For an example of going beyond the designated framework, let us consider two patents for inventions: RU 2561311 and RU 2331848.
The first patent is devoted to the " attitude indicator with pitch and roll indicators spaced in height", its authors: Putintsev V.I. and Lituev N.A. The scheme below is taken from the patent.

If necessary, you can find a decoding of designations and a description of the work in the text of the original source... On the whole, the idea of the invention is quite simple: the idea of a “view from the ground to an airplane” is realized both in roll and pitch (complete “geocentrism”), but the indication is divided into two independent components.
The second invention has a more complex name: "Flight command device for logical indication of the position and control of the aircraft in space." Authors of the patent: A.P. Plentsov and N.A. Zakonova. The idea of pitch and roll indication is rather unusual here.
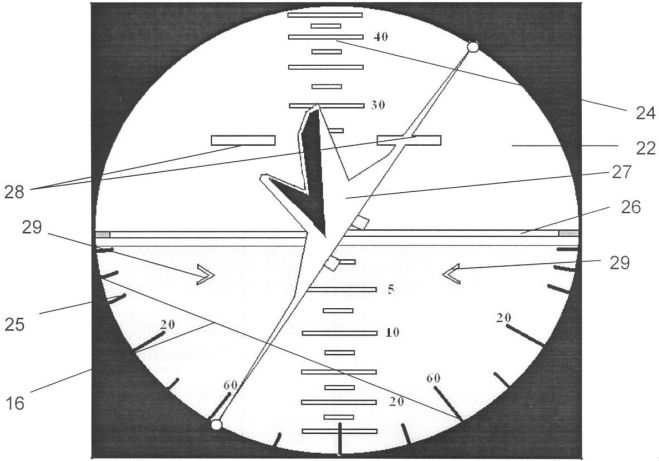
An explanation of the designations of the circuit, a description of the device, a comparison with analogs and additional circuits with slight differences in design are given in the patent .
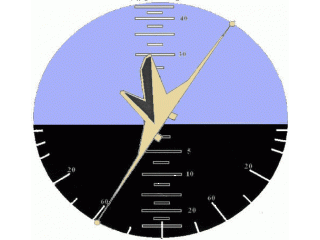
One thing in common with the previous invention is the concept of geocentrism for both channels. At the same time, the artificial horizon has only one “airplane symbol”, as in the existing models, but this is no longer a silhouette, but a three-dimensional model - a “volumetric model”. If the roll movement turns out to be similar to that implemented in the "reverse" indication, then pitching and diving on this device look original.
There are a number of factors holding back innovation in the design of real-world display systems. For example, one of the reasonable grounds for conservatism is the desire to preserve the continuity of the skills acquired by the operator, including the skills of perceiving information. Computer games can afford much more creativity, therefore, without delving into a comparative analysis of solutions, we will take as a basis the invention that looks the most effective.
Solution requirements
Before starting to write the code, let's define the task:
1. It is necessary to write the drawAttitude () function, which draws the artificial horizon indicator by means of canvas based on the invention of A.P. Plentsov and N.A. Zakonova
2. The function takes the canvas context , coordinates the center of the indicator, the values of the roll and pitch angles in degrees, the radius of the indicator face.
3. Values of the pitch angle are limited to the interval from minus 30 to plus 30 degrees.
4. The values of the roll angle are limited to the interval from minus 45 to plus 45 degrees.
5. If the value of the argument goes beyond those specified in p. 3 and 4 limits the indicator shows the nearest permitted value.
Function creation
The function code includes the following parts:
1. Checking the entered values for exceeding the limits.
2. Converting angles to radians.
3. Scaling the characteristic size of the "layout" and font by the value of the indicator radius.
4. Drawing the components:
a) Indicator body.
b) Layout.
c) Pitch and roll scales.
The function below is written in this order, and its parts are separated by comments.
Complete code
index.html:
attitude.js:
<!DOCTYPE html>
<html>

<head>
  <title>Attitude</title>
  <script src="js/attitude.js"></script>
</head>

<body>
  <canvas id="drawingCanvas" width="640" height="480"></canvas>
</body>

</html>attitude.js:
window.onload = function () {

    let canvas = document.getElementById("drawingCanvas");
    let context = canvas.getContext("2d");

    let run = function () {
        drawAttitude(context, 320, 240, 30 * Math.sin(performance.now() / 2000), 45 * Math.sin(performance.now() / 5000), 200);
    }

    let interval = setInterval(run, 1000 / 60);
};


drawAttitude = function (ctx, centreX, centreY, pitch, roll, radius = 100) {
    //   :
    if (pitch > 30) pitch = 30;
    if (pitch < -30) pitch = -30;

    if (roll > 45) roll = 45;
    if (roll < -45) roll = -45;
    //  :
    roll *= Math.PI / 180;
    pitch *= Math.PI / 180;
    // ""  :
    let vehicleSize = radius * 0.8;
    ctx.font = Math.round(radius / 8) + "px Arial";
    //    :
    ctx.lineWidth = 2;
    ctx.strokeStyle = "Black";
    // :
    ctx.beginPath();
    ctx.arc(centreX, centreY, radius, 0, Math.PI, false);
    ctx.fillStyle = "Maroon";
    ctx.stroke();
    ctx.fill();
    // :
    ctx.beginPath();
    ctx.arc(centreX, centreY, radius, 0, Math.PI, true);
    ctx.fillStyle = "SkyBlue";
    ctx.stroke();
    ctx.fill();
    //"":
    ctx.beginPath();
    //:
    let topSideIsVisible = (pitch >= 0);
    ctx.strokeStyle = topSideIsVisible ? "Orange" : "Brown";
    ctx.fillStyle = topSideIsVisible ? "Yellow" : "Red";
    ctx.lineWidth = 3;
    //
    //  4 ,       ,
    //  :
    ctx.moveTo(centreX, centreY - Math.sin(pitch) * vehicleSize / 2);
    ctx.lineTo(centreX + vehicleSize * Math.cos(roll), centreY + vehicleSize * Math.sin(roll) * Math.cos(pitch));
    ctx.lineTo(centreX, centreY - 2 * Math.sin(pitch) * vehicleSize);
    ctx.lineTo(centreX - vehicleSize * Math.cos(roll), centreY - vehicleSize * Math.sin(roll) * Math.cos(pitch));
    ctx.lineTo(centreX, centreY - Math.sin(pitch) * vehicleSize / 2);
    ctx.stroke();
    ctx.fill();
    // :
    // :
    ctx.beginPath();
    ctx.strokeStyle = "Black";
    ctx.fillStyle = "Black";
    ctx.lineWidth = 1;
    //:
    ctx.fillText(30, centreX - radius * 0.28, centreY - vehicleSize + radius / 20);
    ctx.fillText(20, centreX - radius * 0.28, centreY - vehicleSize * 0.684 + radius / 20);
    ctx.fillText(10, centreX - radius * 0.28, centreY - vehicleSize * 0.348 + radius / 20);
    // - :
    ctx.moveTo(centreX - radius / 10, centreY - vehicleSize);
    ctx.lineTo(centreX + radius / 10, centreY - vehicleSize);
    ctx.stroke();

    ctx.moveTo(centreX - radius / 10, centreY - vehicleSize * 0.684);
    ctx.lineTo(centreX + radius / 10, centreY - vehicleSize * 0.684);
    ctx.stroke();

    ctx.moveTo(centreX - radius / 10, centreY - vehicleSize * 0.348);
    ctx.lineTo(centreX + radius / 10, centreY - vehicleSize * 0.348);
    ctx.stroke();
    // :
    ctx.beginPath();
    ctx.strokeStyle = "White";
    ctx.fillStyle = "White";
    //:
    ctx.fillText(30, centreX - radius * 0.28, centreY + vehicleSize + radius / 20);
    ctx.fillText(20, centreX - radius * 0.28, centreY + vehicleSize * 0.684 + radius / 20);
    ctx.fillText(10, centreX - radius * 0.28, centreY + vehicleSize * 0.348 + radius / 20);
    // - :
    ctx.moveTo(centreX - radius / 10, centreY + vehicleSize);
    ctx.lineTo(centreX + radius / 10, centreY + vehicleSize);
    ctx.stroke();

    ctx.moveTo(centreX - radius / 10, centreY + vehicleSize * 0.684);
    ctx.lineTo(centreX + radius / 10, centreY + vehicleSize * 0.684);
    ctx.stroke();

    ctx.moveTo(centreX - radius / 10, centreY + vehicleSize * 0.348);
    ctx.lineTo(centreX + radius / 10, centreY + vehicleSize * 0.348);
    ctx.stroke();

    // :
    ctx.lineWidth = 2;

    //+-15 :
    ctx.fillText(15, centreX + radius * 0.6, centreY + radius * 0.22);
    ctx.moveTo(centreX + 0.966 * 0.8 * radius, centreY + 0.259 * 0.8 * radius);
    ctx.lineTo(centreX + 0.966 * 0.95 * radius, centreY + 0.259 * 0.95 * radius);

    ctx.fillText(15, centreX - radius * 0.75, centreY + radius * 0.22);
    ctx.moveTo(centreX - 0.966 * 0.8 * radius, centreY + 0.259 * 0.8 * radius);
    ctx.lineTo(centreX - 0.966 * 0.95 * radius, centreY + 0.259 * 0.95 * radius);

    //+-30 :
    ctx.moveTo(centreX + 0.866 * 0.8 * radius, centreY + 0.5 * 0.8 * radius);
    ctx.lineTo(centreX + 0.866 * 0.95 * radius, centreY + 0.5 * 0.95 * radius);

    ctx.moveTo(centreX - 0.866 * 0.8 * radius, centreY + 0.5 * 0.8 * radius);
    ctx.lineTo(centreX - 0.866 * 0.95 * radius, centreY + 0.5 * 0.95 * radius);

    //+-45 :
    ctx.moveTo(centreX + 0.707 * 0.8 * radius, centreY + 0.707 * 0.8 * radius);
    ctx.lineTo(centreX + 0.707 * 0.95 * radius, centreY + 0.707 * 0.95 * radius);

    ctx.moveTo(centreX - 0.707 * 0.8 * radius, centreY + 0.707 * 0.8 * radius);
    ctx.lineTo(centreX - 0.707 * 0.95 * radius, centreY + 0.707 * 0.95 * radius);

    ctx.stroke();
}
The most difficult to understand is the code for drawing the "layout". Let's consider it in more detail. As a layout, it was decided to use a flat symmetrical figure in the shape of an arrow.
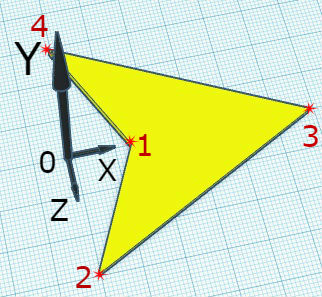
The top and bottom surfaces of the layout differ from each other in outline and fill colors. Choosing the current color scheme is the first part of the code.
Next comes the construction of the contour of the figure.
The most difficult task is to determine the coordinates of the projections of the figure vertices on the YOZ plane . This is what expressions with trigonometric functions solve. The vertices in the code are traversed in the order of their numbering in the figure.
The largest part of the code is devoted to scales and signatures. Scale marks have many differences: top and bottom, left and right, with and without labels. The impressive number of lines is due to the writing of the "individual" code for each element.
Trigonometric functions of the corresponding angles are used to apply roll marks. Since the values of the angles of each label are known in advance, ready-made values of sines and cosines are written in the code.
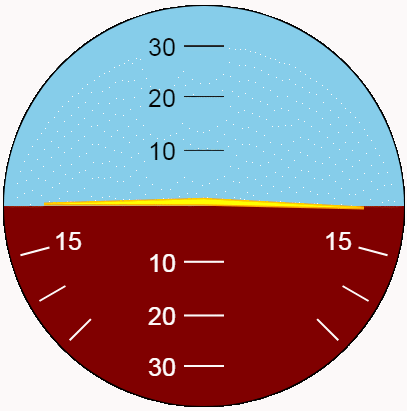
It is better to evaluate the appearance of the indicator in dynamics. We show with the help of the new function the pitch and roll oscillations. For the maximum variety of positions, let us make the oscillation amplitudes corresponding to the indicator limits, and the periods - different and mutually simple.
Conclusion
Strictly speaking, the above code for the roll and pitch visualization should be called an indication "based on" the invention of A. P. Plentsov and N. A. Zakonova. Some deviations from the original schemes are made to simplify the task, others to improve implementation.
The presented indicator is far from ideal in terms of design. The accepted limitations of the displayed values are not optimal by any objective criterion. Nevertheless, the task of creating an interesting technology demonstrator can be considered solved.