
In recent months, a lot of materials have come across that manufacturers are hiding the use of SMR technology in their devices. News of hard drive buyers suing manufacturers and the like.
The fact is that due to the nature of the technology, such devices are poorly suited for many use cases in which hard drives find their application. This is expressed in a catastrophic drop in productivity.
To determine that the SMR technology is applied in the disk lying on the store shelf, if this information is not explicitly indicated by the manufacturer, you need to know the model lines and their features. There seems to be no other way. It will not work with 100% probability to determine this by the declared characteristics of the disk.
But if the disc has already fallen into your hands, determining the use of SMR technology can be quite simple. Next, I will explain how to do this.
Currently, three approaches are used to implement SMR technology:
- Drive Managed SMR,
- Host Managed SMR,
- Host Aware SMR.
The differences between them, as well as the SMR technology in general, are described in an article recently published on Habré.
Very briefly about SMR, for those who do not want to follow the link
Shingled Magnetic Recording — . , , .
, . , .. .
— . — , - , . . .
, , , . , , , . .
, SMR , SMR. .
, (). . .
, . , , , - . . - . . , . .
, . , .. .
— . — , - , . . .
, , , . , , , . .
, SMR , SMR. .
, (). . .
, . , , , - . . - . . , . .
With Host Managed SMR and Host Aware SMR in "real life" you most likely will not come across. These modifications are not available for sale or are supplied in limited quantities and only on request. And in a normal situation, a non-corporate user has a very small chance of encountering such disks.
Therefore, further we will talk only about Drive Managed SMR disks. This is exactly the kind of disc that you can buy in the store, not knowing that it uses SMR.
A quick way to determine the use of SMR in HDD based on information about vendor families
If all hard drive manufacturers adhered to the standard in this regard, then the answer to the question of using SMR for a particular device could be obtained very easily. It would be enough to look at the state of the corresponding bit in the drive's passport:
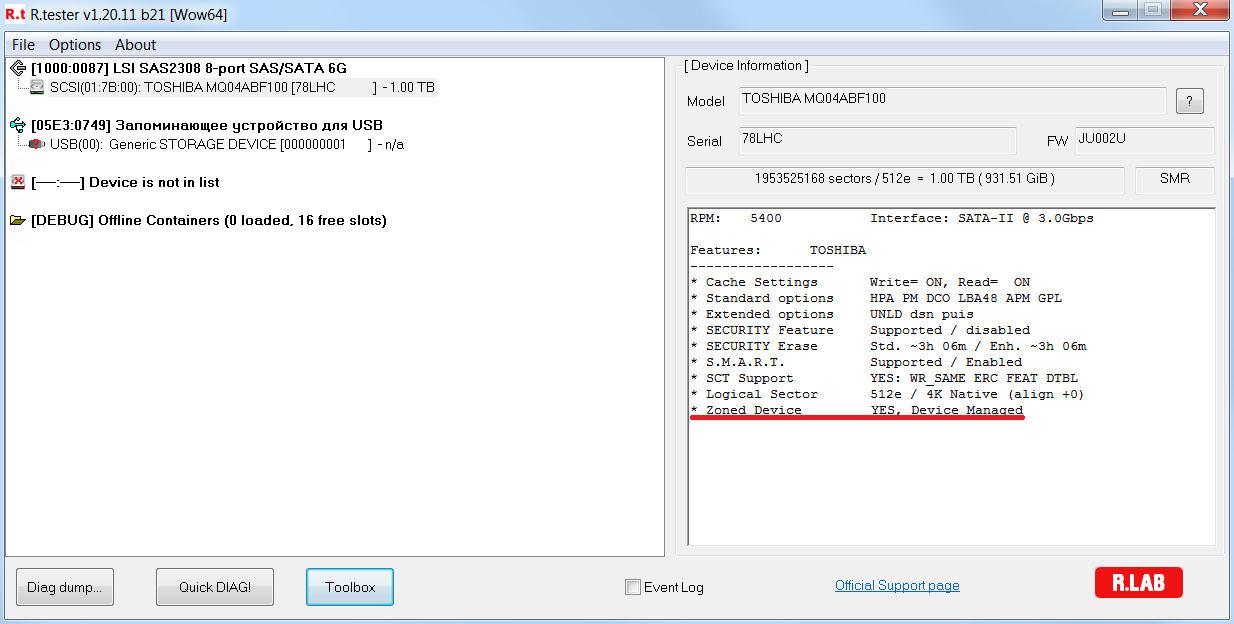
But today only Toshiba SATA drives officially state in the passport that they are SMR. For this, the ATA standard provides the corresponding bits in the data of the Identify Device command. All other manufacturers ignore the standard.
The only known to me at the moment method of "instant" determination of the use of SMR is based on knowledge about the features of vendor families and determining the belonging of a hard disk to a specific family. This approach uses R.tester when the appropriate flag is set:
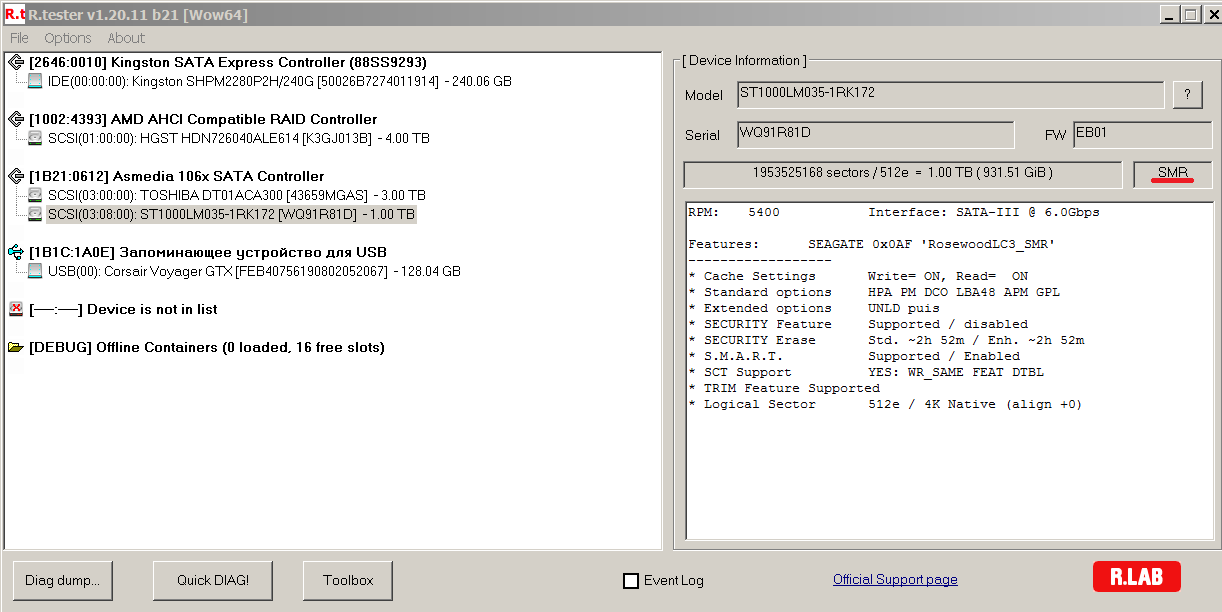
Determining Hard Disk Tile Usage by Testing
It is easy to determine that a hard disk has SMR technology by seeing the reflection of its innate features in the read-write test results. More on this later.
Reading test
If the disk is partially occupied by data, or is empty, you can see a picture on the read test graph that is typical only for models with SMR. The firmware “knows” that nothing has been written to the sector requested by the program, and gives zeros without reading from the surface. Hence this leap in read speed, or just phenomenal speed if the disk is empty:
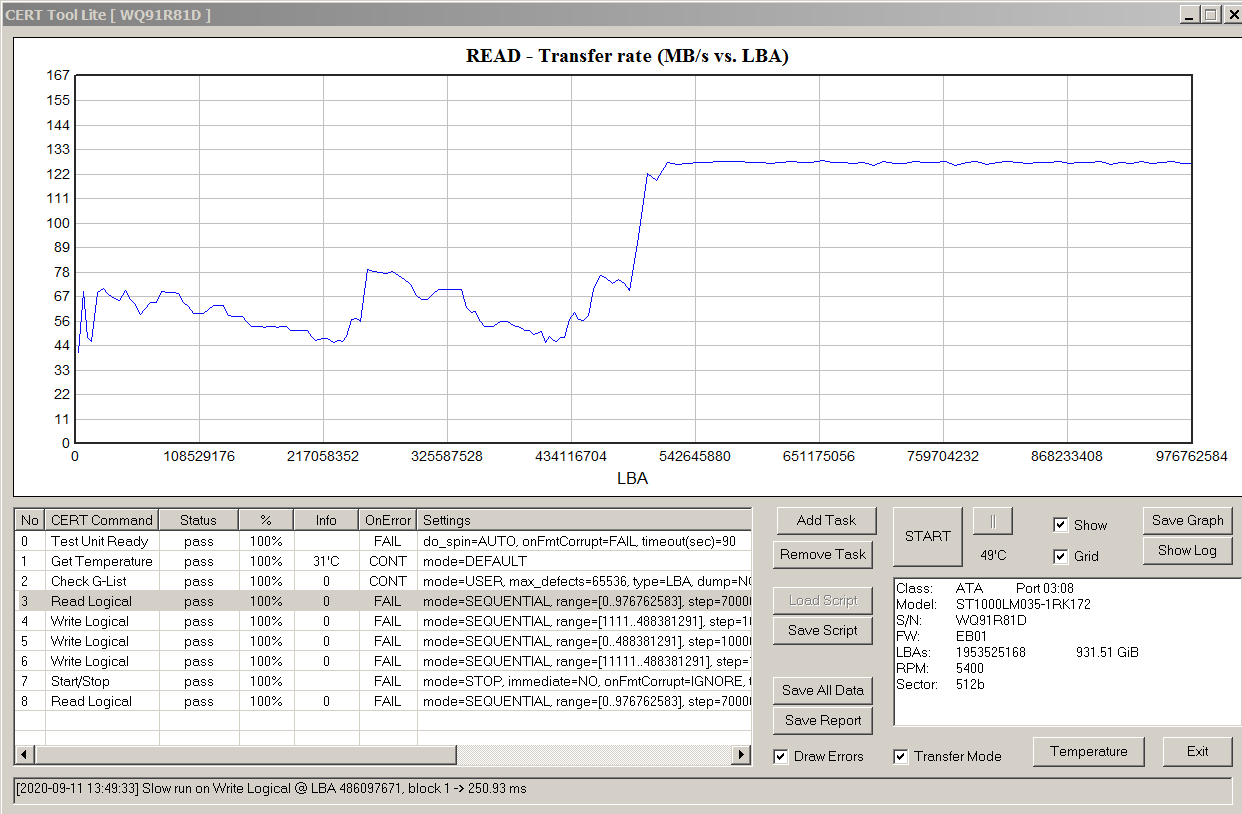
To save time, simple linear reading can be replaced with jumping reading. In this case, each next block is read starting from the address exceeding the address of the previous reading by the jump length.
The above graph just reflects the results of such a test.
Write test
The most obvious way to demonstrate the use of SMR technology is to select a recording mode in which the cache will fill up as quickly as possible, and its decomposition into tapes will require a large amount of work from the firmware.
I assume that for most models of SMR disks and the most common ways of connecting them, this will be a random write of blocks of 2048 sectors. Replacing a random record with a record according to any rule according to which blocks written sequentially will fall into different tapes will not greatly facilitate the fate of the disk.
I chose linear jumping notation as my main test algorithm. It is similar to reading, with each next block being written to an address that exceeds the address of the previous record by the length of the jump.
I consider the graph with the results of such a test the most illustrative. Indeed, when displaying the dependence on the LBA, the address axis is also the time axis, albeit in a non-linear scale.
The lengths of the jumps were chosen in such a way that from one to five blocks fell into each tape. The standard recommended tape size is 524288 blocks. Manufacturers often ignore this recommendation, but it can be used as a guideline for roughly determining the length of a jump.
The amount of data that needs to be recorded in order for SMR to manifest itself in all its glory depends on the design of the disc and the implementation of its firmware. And also from the disk fullness and the presence in the cache of non-striped data obtained in the previous period of time. And it can differ literally by orders of magnitude. One disk will show a dramatic drop in performance after writing 3GB, the other will need 300GB.
The resulting graphics can differ significantly even for one particular disc instance, depending on different seemingly insignificant details. For example, the amount of indentation from zero LBA before the start of the recording can be greatly influenced.
And that's not to mention the impact of cache fullness, disk distribution, and differences between different manufacturers and models.
Here, for example, the test parameters did not change, the disk is the same. Each launch is a new picture. Moreover, between starts, the disk each time had enough time to complete background processes:


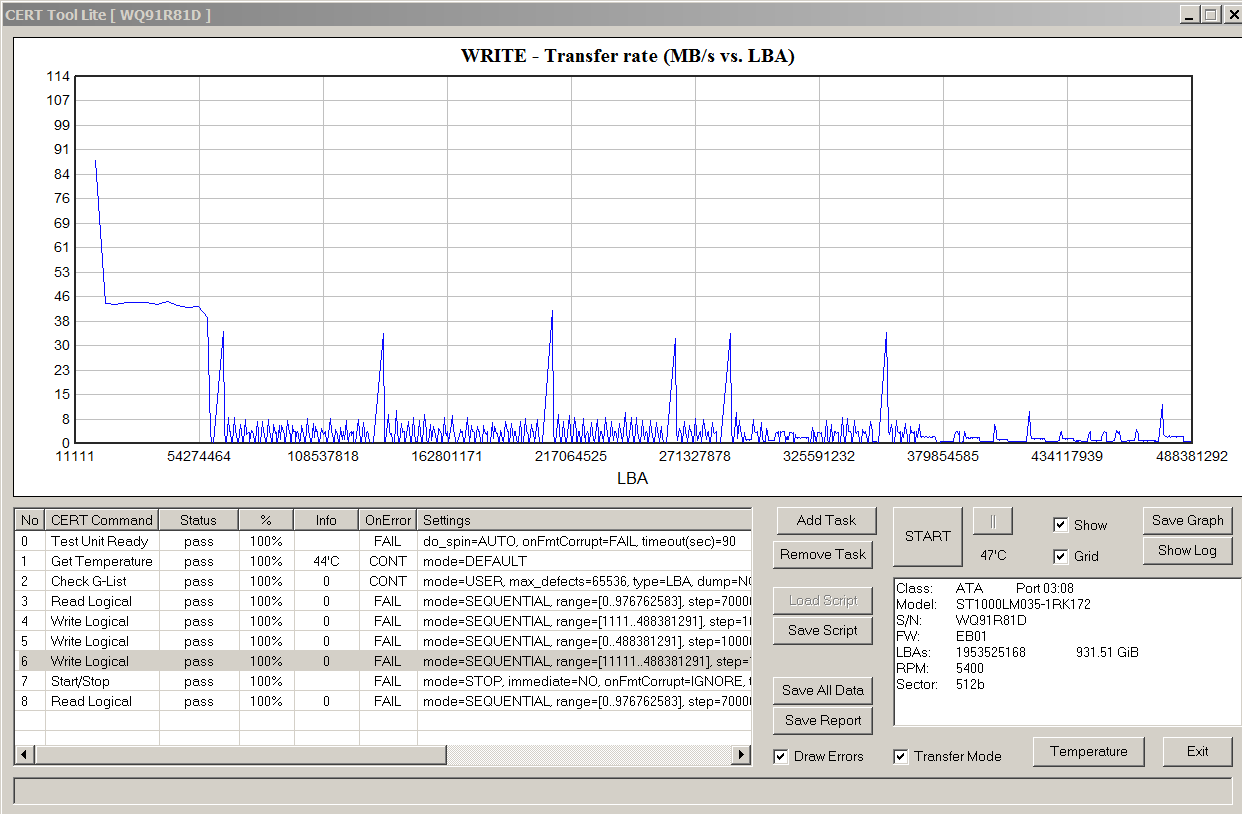
And this is a working disk. The total volume of recording during the entire set of tests from the script was only 30 gigabytes!
Therefore, it makes no sense to memorize the parameters of specific tests and compare the shapes of the graphs in terms of determining the application of SMR. It is enough to have an idea of the general picture, which looks about the same qualitatively for all SMR disks that I came across as subjects.
Here's another one to complement the presentation. Another disk model, again the same test parameters:
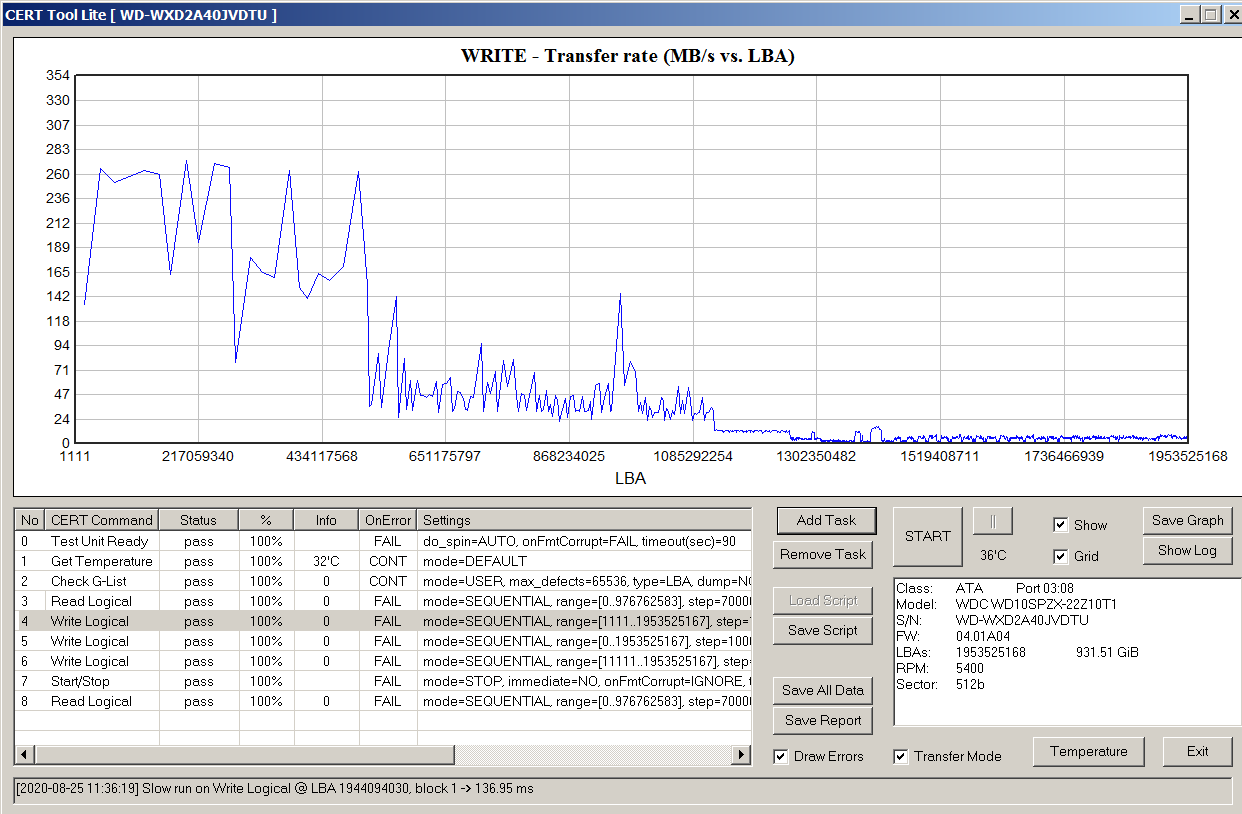

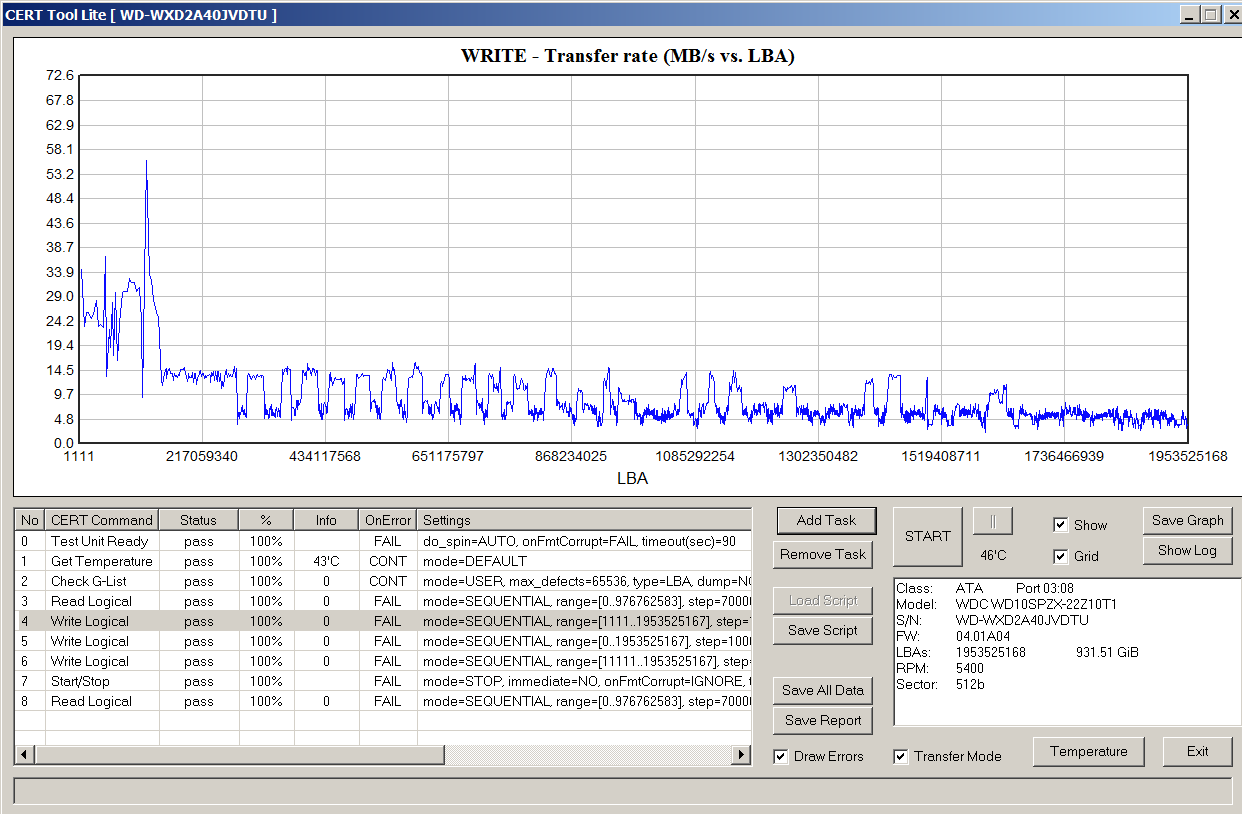
And now different parameters:
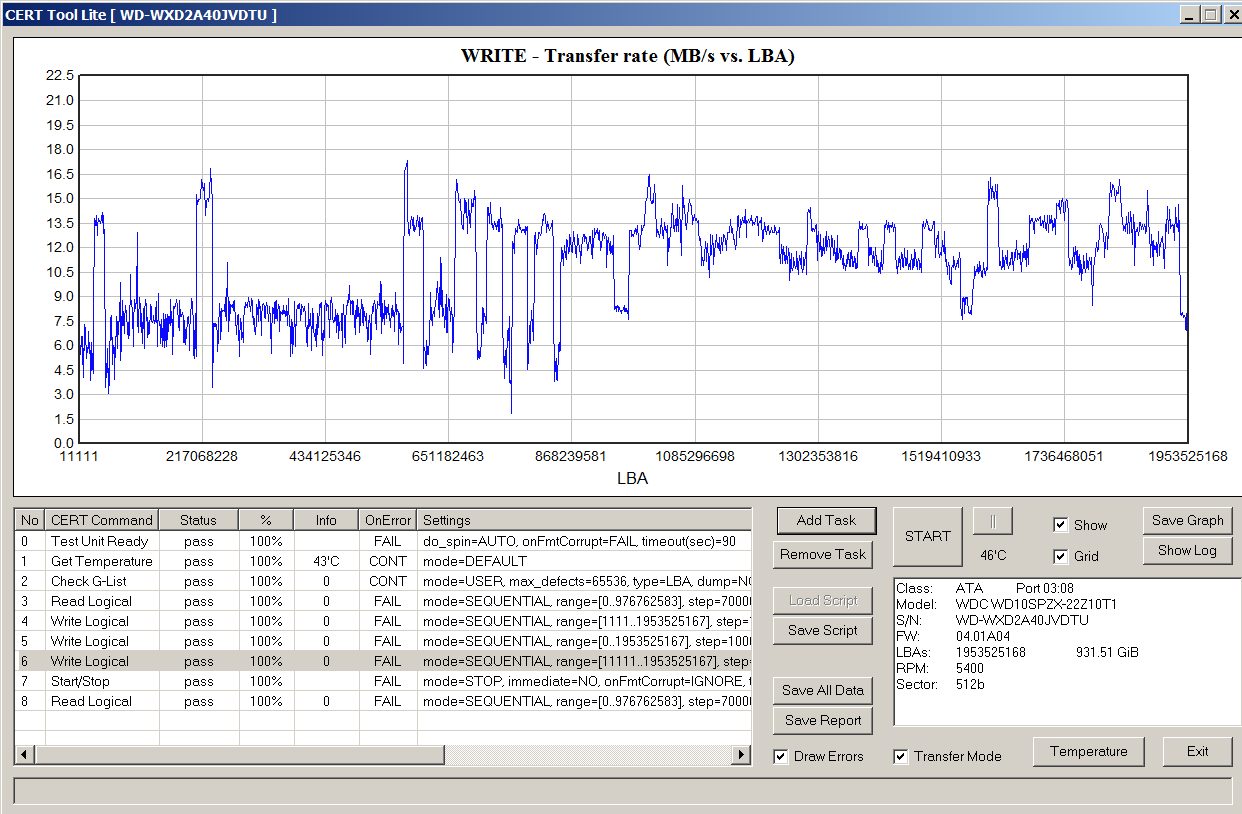
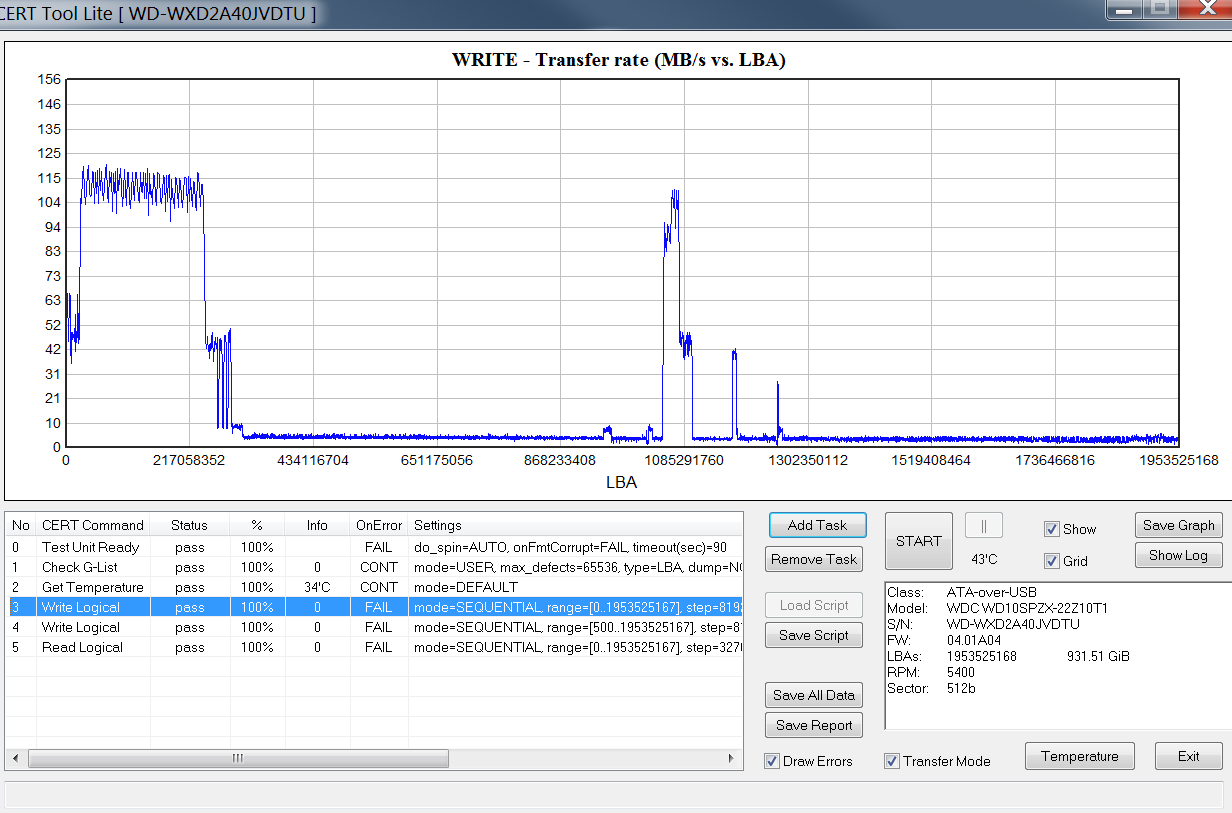
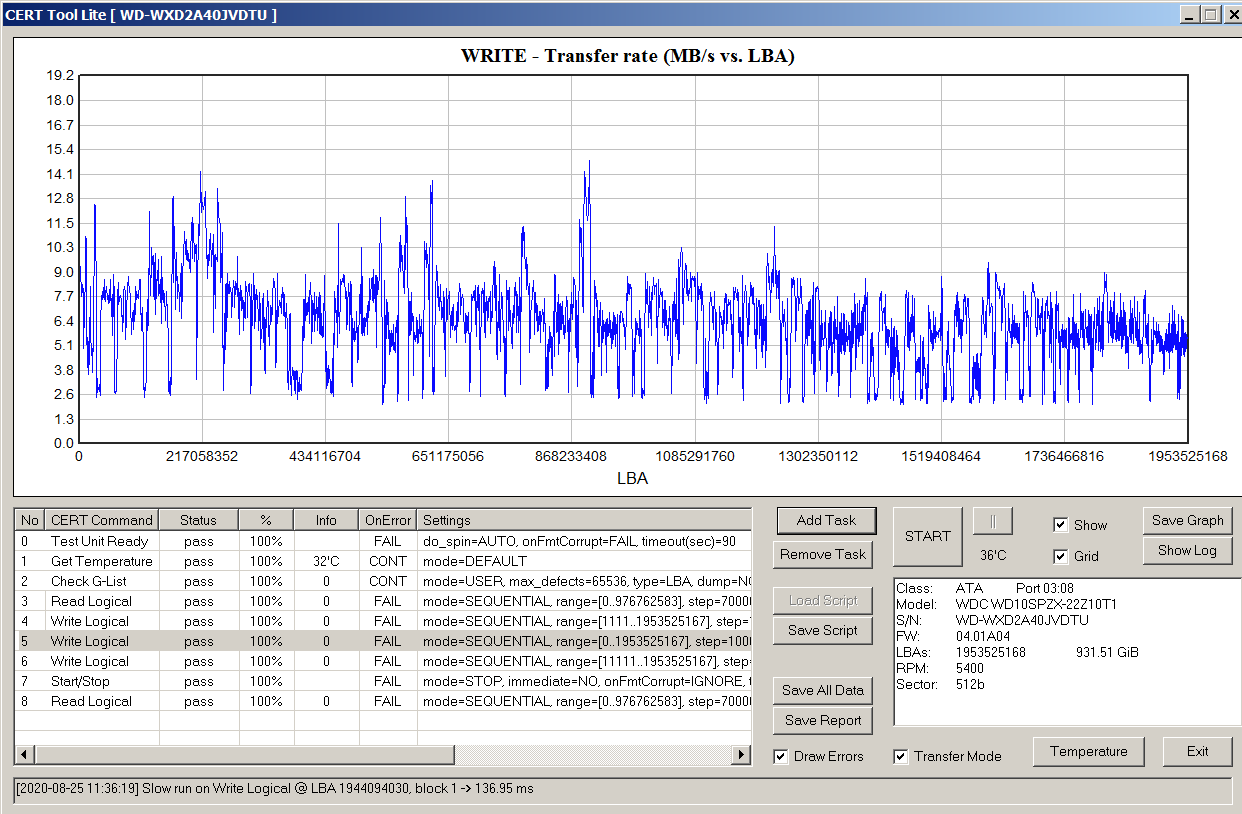
Looking at the graphs above, it is easy to see what traits show that the drive is using SMR. Especially if you know that the results of similar tests for non-SMR devices look something like this:


The speed drops slightly as the LBA increases.
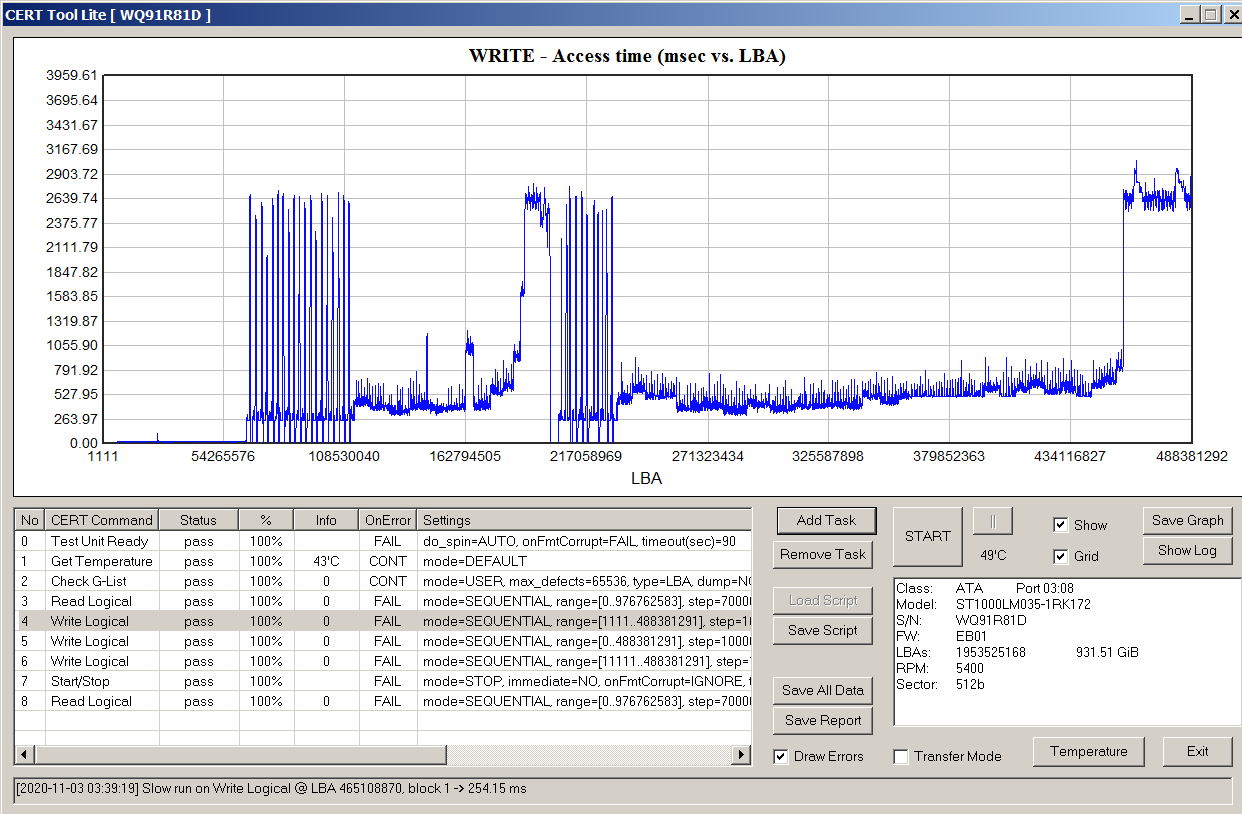
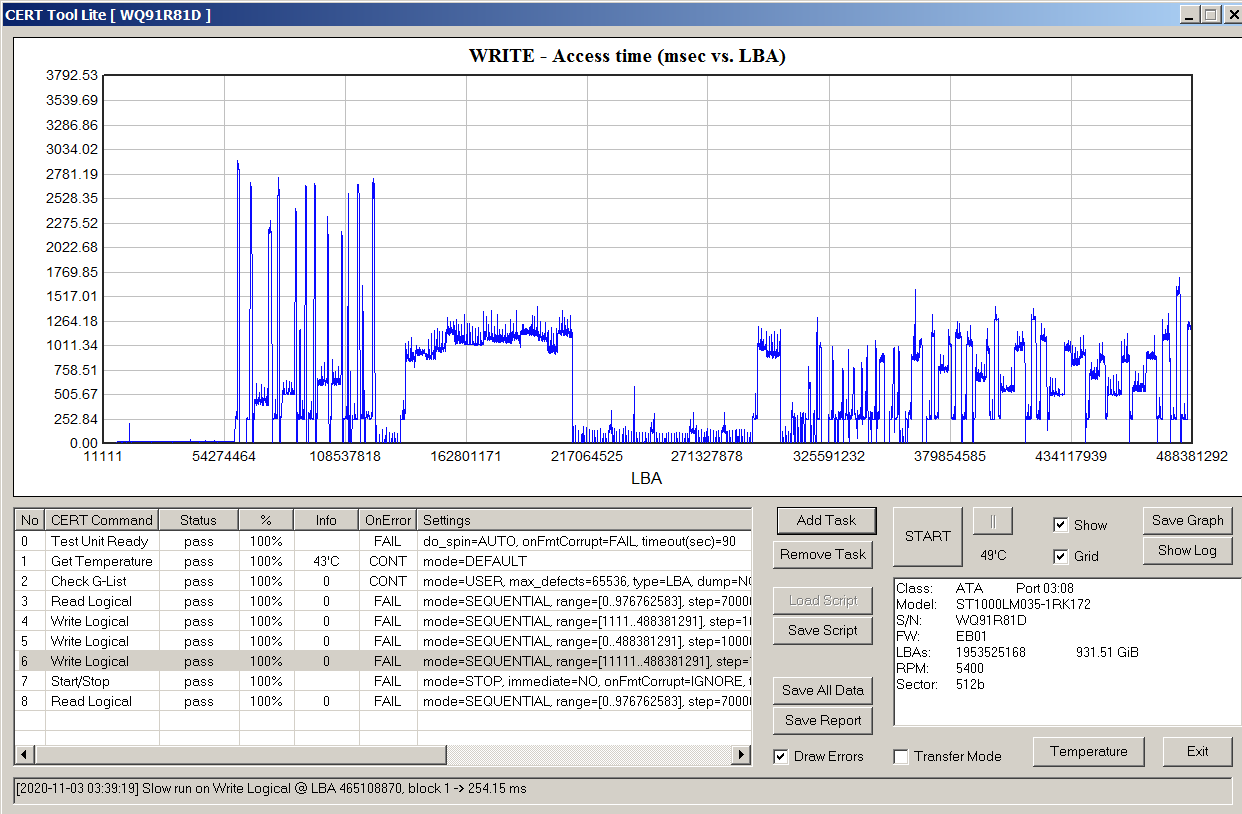
Above are the graphs of the write speed, since this parameter is more understandable to a wide audience. Examples of access time charts under the spoiler, who cares. There is also a characteristic picture, and it is even more pronounced.
Access time
SMR, :
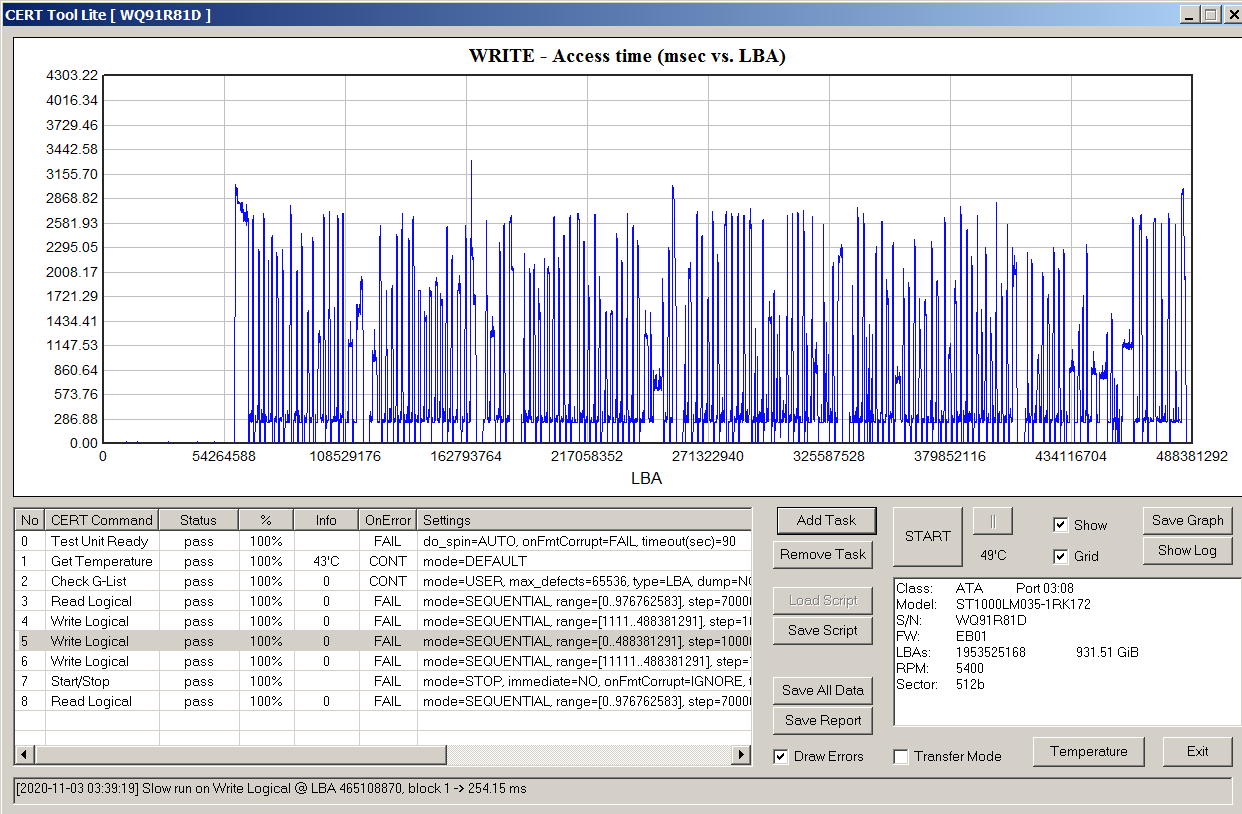
SMR :


SMR :

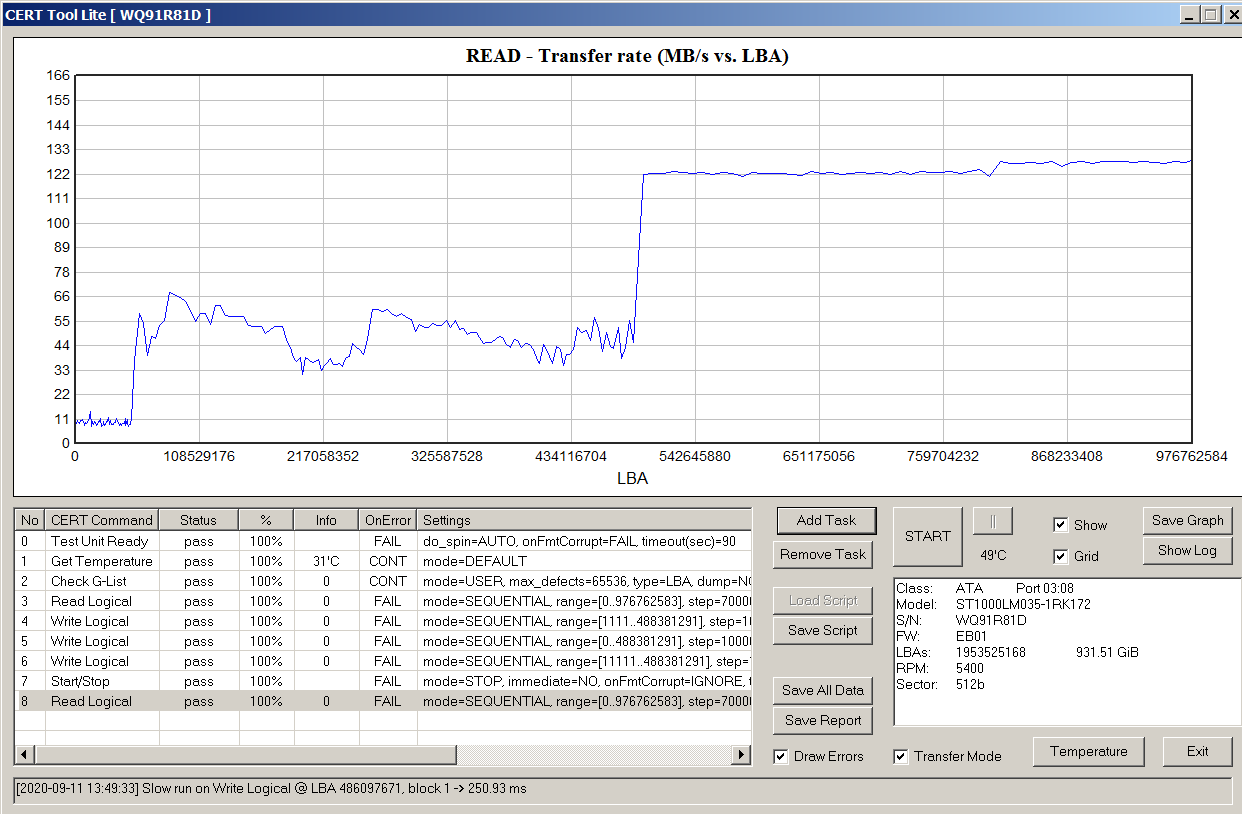
Read test immediately after write test
Think of this as another way to determine the use of SMR. Compare the graphs of the reading tests obtained during the execution of one test script. One before writing (it was also shown in the "Reading test" section), the other after. The test parameters are the same.

Additional Information
My colleague made a video on the design of SMR disks and the peculiarities of their work . It turned out quite clumsily, but it was decided that it was better to put it out in this form now than in an improved one in the very distant future.
If you are interested in the details of tests, the values of specific parameters, complete sets of results - write, I'll post it. I did not post this information in the article, since the goal was to give a qualitative idea of the picture, having done it succinctly.