How to determine whether the concept of Industry 4.0 is a company’s duty to a fashion trend or a logical continuation of business development ideas?
The indicator is the accounting of the weather in the business organization. With the weather, everything is simple: there are many sensors, observation stations and, not funny, predictive analytics in the form of a forecast for different time horizons. In addition, there is historical data from which it is possible to distinguish the correlation of production and commercial indicators of the company's work with the weather.
About 60-70% of the business is clearly weather-dependent. If you count sick leave for employees and childcare, the percentage will be even higher.
In addition to the weather dependence of business, there is also a weather dependence in the consumption of business products.
For coal, these are deviations in heat and cold. For fertilizer producers, drought or rain. For the agricultural sector and farms, each type of weather event requires an appropriate response.
If industrial companies want to try in practice the achievement of Industry 4.0 with a minimum investment, then introducing the factor of weather dependence into consideration is the best option. Betting on weather dependence at the current level of efficiency is not the best option. There are many other areas that guarantee the presence of significantly larger efficiency gains.
For the agro-industrial complex and farms, on the contrary, weather dependence is a system-forming factor. It seems that as we approach the limit of effectiveness available to conventional organizational management methods, it is necessary to experiment intensively in digital management methods.
1. Artificial intelligence in practice
Above we were given turbulence. There are no equations describing turbulence yet. A fairly reliable weather forecast is given only for 3 days, which is a consequence of the slow speed and inertia of air flows.
Weather stations are located far enough from each other. In the United States, this problem was partially solved by connecting more than 40,000 private weather stations to the general network.
Turbulence manifests itself in practice in the fact that depending on the configuration of the terrain and the movement of air flows, the values of the indicators may differ at a distance of 100-200 meters.
For terrain-bound weather stations, there is a solution to increase forecast accuracy based on machine learning (artificial intelligence). Based on the statistics collected at this point, corrections are made to the current official forecast, which take into account the landscape configuration at that point.
2. Since nature - go to the lunar calendar
Below are the data for the Maloe Sareevo meteorological station. Most of the stations are located far from each other - in circles diverging from Moscow. The only option, when the stations are located close enough and correspond to the vertices of a triangle with edges of 17-20 km, is Maloe Sareyevo, Nemchinovka and Vnukovo airfield. In this case, you can somehow double-check the results.
Maloye Sareevo: temperature data (data fragment from 2005 to 2017, daytime lines are blue, nighttime lines are brown):
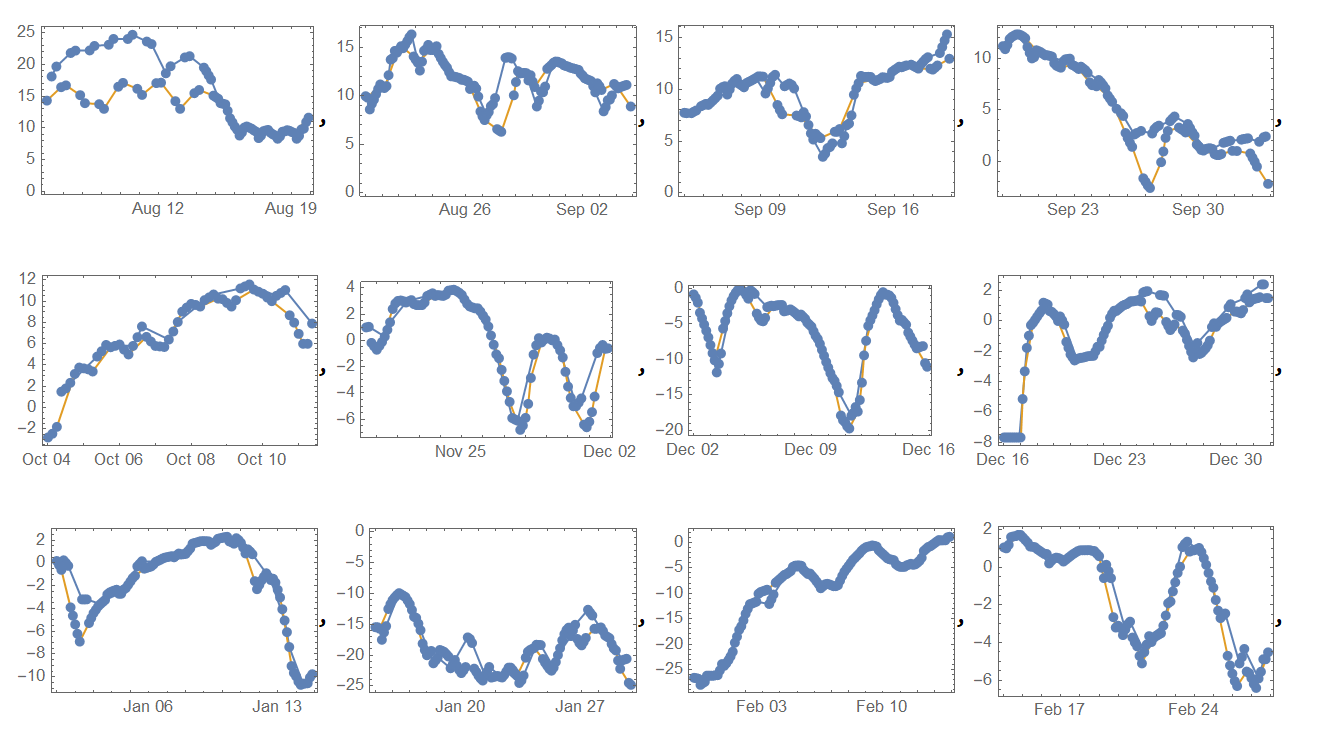
All measurements, firstly, were divided into periods corresponding to the lunar month and half-periods of rising and falling of the moon. Secondly, within the measurements of one day, measurements were grouped into night and day according to the times of sunrise and sunset, and were also renormalized to a unit interval.
Renormalization to a unit interval is necessary due to the fact that half-periods can differ by 1-2 days and the day-night border constantly moves in a day.
3. BigData is nonlinearity
The received data is BigData. Until the hidden patterns in nonlinear phenomena are revealed, these data have no practical use. Because it is impossible to formulate goal-setting statements or rules.
All that remains is to experiment and develop intuition.
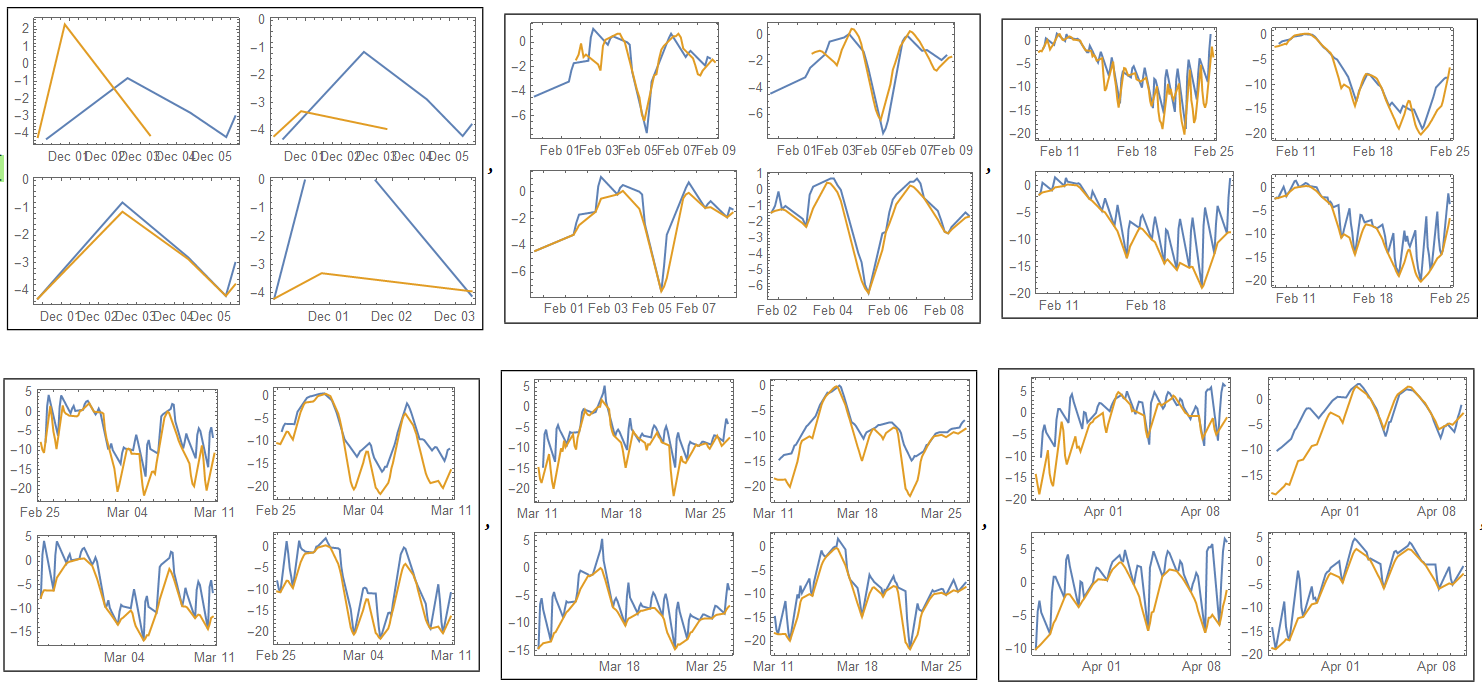
The original data were smoothed using a moving average. In a frame of 4 pictures:
- top row:
left picture: original day (blue) - initial night (brown),
right picture: smoothed day (blue) - smoothed night (brown);
- bottom row:
left figure: original day (blue) - smoothed day (brown),
right figure: original night (blue) - smoothed night (brown).
The combination of day and night very much confuses the picture due to the complexity of the dynamics. Separating day and night (difficulty with the floating sunrise-sunset boundary) allows you to see almost the same profile with a slight offset (top row, right figure).
4. Close profiles: seasonal and off-season
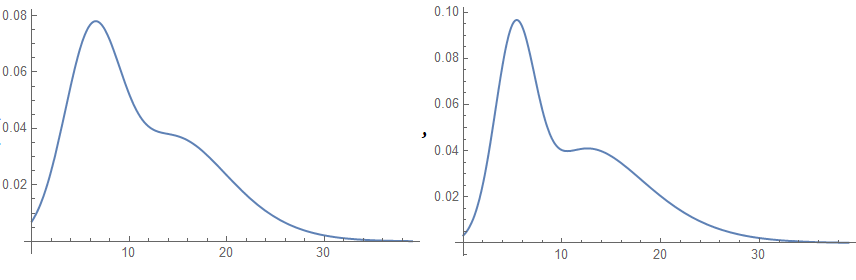
The resulting profiles can be compared. As a metric, we use the value of the integral of the absolute value of all pairs of functions. For Maly Sareev we have 83 lunar half-periods from 2012 to 2017. The distributions of the rounded metric values are shown in the tables.
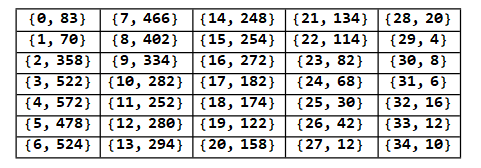
The following distribution corresponds to these values.

The figure below shows the seasonal interference pattern: over 4 years for Maly Sareev for daytime profiles. Matrix 83x83. Within the framework of the introduced metric, a certain periodicity can be traced.
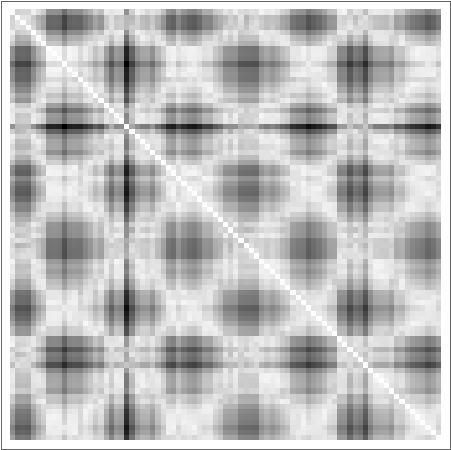
Seasonality can be abandoned by moving away from absolute temperature values and comparing only dimensionless profiles.
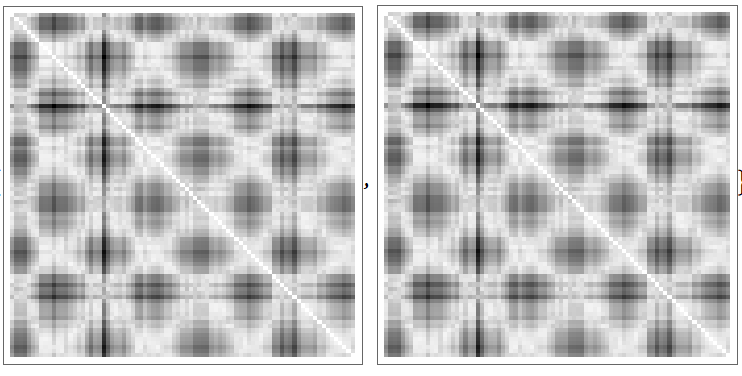
The same profiles with different temperatures will not be close. We will use another metric: the integral of the absolute value of the difference of functions with a displacement by the distance of the average difference between the functions at 10 points. We will call such profiles off-season.
The distribution is becoming more definite - the first seasonal, the second off-season.
The second interference pattern is also clearer.
5. What happened and what does it give?
It is clear that after autumn there will be winter, and after winter there will be spring. It is also clear that the weather forecast is reliable for 3 days.
What new results do the obtained results give? Based on them, it is possible to typify the forecast and understand in which profiles it can develop, and in which development is unlikely.
6. Fog on airfields
The following example demonstrates the clear benefits of typing profiles.
Fog on aerodromes is a big problem. In a normal situation, the temperature should decrease with height. However, if at some level warmer layers of air appear than on those that lie lower (closer to the ground), then fog will form. Nothing can be done with the fog, but if there is information about a possible fog, then organizational measures can significantly reduce the damage from it.
There are devices that periodically measure the temperature from 50 meters to 1000 meters in height (20 measurements in total).
In the same way as before, select the typical profiles (fragment).

The profiles shown on the right may differ in appearance from those on the left due to the different dimensions of the scale.
For forecasting, it is important to link the instrument data with the regular data of the aerodrome weather station. The picture below summarizes data from two sources.
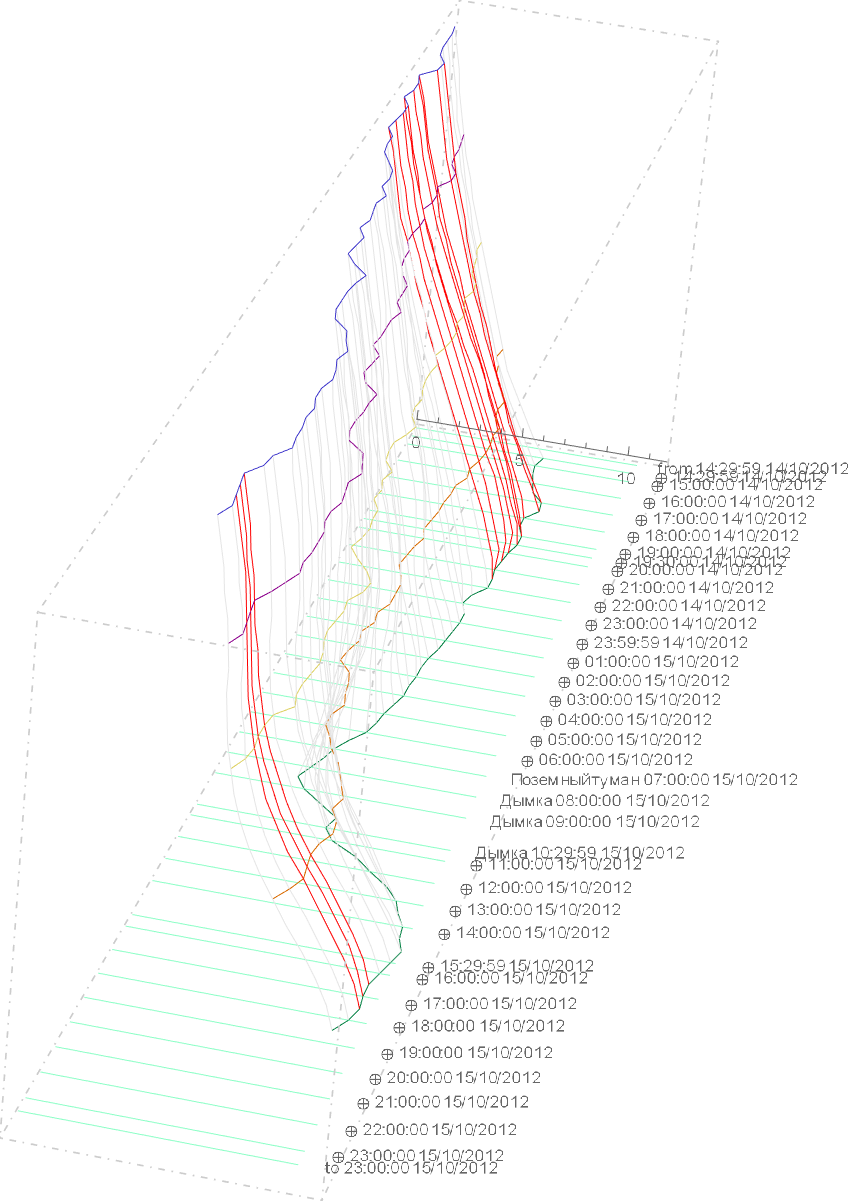
As a result, combinations of a sequence of measurements appear, combined with natural phenomena, which can be used as the basis for a machine learning system for detecting fog.
7. Conclusions
If industrial companies want to try in practice the achievement of Industry 4.0 with a minimum investment, then introducing the factor of weather dependence into consideration is the best option. Betting on weather dependence at the current level of efficiency is not the best option. There are many other areas that guarantee the presence of significantly larger efficiency gains.
For the agro-industrial complex and farms, on the contrary, weather dependence is a system-forming factor. It seems that as we approach the limit of effectiveness available to conventional organizational management methods, it is necessary to experiment intensively in digital management methods.