Spreadsheets and their capabilities
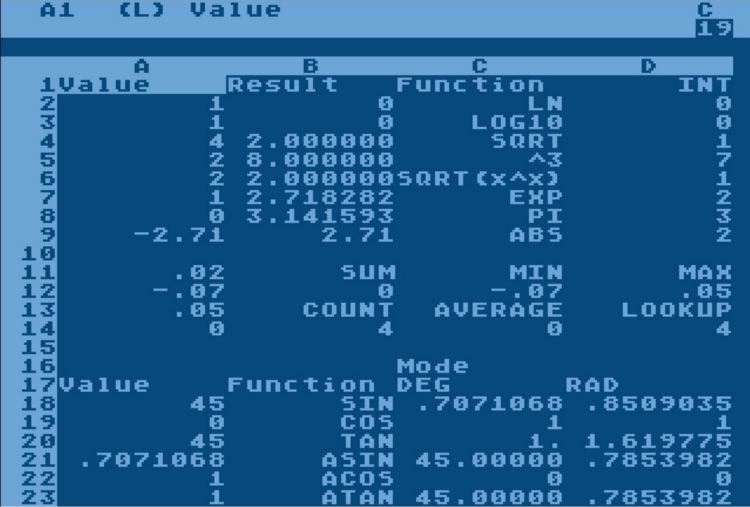
The principle by which modern spreadsheets work (Microsoft Excel, LibreOffice Calc or Google Sheets) appeared in the late 70s and mid 80s. A two-dimensional array of cells as a data model and the ability to automatically calculate using formulas appeared in VisiCalc in 1979. A three-dimensional array of cells (the ability to use multiple sheets) first appeared in 1985 in the Boeing Calc.
In theory, spreadsheets are as good as any programming language. There is a Turing machine based on Excel formulas ( link ), which means that any algorithm that can be implemented using a computer can be implemented in Excel. The only question is the convenience and efficiency of such an implementation.
In practice, I have come across very complex systems implemented in Excel. For example, a financial model for the development of an international airport with the ability to contribute many different types of objects (parking lots, warehouses, lanes, ...) and recalculating square meters and parking spaces in cash flow (expenses for construction years vs profit for years of operation), taking into account different models inflation. It can take from several person-months to several person-years to “rewrite” such an “excellence” in Java using a relational database. In this particular case, the relational model in the database consisted of over 50 tables. Most interestingly, this "rewrite" could have been avoided if spreadsheets not only allowed the creation of software, but also made it possible to maintain and scale it.For the end user (economist), the Java system is a step backward, because he no longer sees intermediate results and cannot change or supplement the model himself.
It turns out that one and the same problem can be solved both by a spreadsheet and by a universal programming language. This means that we can compare the strengths and weaknesses of these two tools as a means of creating business applications. Here we will try to look at Excel through the eyes of an architect programmer and apply the rules of software architecture that are already well-established in classical software development.
Benefits of spreadsheets
- Intuitive concept : each of us at school saw and filled out signs on pieces of paper in a box and played sea battle. Most people who work with Excel have never received any special training (at best, a colleague showed which buttons to press in half an hour). This is a big advantage over programming languages where "C ++ in 21 days" sounds even too optimistic.
- : , , - . breakpoints . . , .
- : , . , UI, .
- : . Notepad, Java . . . , E5 . VLOOKUP . -, .
- : DRY (Don’t repeat yourself — ). , (, /) . . , , , . . .
- Lack of interactivity of the interface : spreadsheets do not allow you to dynamically change the way data is displayed. It is also not possible to create programmed operations performed, for example, by pressing a button.
How to make spreadsheets better?
My name is Vadim. I'm a CTO at CubeWeaver and have been developing a new spreadsheet for quite some time now. Several years ago I already wrote ( link ) about an early version of the system, but since then a lot has changed and this year the project has reached the commercial stage.
Here is a list of innovations in my project that address the disadvantages listed above while trying to maintain the benefits of spreadsheets:
Multidimensional data model
The multidimensional data model is widely used in Business Intelligence and OLAP systems for data analysis. The essence of the model is to store data in the cells of a multidimensional cube, the edges of which are signed by the headers of business objects:
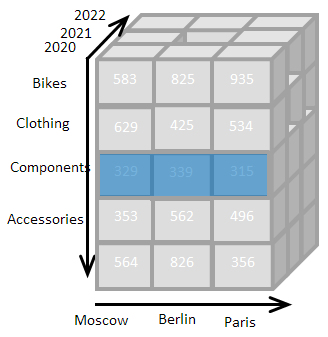
The program interface does not display the entire multidimensional cube, but its two-dimensional slice corresponding to the combination of filters we have chosen:

When implementing such a model in a relational BI system, the snowflake schema is often used. Cubes are implemented by fact tables, and face headers are stored in dimension tables.
On my system, cubes are called worksheets, and the titles on the edges of the cube are called list items.
Each cell of such a multidimensional worksheet has a unique address, consisting of labels on the edges. For example, the value 935 in the image has the address: Bikes, 2020, Paris.
Each item in the list has a name and ID. Cell references use identifiers, and the above address in a formula might look like this (references are enclosed in square brackets):
[PROD:23, YEAR:2020, CITY:24], where PROD is the identifier of the "product" list and 23 is the identifier of the "Bikes" item.
The use of a multidimensional model can significantly improve the situation with disadvantage number 1. First, headers are now stored separately from numerical data. Second, the introduction of an additional dimension “metric” (or “report position”) allows to address cells not by their ordinal number, but by semantic meaning, eliminating errors due to adding or removing columns or rows.
Of course, it must be said that this approach slightly spoils the situation with advantage number 1. Everyone played sea battle, and only a few mathematics students played 4-D chess. But experience shows that thanks to the two-dimensional representation of the cube, most users quickly get used to the new data model.
JOIN function and metadata
The multidimensional model allows you to use metadata to describe cells. The addressing method described above means that each cell in the worksheet corresponds to a specific set of list items (for example, year, product, and point of sale). Lists, in turn, can have attributes (columns), which makes them look like regular relational tables. For example, you can add a currency column to a point of sale list, thus linking the point of sale and currency lists into a many-to-one cardinality relationship.
The JOIN function makes it possible to dynamically reference cells using such a relationship. This function replaces VLOOKUP, eliminating the need to work with indexes.
Example: in order to calculate the amount of sales worldwide, you must first convert the amount of sales for each country into a single currency (multiply the “sales” position by the exchange rate). In Excel, we would store 2 tables: a list of countries with a currency for each country and a list of currencies with an exchange rate. In order to find the correct rate, we would use the VLOOKUP function twice: find the currency code by the country name and find the exchange rate by the currency code.
A reference to a cell with the exchange rate could look like this:,
EX_RATES.[COUNTRY.join(CURRENCY)]where
EX_RATESis the name of the worksheet with exchange rates
COUNTRY- dimension with countries
CURRENCY- dimension with currencies
Link chains can be of any length, for example:
STORE.join(COUNTRY).join(CURRENCY)
In fact, when we build the model, we create a snowflake outline. The JOIN function allows formulas to dynamically reference cells in worksheets using links between tables (lists) of that schema. In this case, the dependencies between cells are explicitly specified in the arguments of the JOIN function.
Area of validity of formulas
The ability to specify the area of effect eliminates the need to copy formulas.
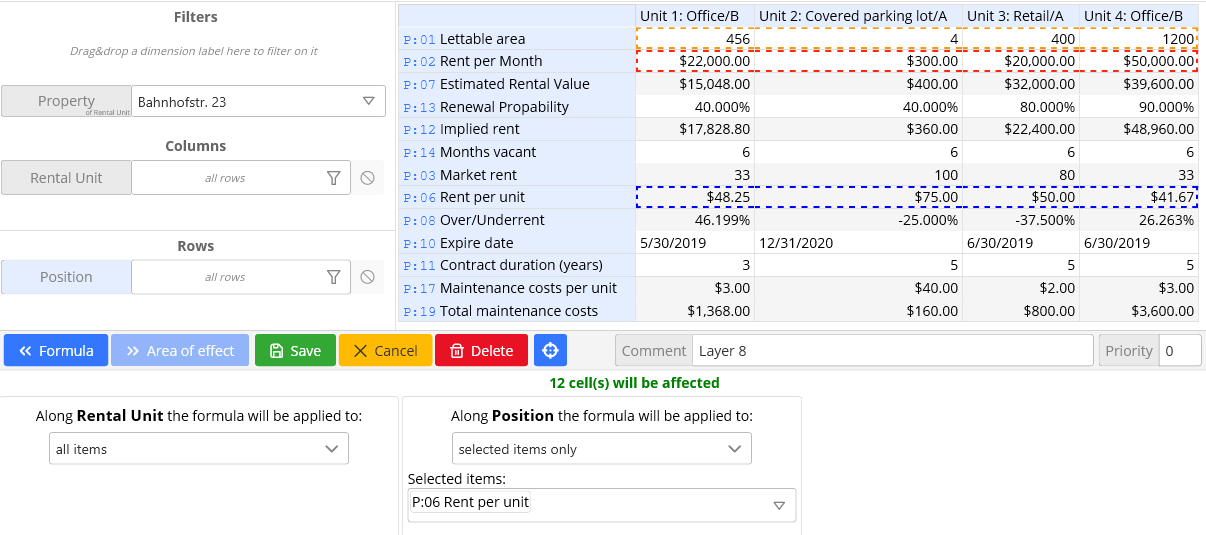
For each dimension of the cube, we define a set of elements on which the formula acts, such as: all years, products of the type "bicycle", the item of the report "revenue". In practice, it looks like this (The goal of the formula is marked in blue, its arguments are marked in red and orange. The list of selected elements for each dimension is at the bottom of the screen):
This approach fixes flaw number 2 and allows you to add and remove items or even dimensions without changing the formula. It also eliminates the need to search for all the cells to which the formula was copied every time we want to change it.
Interactivity of cells
This innovation allows you to create interactive interfaces using formulas. Formulas can be used not only to calculate the value of a cell, but also to format cells (cell formatting), change the color of cells (cell color) and to hide or show a group of cells or entire columns or rows (cell visibility). Cells can be formatted not only as numbers, dates, and text, but also as buttons, checkboxes, and dropdowns.
Thus, for example, the color of the cells can change depending on the value of the cell. A checkbox or picklist in one sheet can show, hide, or lock cells in another sheet.
Buttons in cells allow you to create fairly complex operations on cell values. By creating the button, we set the target of the operation (cell range) and the formula, which is executed once for each of the target cells. There can be several operations on one button. So, pressing a button can, for example, copy data from the previous year to the next, or distribute the contents of a cell among several other cells, proportionally to some value (splashing).
Buttons combined with user access restrictions allow for irreversible functionality. So, for example, a user who accessed a button, but did not get access to the target cell, will be able to write to the cell only what the formula in the button will allow him.
Conclusion
The new spreadsheet processor allows for significantly more complex models than is possible in other systems. At the same time, the models remain clear and easy to maintain. The likelihood of errors in formulas is also significantly reduced.
The price to pay for these benefits is the increased complexity of the system. Before starting work, the user must create a data model in the form of lists and cubes.
In general, the system is designed for a technically more literate user than Excel (for example, economists with basic programming knowledge or programmers working on economic models).
I will be happy to answer your questions in the comments or private messages. Also, on the Internet, you can find documentation for the system and several training videos.