Monitoring Kubernetes internal endpoints and APIs can be problematic, especially if the goal is to leverage automated infrastructure as a service. We at Smarkets have not yet reached this goal, but fortunately, we are already quite close to it. I hope that our experience in this area will help others to implement something similar.
We have always dreamed that developers would be able to monitor any application or service out of the box. Before moving to Kubernetes, this task was done either using Prometheus metrics or using statsd, which sent statistics to the base host, where they were converted to Prometheus metrics. As we continue to leverage Kubernetes, we started to separate clusters, and we wanted to make it so that developers could export metrics directly to Prometheus through service annotations. Alas, these metrics were available only within the cluster, that is, they could not be collected globally.
These limitations were the bottleneck for our pre-Kubernetes configuration. Ultimately, they forced to rethink the architecture and way of monitoring services. This journey will be discussed below.
The starting point
For Kubernetes-related metrics, we use two services that provide metrics:
-
kube-state-metricsgenerates metrics for Kubernetes objects based on information from the K8s API servers; -
kube-eagleexports Prometheus metrics for pods: their requests, limits, usage.
It is possible (and for some time we have been doing this) to expose services with metrics outside the cluster or open a proxy connection to the API, but both options were not ideal, since they slowed down the work and did not provide the necessary independence and security of the systems.
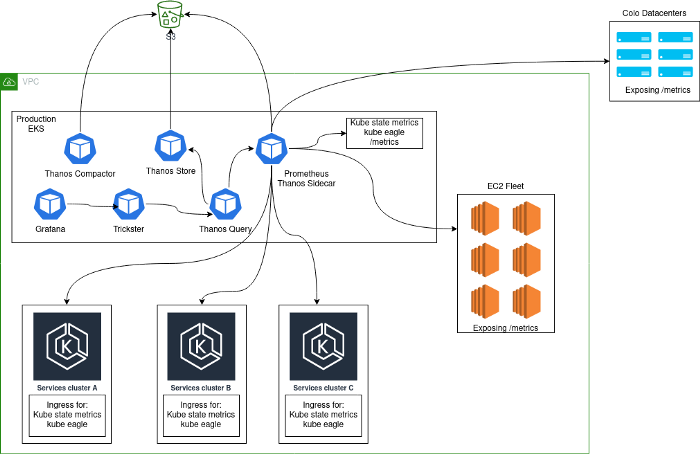
Typically, a monitoring solution was deployed, consisting of a central cluster of Prometheus servers running inside Kubernetes and collecting metrics from the platform itself, as well as internal Kubernetes metrics from this cluster. The main reason that this approach was chosen was that during the transition to Kubernetes, we collected all services in the same cluster. After adding additional Kubernetes clusters, our architecture looked like this:

Problems
Such an architecture cannot be called stable, efficient, or productive: after all, users could export statsd metrics from applications, which led to incredibly high cardinality of some metrics. You may be familiar with problems like this if the following order of magnitude seems familiar.
When analyzing a 2-hour Prometheus block:
- 1.3 million metrics;
- 383 names of labels;
- the maximum cardinality per metric is 662,000 (most of the problems are precisely because of this).
This high cardinality is mainly due to the exposure of statsd timers that include HTTP paths. We know this is not ideal, but these metrics are used to track critical bugs in canary deployments.
In quiet times, about 40,000 metrics were collected per second, but their number could grow to 180,000 in the absence of any problems.
Certain specific queries for high cardinality metrics caused Prometheus to (predictably) run out of memory - a very frustrating situation when it (Prometheus) is used to alert and evaluate the performance of canary deployments.
Another problem was that with three months of data stored on each Prometheus instance, the startup time (WAL replay) was very high, and this usually resulted in the same request being routed to a second Prometheus instance and “ dropped it already.
To fix these issues, we have implemented Thanos and Trickster:
- Thanos allowed less data to be stored in Prometheus and reduced the number of incidents caused by excessive memory use. Next to the container, Prometheus Thanos runs a sidecar container that stores blocks of data in S3, where they are then compressed by thanos-compact. Thus, with the help of Thanos, long-term data storage outside of Prometheus was implemented.
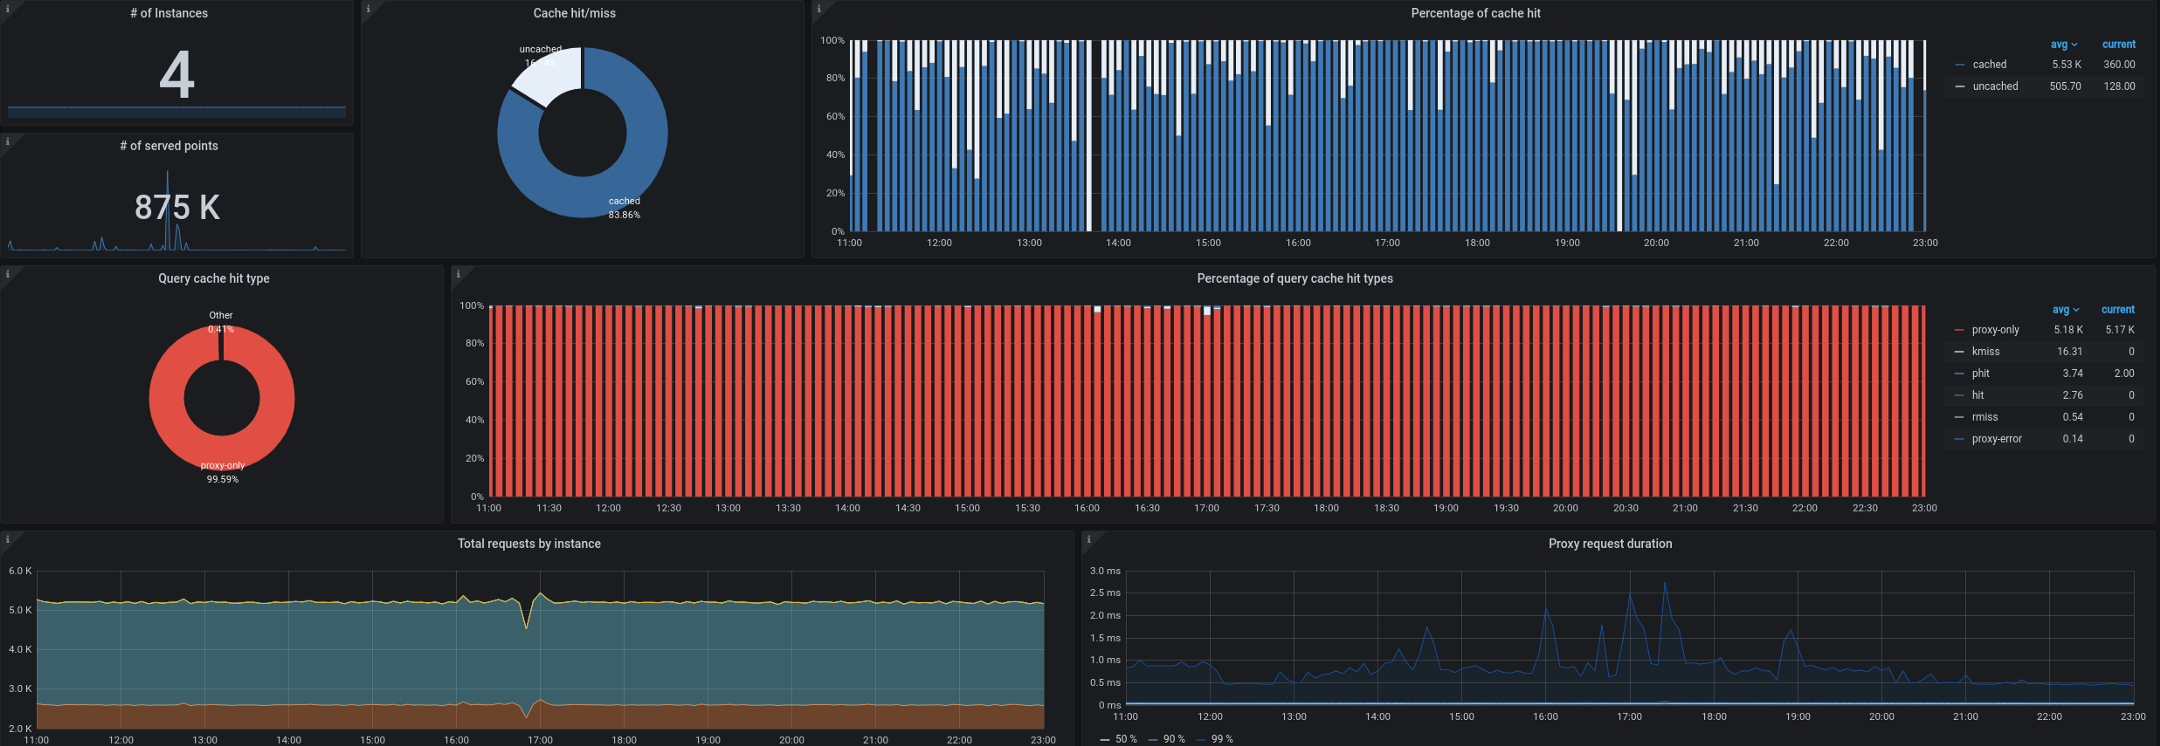
- Trickster, for its part, acts as a reverse proxy and cache for time series databases. It allowed us to cache up to 99.53% of all requests. Most requests come from dashboards running on workstations / TVs, from users with open control panels, and from alerts. A proxy that can only output delta in time series is great for this kind of workload.

We also started having problems collecting kube-state-metrics from outside the cluster. As you remember, we often had to process up to 180,000 metrics per second, and the collection slowed down even when 40,000 metrics were set in a single ingress kube-state-metrics. We have a target 10-second interval for collecting metrics, and during periods of high load this SLA was often violated by remote collection of kube-state-metrics or kube-eagle.
Options
While thinking about how to improve the architecture, we looked at three different options:
- Prometheus + Cortex ( https://github.com/cortexproject/cortex );
- Prometheus + Thanos Receive ( https://thanos.io );
- Prometheus + VictoriaMetrics ( https://github.com/VictoriaMetrics/VictoriaMetrics ).
Detailed information about them and comparison of characteristics can be found on the Internet. In our particular case (and after tests on data with high cardinality) VictoriaMetrics was the clear winner.
Decision
Prometheus
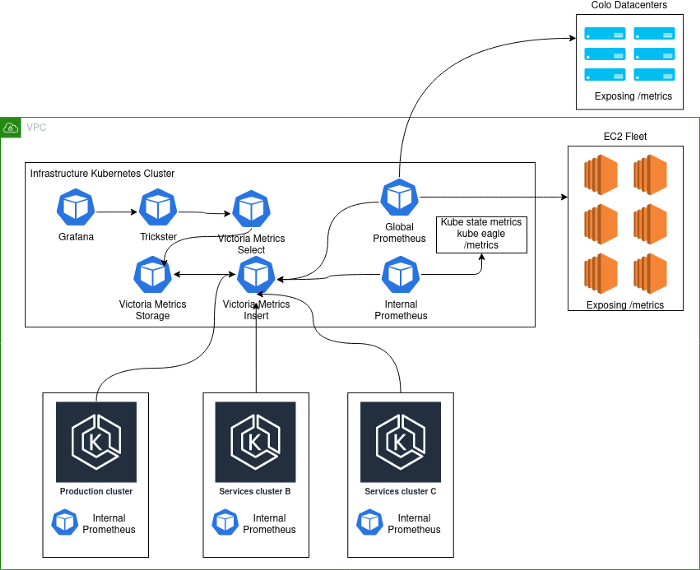
In an effort to improve the architecture described above, we decided to isolate each Kubernetes cluster as a separate entity and make Prometheus part of it. Now any new cluster comes with monitoring included "out of the box" and metrics available in global dashboards (Grafana). For this, the kube-eagle, kube-state-metrics and Prometheus services have been integrated into Kubernetes clusters. Prometheus was then configured with external labels to identify the cluster and
remote_writepointed to insertin VictoriaMetrics (see below).
VictoriaMetrics
VictoriaMetrics Time Series Database implements the Graphite, Prometheus, OpenTSDB and Influx protocols. It not only supports PromQL, but also adds new features and templates to it, avoiding refactoring of Grafana queries. Plus, its performance is amazing.
We deployed VictoriaMetrics in cluster mode and split it into three separate components:
1. VictoriaMetrics storage (vmstorage)
This component is responsible for storing data imported
vminsert. We limited ourselves to three replicas of this component, combined into a StatefulSet Kubernetes.
./vmstorage-prod \
        -retentionPeriod 3 \
        -storageDataPath /data \
        -http.shutdownDelay 30s \
        -dedup.minScrapeInterval 10s \
        -http.maxGracefulShutdownDuration 30s
VictoriaMetrics insert (vminsert)
This component receives data from deployments with Prometheus and forwards it to
vmstorage. The parameter replicationFactor=2replicates data to two of the three servers. Thus, if one of the instances vmstorageexperiences problems or restarts, there is still one available copy of the data.
./vminsert-prod \
        -storageNode=vmstorage-0:8400 \
        -storageNode=vmstorage-1:8400 \
        -storageNode=vmstorage-2:8400 \
        -replicationFactor=2
VictoriaMetrics select (vmselect)
Accepts PromQL requests from Grafana (Trickster) and requests raw data from
vmstorage. Currently, we have disabled cache ( search.disableCache), since the architecture contains Trickster, which is responsible for caching; therefore, it should vmselectalways fetch the latest complete data.
/vmselect-prod \
        -storageNode=vmstorage-0:8400 \
        -storageNode=vmstorage-1:8400 \
        -storageNode=vmstorage-2:8400 \
        -dedup.minScrapeInterval=10s \
        -search.disableCache \
        -search.maxQueryDuration 30s
The big picture
The current implementation looks like this:

Schema Notes:
- Production- . , K8s . - , . .
- deployment K8s Prometheus', VictoriaMetrics insert Kubernetes.
- Kubernetes deployment' Prometheus, . , , Kubernetes , . Global Prometheus EC2, colocation- -Kubernetes-.
Below are the metrics that VictoriaMetrics is currently processing (two-week totals, the graphs show a two-day gap): The new architecture performed well after being transferred to production. On the old configuration, we had two or three "explosions" of cardinality every couple of weeks, on the new one their number dropped to zero. This is a great indicator, but there are a few more things we plan to improve in the coming months:

- Reduce the cardinality of metrics by improving statsd integration.
- Compare caching in Trickster and VictoriaMetrics - you need to evaluate the impact of each solution on efficiency and performance. There is a suspicion that Trickster can be abandoned altogether without losing anything.
- Prometheus stateless- — stateful, . , StatefulSet', ( pod disruption budgets).
-
vmagent— VictoriaMetrics Prometheus- exporter'. , Prometheus , .vmagentPrometheus ( !).
If you have any suggestions or ideas for the improvements outlined above, please contact us . If you are working on improving Kubernetes monitoring, we hope that this article, describing our difficult journey, was helpful.
PS from translator
Read also on our blog:
- " The future of Prometheus and the project ecosystem (2020) ";
- " Monitoring and Kubernetes " (review and video report);
- " The device and mechanism of the Prometheus Operator in Kubernetes ."