 At the request of workers in this topic , I decided to make an overview-instruction on how to make a budget CO2 meter.
In this review, I will not describe the “detrimental” effect of CO2, as well as low humidity, on human well-being and health. Also, I will not prove that you cannot live without this device. Tons of articles have already been written about this, as well as disputes in the comments. I will try to concisely describe the creation of the most budgetary device, but at the same time a measuring device, not a display meter.
Also, for maximum ease of repetition, in the review I will lay out the firmware for ESP32 and the Blynk project.
To create we need the following components:
- Senseair S8 CO2 Sensor - $ 27.9
- ESP32 Wi-Fi microcontroller (30 pin model) - $ 3.2
- BME280 Temperature, Humidity and Pressure Sensor - $ 1.85 (optional)
- Air pollution sensor PM2.5 PMSA003 - $ 14.9 (optional)
- A dozen short wires to connect them.
Links to specific sellers are given for example, I selected by the number of orders, since I myself ordered on Taobao.
All sensors have proven themselves well for a long time. They have very good accuracy, excellent price / quality ratio, and deliver a minimum of problems during setup and operation. The same Senseair S8 is used in the top $ 300 AirVisual Pro home appliances.
I will make a reservation right away that in this case there will be no end device. Since the appetite comes with eating, and I also wanted to monitor the purity of the air. The PM2.5 particle sensor has just arrived, and I will design a 3D-printed case for this entire economy later. Plus, I want to order printed scarves from the Chinese so as not to mess with wires. But anyone can make a case at their discretion, the main thing to remember is that air must pass well through the case, and the temperature sensor must be kept away from all other components, since they heat up and can overestimate the temperature.
How did I get to this
DIY devices on these sensors on the internet wagon and small cart. But for some reason, mostly people are fixated on creating, so to speak, Standalone solutions. Those. a box with sensors and a screen on which readings are displayed. But I am not delighted with screens from Nokia and any symbolic 1604 and the like, all the more I would like to see graphs for analyzing the changes. A good IPS screen, firstly, will cost more than all the sensors combined, and secondly, it may require a more powerful controller, and thirdly, it will require fiddling with a normal interface (drawing the same graphics).
And since I am engaged in web-development, I immediately got the idea of separating "flies from cutlets". Those. sensors only collect data and send it to the server. Well, from the server we can get this data in the required form and for the required device. In its simplest form, we can just look at the readings, but at the same time, we can easily bind an executive device to this data (for example, turning on the supply ventilation or opening a window with a servo drive).
Blynk
Before making your bike. I decided to look at the possible ready-made solutions. Naturally, there are various services for collecting data, People's Monitoring , thingspeak , etc. But somehow they seemed too cumbersome for my case. Various systems of "smart houses", which are able to work with sensors, are also from a cannon to sparrows.
Blynk first of all attracted with its design, and good documentation with examples. A few minutes have passed for familiarization, and now the phone displays temperature and humidity with beautiful graphs. In the end, it was decided to stop at it. Moreover, for Blynk, if you wish, you can set up a local server.
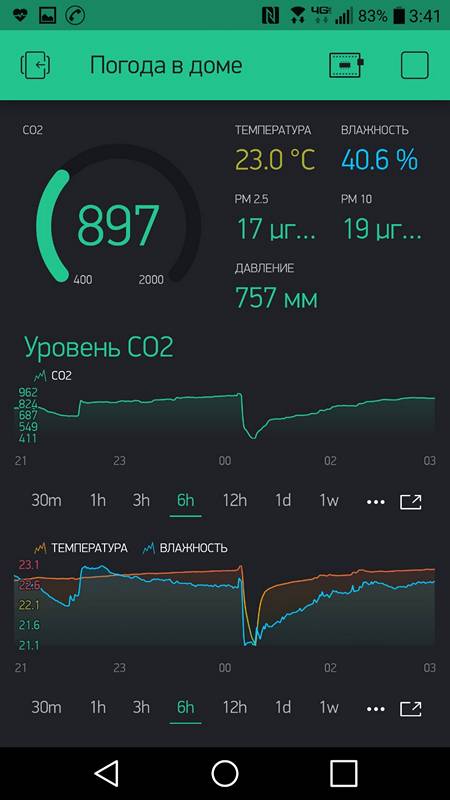
This is how the airing looks like for 10 minutes, in the tilted window mode (around 0 o'clock), then CO2 rises quite quickly, despite the fact that I am now alone in the apartment.

Everything seems to be fine, CO2 quickly dropped to 410 ppm, but the PM2.5 graph increased 2.5 times and the temperature dropped by 2 degrees.
Increase in PM2.5 when ventilated


Prices
If you are planning to use Blynk servers. That display of all those graphs that I have is not entirely free. In Blynk, each widget placed in the application costs a certain amount of battery power.

In my case, the following widgets are used:
- 5 x 400 Labeled Value
- 1 x 300 Gauge
- 3 x 900 SuperChart
Total 5000 energy. Free 2000 is given. You can buy the missing one. Energy is bought once, and can be used indefinitely, and if you delete some widget, then the energy is returned in full. And can be reused.
You can also install your own Blynk server. Or there are alternative Blynk servers with almost no limit.
Well, and another option, replacing Labeled Value with Value Display, you can save 1000, plus remove one or 2 graphs. One chart can display 4 indicators.
About sensors
SenseAir S8 sensors come in several very different modifications. For our purposes, modification 004-0-0053 is perfect, and I used it for myself. Please note that S8 sensors are available for industrial use, they look the same, but for significantly larger ranges, for example, model 004-0-0024 measures from 400 to 32000 ppm (but at the same time accuracy is ± 1000 ppm, model 0053 has an accuracy of ± 40 ppm), at home 400-800 ppm is good, and more than 2000 ppm you will already feel very bad.
I draw your attention to the fact that BME280 temperature sensors in the form of ready-made modules are available for 3.3 V and 5 V. In our case, it is necessary for 3.3 V.
Dust sensors PM 2.5 are also available in several versions: PMSA003-A (air inlet and outlet from one side) and PMSA003-C (inlet and outlet from opposite sides). Here, in principle, without much difference, it depends on how convenient it will be in the case. There are also older generations of this sensor PMS7003, PMS5003 (no additional letters). They will also work and should work with the firmware unchanged, but they are larger. For the PMSA003 sensor, it is advisable to buy an adapter, since there is a contact pad with a step of 1 mm, and it is somewhat stressful to solder with wires.
As for the ESP32 module itself, this is essentially the cheapest ESP32-based board. The firmware should work on other modifications as well, if the corresponding pins are free there.
Connection
The connection diagram looks like this.

For those who are more familiar with letters, not pictures
BME280 ( I2C)
VCC ->3V3
GBD -> GND
SCL -> D22
SDA -> D21
S8
G+ -> Vin
G0 -> GND
UART_RxD -> TX2
UART_TxD -> RX2
PMSA003
( , , )
VCC -> Vin (1) ( VCC)
GND -> GND (2)
RxD -> D35 (4)
TxD -> D34 (5)
VCC ->3V3
GBD -> GND
SCL -> D22
SDA -> D21
S8
G+ -> Vin
G0 -> GND
UART_RxD -> TX2
UART_TxD -> RX2
PMSA003
( , , )
VCC -> Vin (1) ( VCC)
GND -> GND (2)
RxD -> D35 (4)
TxD -> D34 (5)

At first I wanted to upload it as sketches for the Arduino IDE. But then I'll have to tell you how to use this very Arduino. Therefore, to increase the level of availability, I decided to make a ready-made firmware and add a WiFi manager.
At the first boot, or when it fails to connect to the network, the device switches to the access point mode and creates a network like esp32_eae234 (where after esp32 is a piece of the serial number of the chip, i.e. it will be different).
You open the list of networks on your smartphone and connect to this network. After that, the phone will say that you need to open a browser to connect (just like in various WiFi networks of stores, cafes, etc.). A page opens in the browser where you can select the one you want from the list of available networks, enter the password for it, and also enter the Token for Blynk.
A project for Blynk can be cloned simply by scanning a QR code. And in the future you can either use it ready-made, or change it for yourself.
The very same firmware with installation instructions and source codes, will be published later. I would like to get feedback on the necessary functions, well, and a few volunteers "for experiments" so that you can conduct a closed beta test, before putting it into the public domain. If it is in demand, I can organize a website so that updates can be posted.
Related materials
esp32 - studying and comparing dust sensors along the way
Four CO2 sensors in one device: checking the readings.
Comparison of CO2 sensors
How I almost threw 150k to the wind or the history of installing fresh air ventilation in an apartment
And here you can see the insides of different air quality meters
PS
By the way, it turned out why PM 2.5 increased so much during airing, it turns out that once again something is burning near Kiev. And now Kiev has entered the top 10 cities in the world with the dirtiest air . And I felt the smell of burning much later than the sensor began to show. So it's also useful to signal that now is not the time for airing.
156 is the reading in local parrots, and in PM 2.5 it is 64 µg / m³.
