
A few words about recommender systems
Surely, everyone met them more than once. Recommender systems are programs and services that try to predict what might be interesting / needed / useful to a particular user, and show them this. “Do you like these running shoes? You may also need a windbreaker, heart rate monitor and 15 more sports items . " In recent years, brands have been very active in introducing recommendation systems into their work, since both the seller and the buyer "benefit" from this decision. Consumers receive a tool that helps them to make a choice in an infinite variety of goods and services in a short time, and the business grows sales and audience.
What has been given to us?
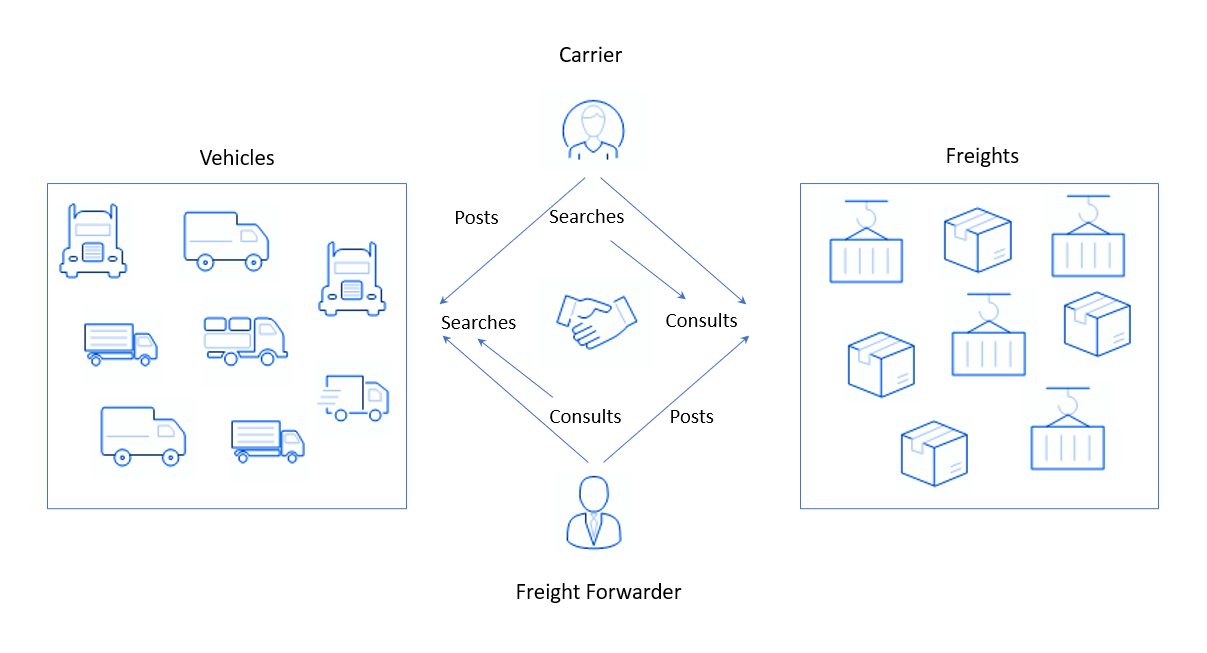
I worked on a project for a large global company that provides its customers with a SaaS freight exchange solution or a freight exchange platform.
It sounds incomprehensible, but how it actually happens: on the one hand, users are registered on the platform who have loads and who need to send them somewhere. They place an application like "There is a batch of decorative cosmetics, it needs to be taken tomorrow from Amsterdam to Antwerp"and are waiting for an answer. On the other hand, we have people or companies with trucks - freight carriers. Let's say they have already made their standard weekly flight, delivering yoghurts from Paris to Brussels. They need to go back and, in order not to go with an empty truck, find some kind of cargo to transport on the way back. To do this, freight carriers go to the platform of my customer and perform search (from the English search), indicating the direction and, possibly, the type of cargo (or freight, from the English freight), which is suitable for a truck. The system collects applications from shippers and shows them to freight carriers.
In such platforms, the balance of supply and demand is important. Here, goods are in demand from cargo carriers and trucks from shippers, and as an offer, the opposite is true: cars from carriers and goods from companies. The balance is difficult to maintain for a number of reasons, for example:
- Closed communication between the carrier and the client. When a driver often only works with a specific customer, it doesn't work well on the platform. If the shipper leaves the market, then the service may also lose the carrier, because he becomes a client of another logistics company.
- The presence of goods that no one wants to transport. This happens when small companies place orders for transportation, and then they are not updated and, accordingly, quickly leave the number of active ones.
The company wanted to improve the functionality of its freight exchange platform and increase the user experience of users so that they can see all the capabilities of the system and a wide range of goods, and also do not lose loyalty. This could keep the target audience from switching to a competitive service and show freight carriers that suitable orders can be found not only from the companies with which they are used to working.
Taking into account all the wishes, I was faced with the task of developing a recommendation system that immediately at the entrance to the platform will show the carriers the currently available relevant cargo and guess what they want to transport and where. This system was to be integrated into the existing freight exchange platform.
How will we “guess”?
Our recommendation system, like others, works on the analysis of user data. And there are several sources that you can operate on:
- First, open information about applications for the transportation of goods.
- Secondly, the platform provides data about the carrier. When the user enters into a contract with our customers, he can indicate how many trucks he has and what type. But, unfortunately, after this data is not updated. And the only thing we can rely on is the country of the carrier, as it most likely will not change.
- Thirdly, the system stores the history of user searches for several years: both the most recent requests and a year ago.
In the application where they decided to implement the recommendation system, there was already a mechanism for searching for goods by previous requests. Therefore, we decided to focus on identifying patterns or patterns by which the user searches for goods for transportation. That is, we do not recommend the load, but select the direction that is most suitable for this user today. And we will already find the goods using the standard search engine.
In general, popular searches are based on geographic information and additional parameters such as the type of truck or the item being transported. This is easy enough to track, because these preferences barely change. Below I have given the data of requests of one of the users for 3 days. The order of filling is as follows: 1 column - country of departure, 2 - country of destination, 3 - region of departure, 4 - region of destination.
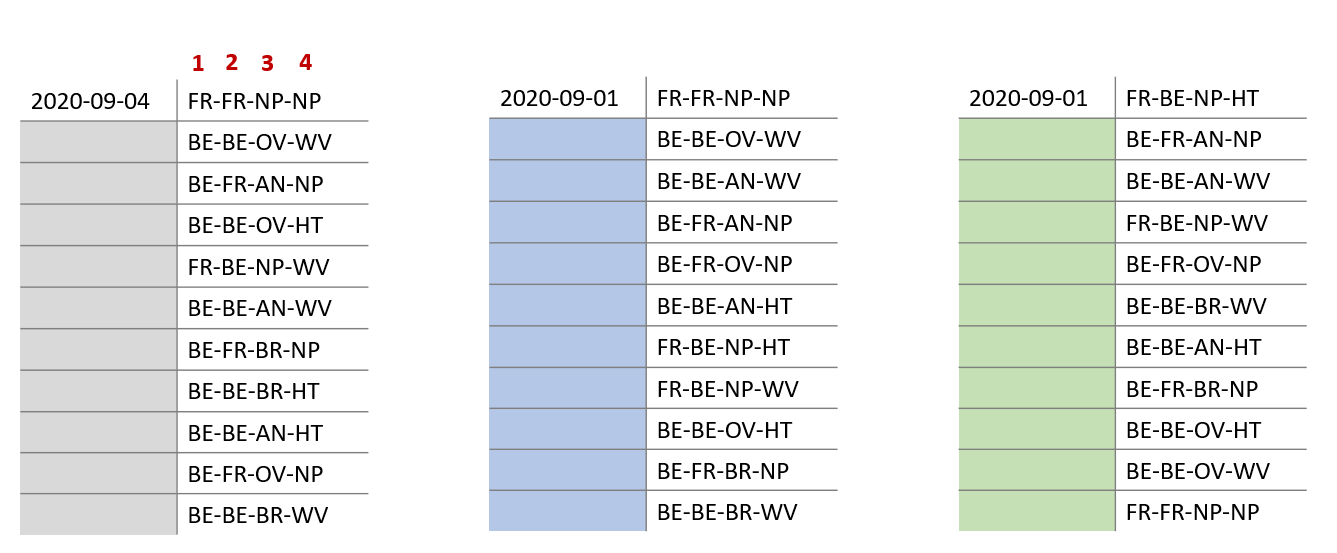
You can see that this user has specific preferences in countries and provinces. But this is not the case for everyone and not always. Very often the carrier indicates only the country of destination or does not indicate the region of departure, for example, he is located in Belgium and can come to any province to pick up the cargo. In general, there are different types of queries: country-to-country, country-to-region, region-to-country, or region-to-region (the best option).
Algorithm samples
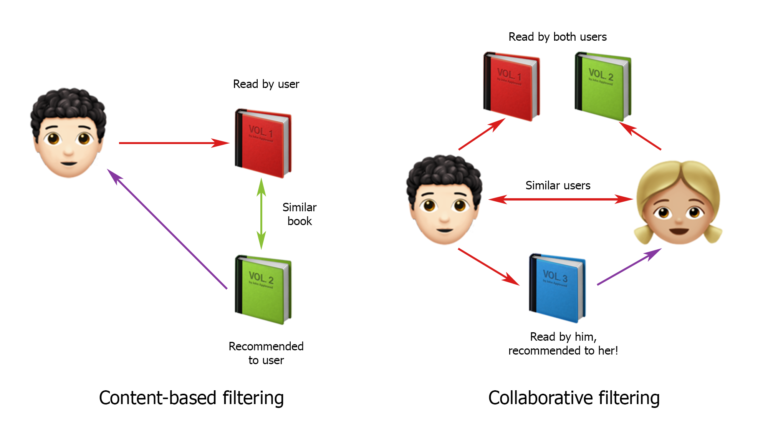
As you know, strategies for creating recommender systems are mainly divided into content-based filtering and collaborative filtering. On this classification, I began to build solutions.
I took the picture from hub.forklog.com
Many sources say that collaborative filtering works better. It's simple: we are trying to find users who are similar to ours, with similar patterns of behavior, and we recommend our user the same requests as theirs. In general, this solution was the first option that I presented to customers. But they disagreed with him and said it wouldn't work. After all, everything very much depends on where the truck is now, where it has taken the cargo, where it lives and where it is more convenient for it to go. We do not know about all this, which is why it is so difficult to rely on the behavior of other users, even if they, at first glance, are similar.
Now about the content-based systems. They work like this: first, a user profile is determined and created, and then a selection of recommendations is made based on its characteristics. Quite a good option, but in our case there are a couple of nuances. Firstly, one user can hide a whole group of people who are looking for cargo for many trucks and log in from different IPs. Secondly, from the exact data we have only the country of the carrier, and information about the number of trucks and their types is approximately "shown" only in the requests that the user makes. That is, in order to build a content-based system for our project, you need to look at the requests of each user and try to find the most popular among them.
Our first recommendation system did not use complex algorithms. We tried to rank the queries and find the highest hearts to recommend them. To test the concept, our team worked with real users: sent them recommendations, and then collected feedback. In principle, the carriers liked the result. Then I compared our recommendations with what carriers were looking for these days, and I saw that the system worked very well for users with persistent behavior patterns. But, unfortunately for those who made a wider range of requests, the accuracy of the recommendations was not very high - the system needed to be improved.
I continued to figure out what we are dealing with here. In fact, it is a hidden Markov model where a group of people can be behind each user. Moreover, users can be in various hidden states: there is no data where they currently have a truck, how many people are on one account, and when they will need to go somewhere next time. At that time, I did not know ready-made solutions for the production of the hidden Markov model, so I decided to find something simpler.
Meet PageRank
So I drew attention to the PageRank algorithm, once created by Google founders Sergey Brin and Larry Page, which is still used by this search engine to recommend sites to users. PageRank represents the entire Internet space in the form of a graph, where each web page is its node. It can be used to calculate the "importance" (or rank) for each node. PageRank is fundamentally different from the search algorithms that existed before it, since it is based not on the content of the pages, but on the links that are inside them. That is, the rank of each page depends on the number and quality of links pointing to it. Brin and Page proved the convergence of this algorithm, which means that we can always calculate the rank of any node in a directed graph and arrive at values that will not change.
Let's look at its formula:
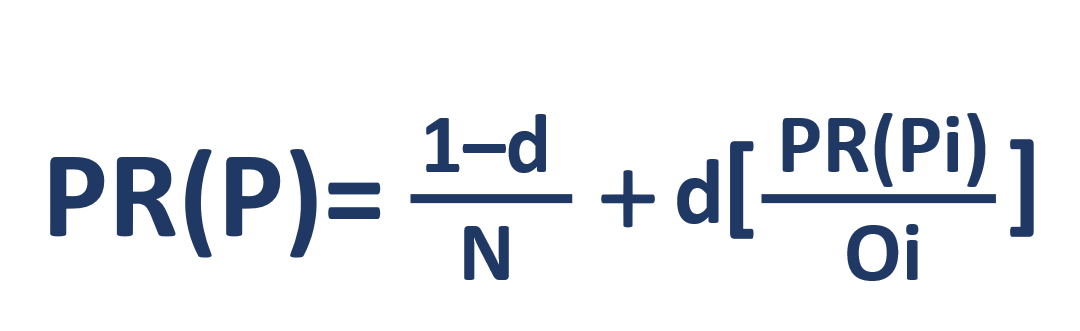
- PR(P) – rank
- N –
- i –
- O –
- d – . -, , - . , . 0 ≤ d ≤ 1 – d 0,85. .
And now a simple example of calculating PageRank for a simple graph consisting of three nodes. It is important to remember that in the beginning all nodes are given the same weight equal to 1 / number of nodes.
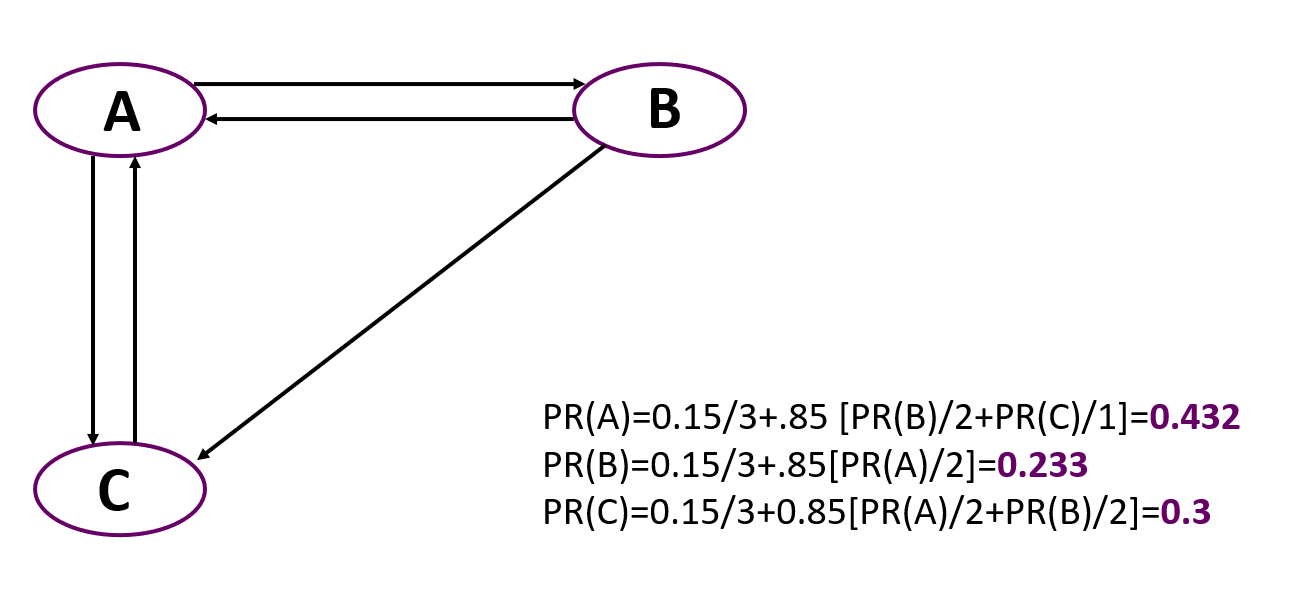
You can see that the most important here is node A, despite the fact that only two nodes point to it, like to C. But the rank of nodes pointing to A is higher than the nodes leading to C.
Assumptions and solution
So PageRank describes a Markov process with no hidden states. Using it, we will always find the final weight of each node, but we will not be able to track changes in the graph. The algorithm is really good, we were able to adapt it and improve the accuracy of the results. To do this, we took a modification of PageRank - the Personalized PageRank algorithm, which differs from the basic one in that the transition is always carried out to a limited number of nodes. That is, when the user gets tired of “walking” the links, he switches not to a random node, but to one of a given set.
In our case, the nodes of the graph will be user requests. Since our algorithm is supposed to give recommendations for the coming day, I have broken down all requests for each carrier by day. Now we build a graph: node A connects to node B, if the search for type B follows the search for type A, that is, the search for type A was carried out by the user before the day when they were looking for route B. For example: "Paris - Brussels" on Tuesday (A), and on Wednesday “Brussels - Cologne” (B). And some users make a lot of requests per day, so several nodes are connected to each other at once, and as a result, we get rather complex graphs.
To add information about the importance of moving from one heart to another, we added weights of the edges of the graph. The weight of the A-B edge is the number of times the user searched B after searching A. It is also very important to take into account the age of queries, because the user changes his template: he can move or reorganize the main type of transportation, after which he does not want to go with an empty truck. Therefore, you need to monitor the history of routes - we add the reency variable, which will also affect the weight of the node.
It is worth considering the seasonality: we may know that, for example, in September, the carrier often travels to France, and in October - to Germany. Accordingly, more weight can be given to hearts that are "popular" in a certain month. In addition, we rely on information about the last time the user searched. This helps to indirectly guess where the truck might be.
Result
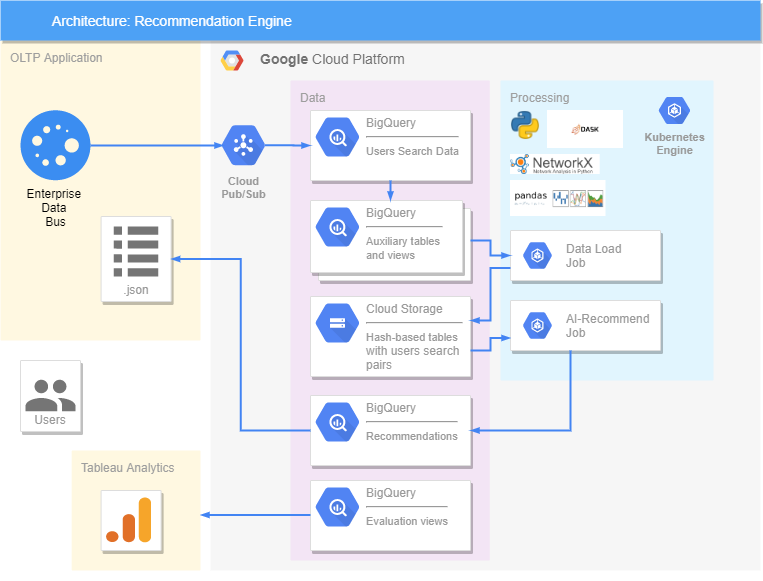
Everything is implemented on the Google platform. We have an OLTP application, from where the data on queries comes and goes to BigQuery, where additional views and tables containing already processed information are formed. The DASK library was used to accelerate and parallelize the processing of large amounts of data. In our solution, all data is transferred to Cloud Storage, because DASK only works with it and does not interact with BigQuery. Two Jobs were created in Kubernetes, one of which transfers data from BigQuery to Cloud Storage, and the second makes recommendations. It works like this: Job takes data about pairs of hearts from Cloud Storage, processes it, generates recommendations for the coming day, and sends them back to BigQuery. From there, already in .json format, we can send recommendations to the OLTP application, where users will see them.The accuracy of the recommendations is evaluated in Tableau, where our recommendations are compared with what the user actually looked for, as well as his reaction (whether he liked it or not).
Of course, I would like to share the results. For example, here is a user who makes 14 country-country hearts every day. We also recommended the same amount to him:
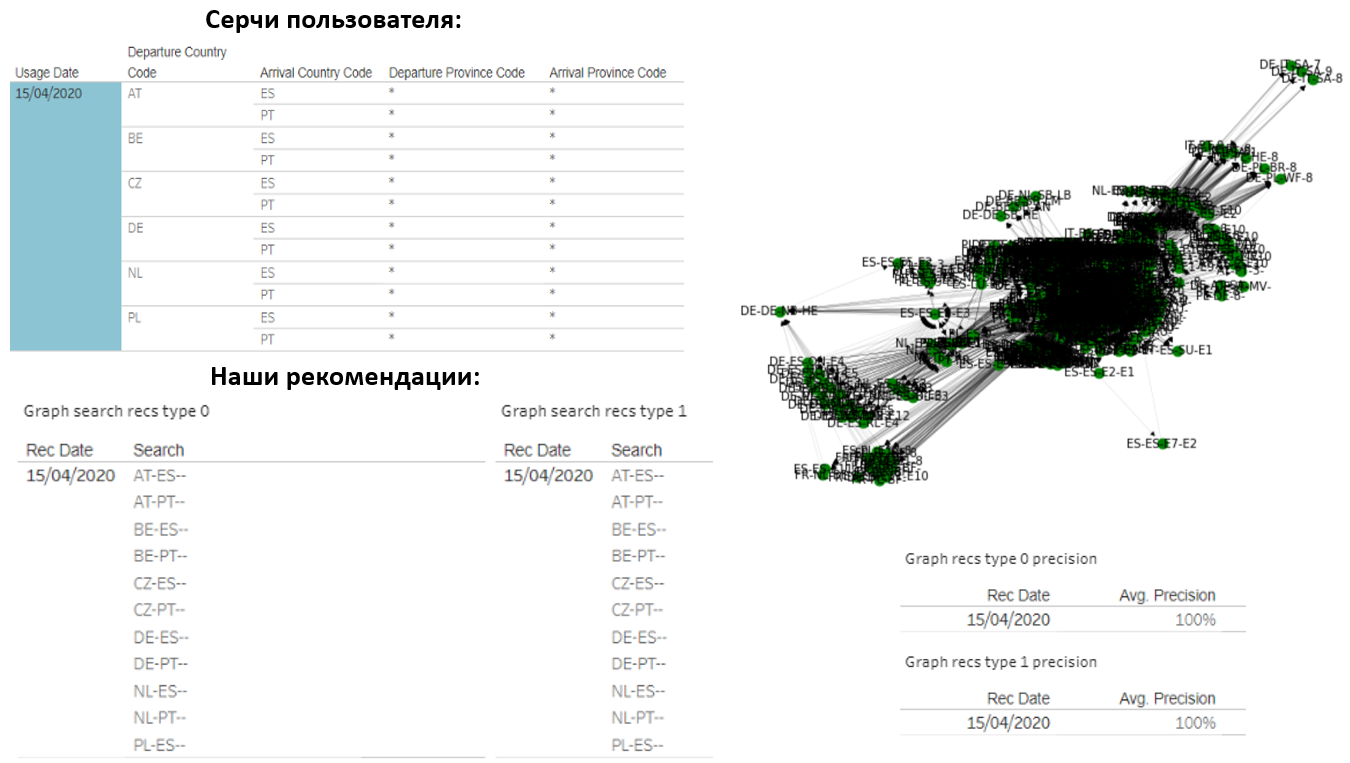
It turned out that our options completely coincided with what he was looking for. The graph of this user consists of about 1000 different requests, but we managed to very accurately guess what would interest him.
The second user, on average, makes 8 different requests every 2 days, and he searches both in the "country-country" format and with an indication of a specific region of departure. In addition, the countries of departure and delivery are completely different. Therefore, we could not "guess" everything and the accuracy of the results turned out to be lower:

Note that the user has 2 graphs with different weights. In one, the accuracy reached 38%, which means that somewhere 3 out of 8 options recommended by us turned out to be relevant. And, perhaps, if we find loads in these directions, the user will choose them.
The last and simplest example. A person makes about 2 searches every day. It has very stable patterns, not too many preferences, and a simple graph. As a result, the accuracy of our predictions is 100%.

Performance in facts
- Our algorithms run on 4 standard CPUs and 10 GB of memory.
- Data volumes are up to 1 billion records.
- It takes 18 minutes to create recommendations for all users of about 20,000.
- The DASK library is used for parallelization and the NetworkX library is used for the PageRank algorithm.
I can say that our searches and experiments have yielded very good results. The presentation of the behavior of users of the freight exchange platform in the form of a graph and the use of PageRank allows us to accurately predict their future preferences and, thus, build effective recommendation systems.