
The team invests a lot of work, effort and resources into each change in the game: sometimes the development of a new functionality or level takes several months. The analyst's task is to minimize the risks from the implementation of such changes and help the team make the right decision about the further development of the project.
When analyzing decisions, it is important to be guided by statistically significant data that is consistent with audience preferences rather than intuitive assumptions. A / B testing helps to obtain such data and evaluate them.
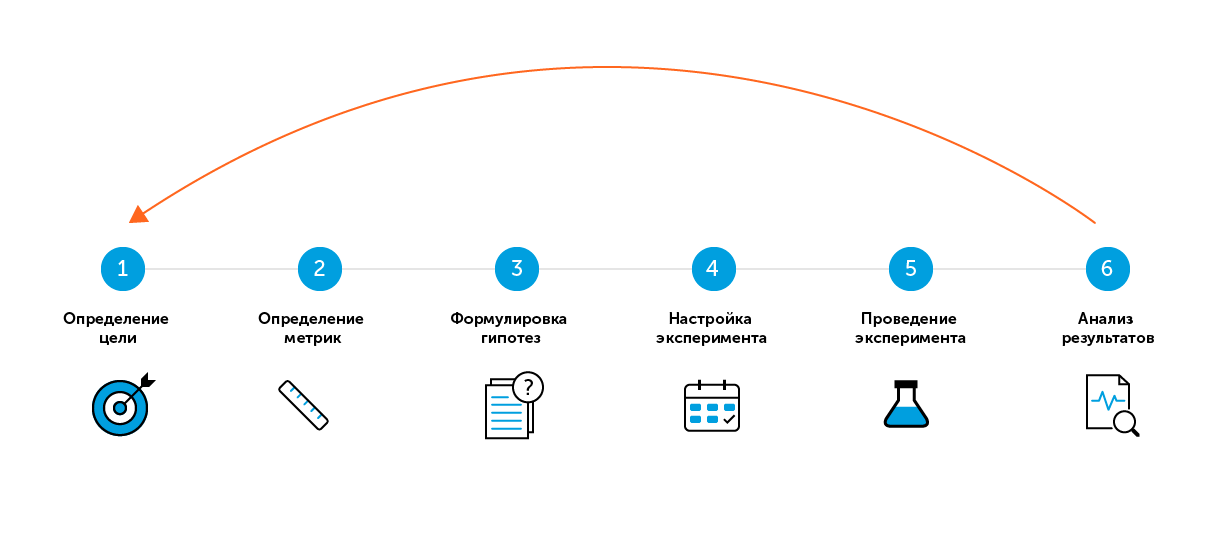
6 “easy” steps of A / B testing
For the search term "A / B testing" or "split testing", most sources offer several "simple" steps for a successful test. There are six such steps in my strategy.
At first glance, everything is simple:
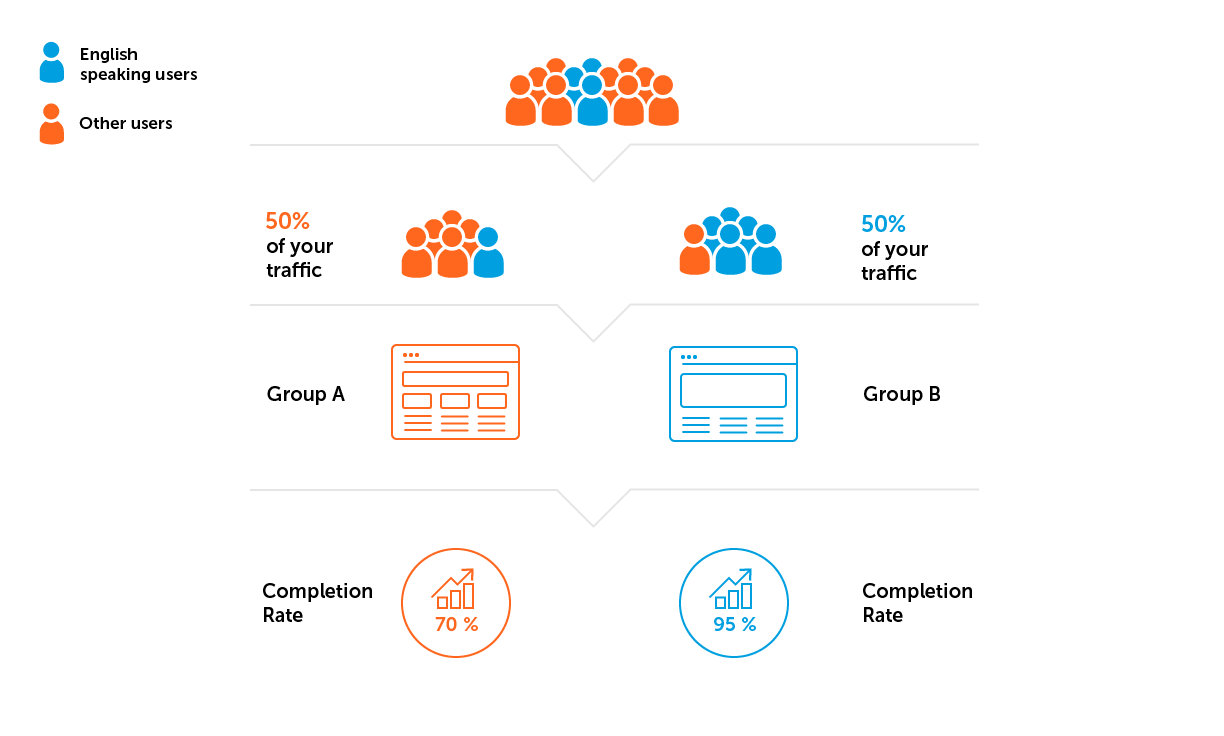
- there is group A, control, no changes in the game;
- there is a group B, test, with changes. For example, new functionality has been added, the difficulty of the levels has been increased, the tutorial has been changed;
- run the test and see which variant has better performance.
In practice, it is more difficult. For the team to implement the best solution, I, as an analyst, need to answer how confident I am in the test results. Let's deal with the difficulties step by step.
Step 1. Determine the goal
On the one hand, we can test everything that comes to mind of each team member - from the color of the button to the difficulty levels of the game. The technical ability to conduct split tests is incorporated into our products at the design stage.
On the other hand, it is important to prioritize all suggestions for improving the game according to the level of the effect on the target metric. Therefore, we first draw up a plan to launch the split testing from the highest priority hypothesis to the least.
We try not to run multiple A / B tests in parallel in order to understand exactly which of the new functionalities affected the target metric. It seems that with this strategy it will take more time to test all hypotheses. But prioritization helps to cut off unpromising hypotheses at the planning stage.
We get data that best reflects the effect of specific changes, and we don't waste time setting tests with questionable effects.
We definitely discuss the launch plan with the team, since the focus of interest shifts at different stages of the product life cycle. At the beginning of the project, this is usually Retention D1 - the percentage of players who returned to the game the next day after its installation. At later stages, these can be retention or monetization metrics: Conversion, ARPU, and others.
Example.Retention metrics require special attention after a project goes soft-launch. At this stage, let's highlight one of the possible problems: Retention D1 does not reach the level of the company's benchmarks for a particular game genre. It is necessary to analyze the funnel of passing the first levels. Let's say you notice a large drop of players between the start and the 3rd level completion - a low Completion Rate of the 3rd level.
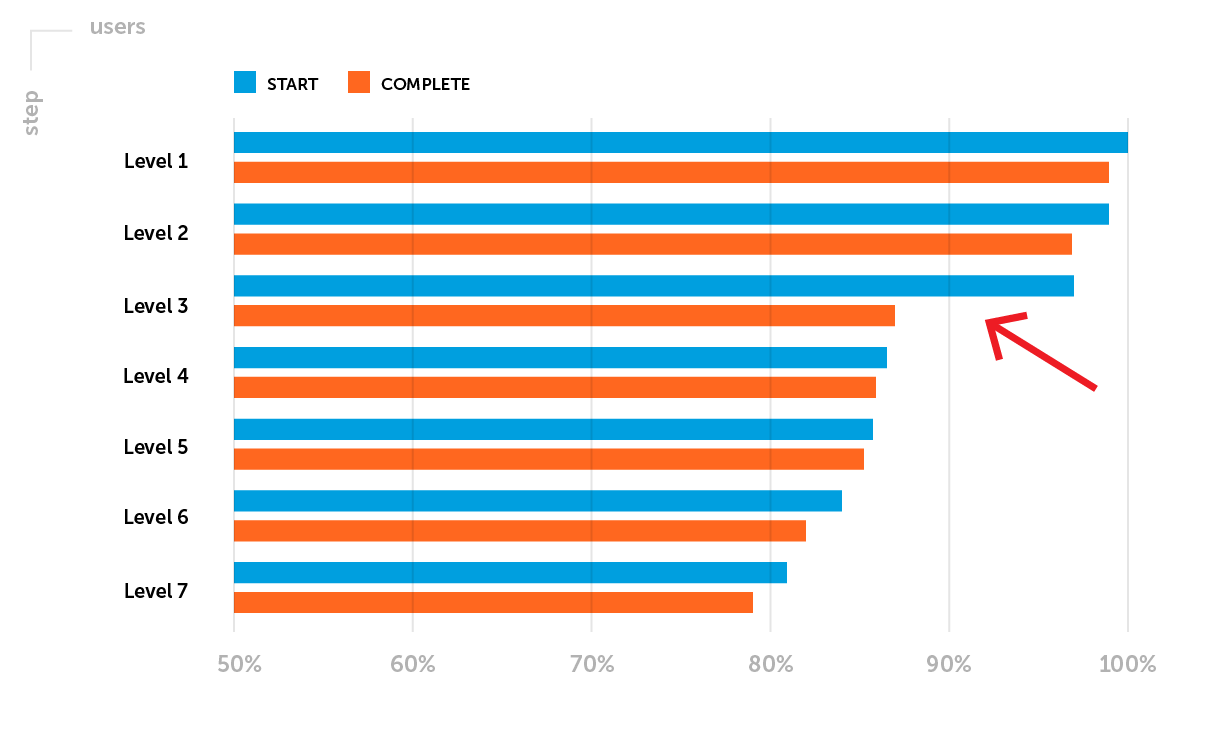
The goal of the planned A / B test : to increase Retention D1 by increasing the proportion of players who successfully completed Level 3.
Step 2. Defining metrics
Before starting the A / B test, we determine the monitored parameter - we select the metric, changes in which will show whether the new functionality of the game is more successful than the initial one.
There are two types of metrics:
- quantitative - the average duration of the session, the value of the average check, the time it takes to complete the level, the amount of experience, and so on;
- quality - Retention, Conversion Rate and others.
The type of metric influences the choice of method and tools for assessing the significance of results.
It is likely that the tested functionality will affect not one target, but a number of metrics. Therefore, we look at changes in general, but do not try to find "anything" when there is no statistical significance in assessing the target metric.
According to the goal from the first step, for the upcoming A / B test, we will evaluate the Completion Rate of the 3rd level - a qualitative metric.
Step 3. Formulate a hypothesis
Each A / B test tests one general hypothesis, which is formulated before launch. We answer the question: what changes do we expect in the test group? The wording usually looks like this:
"We expect that (impact) will cause (change)"
Statistical methods work in the opposite way - we cannot use them to prove that the hypothesis is correct. Therefore, after formulating a general hypothesis, two statistical ones are determined. They help to understand that the observed difference between control group A and test group B is an accident or the result of changes.
In our example:
- Null hypothesis ( H0 ): Reducing the difficulty of Level 3 will not affect the proportion of users who successfully complete Level 3. The Level 3 Completion Rate for Groups A and B is not really different and the observed differences are random.
- Alternative hypothesis ( H1 ): Reducing the difficulty of Level 3 will increase the proportion of users who successfully complete Level 3. The Level 3 Completion Rate is higher in Group B than in Group A, and these differences are the result of changes.
At this stage, in addition to formulating a hypothesis, it is necessary to assess the expected effect.
Hypothesis: "We expect that a decrease in Level 3 difficulty will cause an increase in the Level 3 Completion Rate from 85% to 95%, that is, by more than 11%."
(95% -85%) / 85% = 0.117 => 11.7%
In this example, when determining the expected Completion Rate of Level 3, we aim to bring it closer to the average Completion Rate of the starting levels.
Step 4. Setting up the experiment
1. Define the parameters for the A / B groups before starting the experiment: for which audience we launch the test, for what proportion of players, what settings we set in each group.
2. We check the representativeness of the sample as a whole and the homogeneity of the samples in the groups. You can pre-run an A / A test to evaluate these parameters - a test in which the test and control groups have the same functionality. The A / A test helps to make sure that there are no statistically significant differences in target metrics in both groups. If there are differences, an A / B test with such settings - sample size and confidence level - cannot be run.
The sample will not be perfectly representative, but we always pay attention to the structure of users in terms of their characteristics - new / old user, level in the game, country. Everything is tied to the purpose of the A / B test and is negotiated in advance. It is important that the structure of users in each group is conditionally the same.
There are two potentially dangerous pitfalls here:
- High metrics in groups during the experiment can be a consequence of attracting good traffic. Traffic is good if engagement rates are high. Bad traffic is the most common cause of falling metrics.
- Sample heterogeneity. Let's say the project from our example is being developed for an English-speaking audience. This means that we need to avoid a situation when more users from countries where English is not predominant will fall into one of the groups.
3. Calculate the sample size and the duration of the experiment.
It would seem that the moment is transparent, given the huge set of online calculators.
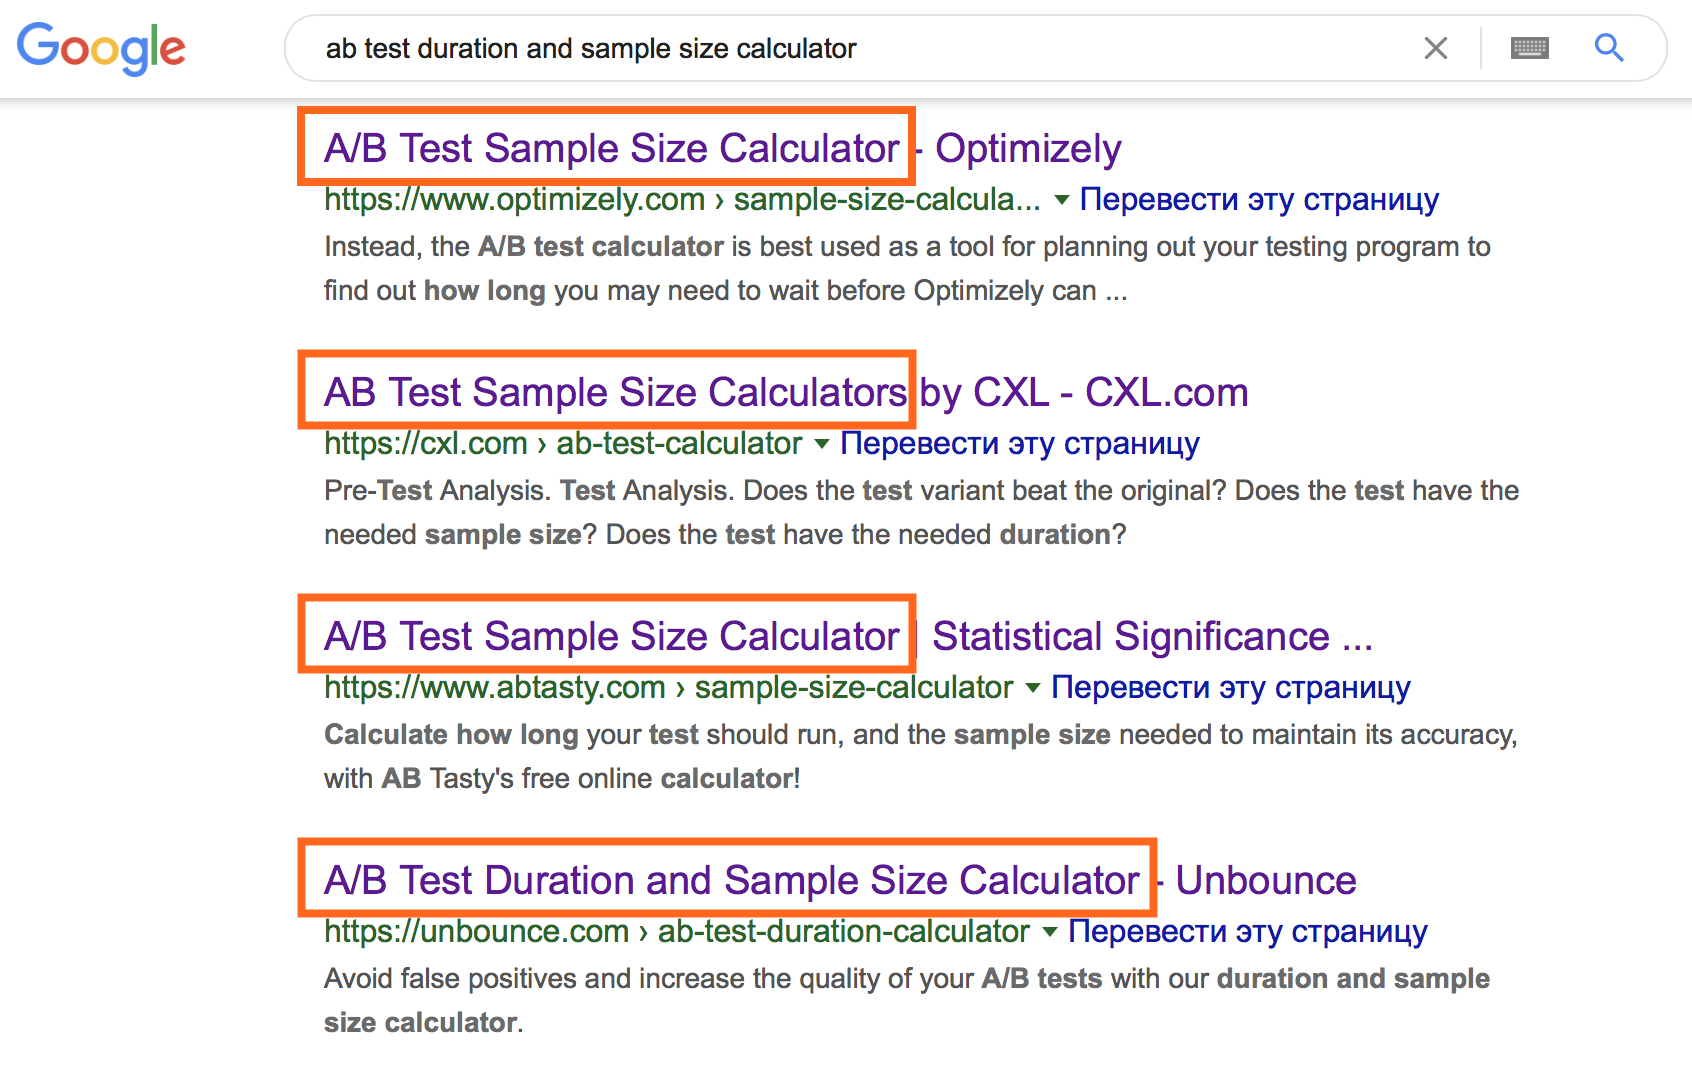
However, their use requires the input of specific initial information. To select the appropriate online calculator option, remember the data types and understand the following terms.
- General population - all users to whom the conclusions of the A / B test will be distributed in the future.
- Sample - users who actually get tested. Based on the results of the analysis of the sample, conclusions are drawn about the behavior of the entire general population.
- , . — , , , .
- , . .
- (α) — , (0), .
- (1-α) — , , .
- (1-β) — , , .
The combination of these parameters allows you to calculate the required sample size in each group and the duration of the test.
In an online calculator, you can play with the input data to understand the nature of their relationships.
An example . Let's use the Optimizely calculator to calculate the sample size for a 1% conversion rate. Consider that the expected effect size is 5% at a 95% confidence level (the indicator is calculated as 1-α). Please note that in the interface of this calculator, the term Statistical significance is used to mean “Confidence Level” at a 5% significance level.
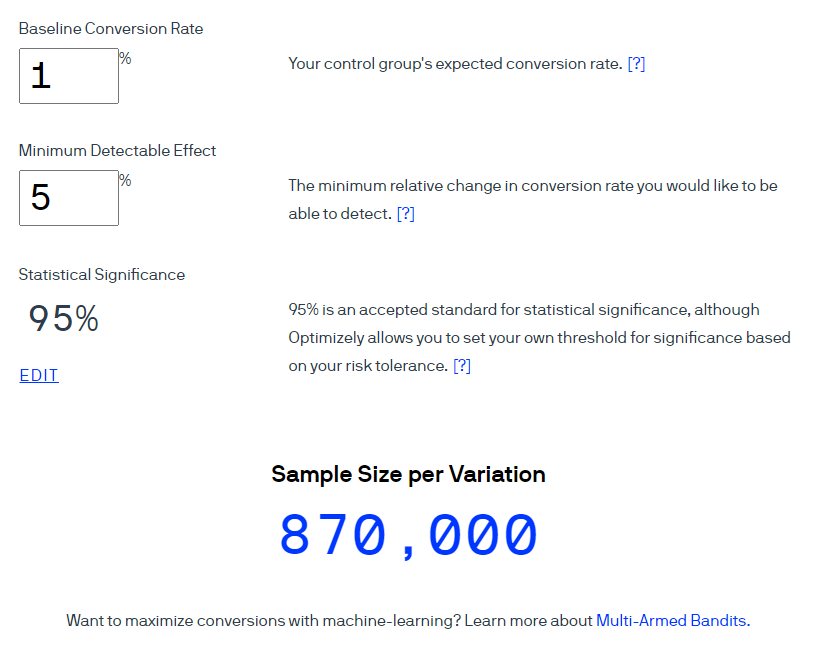
Optimizely claims that 870,000 users should be included in each group.
Converting sample size to approximate test duration - two simple calculations.
Calculation No. 1. Sample size × number of groups in the experiment = total number of users required
Calculation No. 2. Total number of users required ÷ average number of users per day = approximate number of days of the experiment
If the first group requires 870,000 users, then for the test of two options the total the number of users will be 1,740,000. Taking into account the traffic of 1,000 players per day, the test should last 1,740 days. This duration is not justified. At this stage, we usually revise the hypothesis, baseline data, and appropriateness of the test.
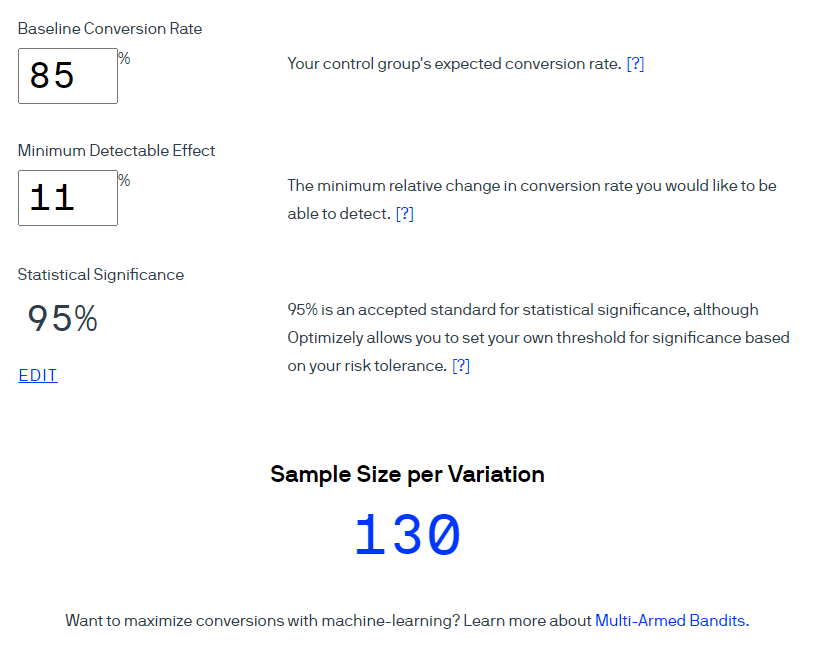
In our example with a Level 3 improvement, the conversion is the proportion of those who successfully completed Level 3. That is, the conversion rate is 85%, we want to increase this indicator by at least 11%. With a 95% trust level, we get 130 users per group.
With the same traffic volume of 1000 users, the test, roughly speaking, can be completed in less than a day. This conclusion is fundamentally wrong, since it does not take into account the weekly seasonality. User behavior differs on different days of the week, for example, it may change on holidays. And in some projects this influence is very strong, in others it is hardly noticeable. This is not a necessary condition in all projects and not for all tests, but on projects with which I have worked, weekly seasonality in KPI was always observed.
Therefore, we round the test duration to weeks to take into account the seasonality. More often, our testing cycle is one to two weeks, depending on the type of A / B test.
Step 5. Conducting an experiment
After running an A / B test, you immediately want to look at the results, but most sources strictly forbid doing this in order to eliminate the peeking problem. To explain the essence of the problem in simple words, in my opinion, no one has succeeded yet. The authors of such articles base their proofs on the assessment of probabilities, various results of mathematical modeling, which take readers into the zone of "complex mathematical formulas". Their main conclusion is an almost indisputable fact: do not look at the data before the required sample has been typed and the required number of days have passed after the test is started. As a result, many people misinterpret the problem of "peeping" and follow the recommendations literally.
We have set up the processes so that we can see up-to-date data for monitoring KPI projects on a daily basis. In pre-prepared dashboards, we follow the progress of the experiment from the very start: we check if the groups are recruited evenly, if there are any critical problems after starting the test that can affect the results, and so on.
The main rule is not to make premature conclusions. All conclusions are formulated in accordance with the laid down design of the A / B test and are summarized in a detailed report. We have been monitoring changes in the indicator since the launch of the A / B test.
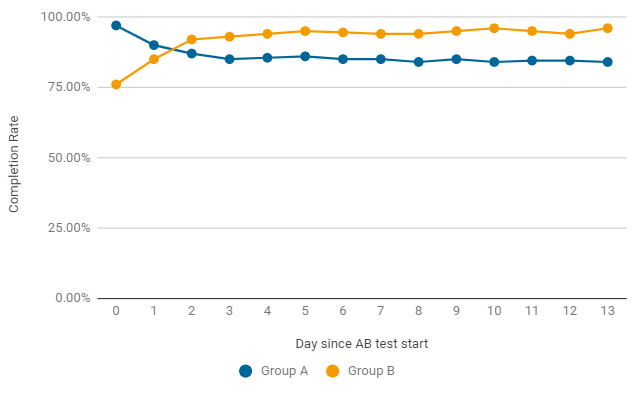
An example, as in the A / B test, the Completion Rate can change by day.In the first two days after the launch, the game variant won without changes (group A), but it turned out to be just an accident. Already after the second day, the indicator in group B acquires consistently better results. To complete the test, it needs not only statistical significance, but also stability, so we are waiting for the end of the test.
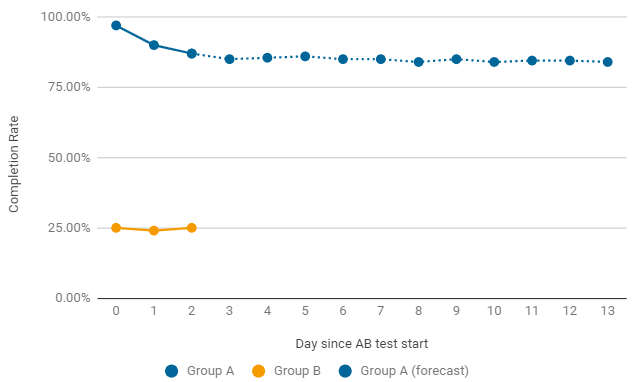
An example of when it is worth ending an A / B test prematurely. If, after launch, one of the groups gives critically low rates, we immediately look for the reasons for such a drop. The most common errors are in the configuration and settings of the game level. In this case, the current test is terminated prematurely and a new one with fixes is started.
Step 6. Analyzing the results
The calculation of key metrics is not particularly difficult, but assessing the significance of the results obtained is a separate problem.
Online calculators can be used to test the statistical significance of results when evaluating quality metrics such as Retention and Convertion.
My top 3 online calculators for tasks like this:
- Evan's Awesome A / B Tools is one of the most popular. It implements several methods for assessing the significance of a test. When using, you need to clearly understand the essence of each entered parameter, independently interpret the results and formulate conclusions.
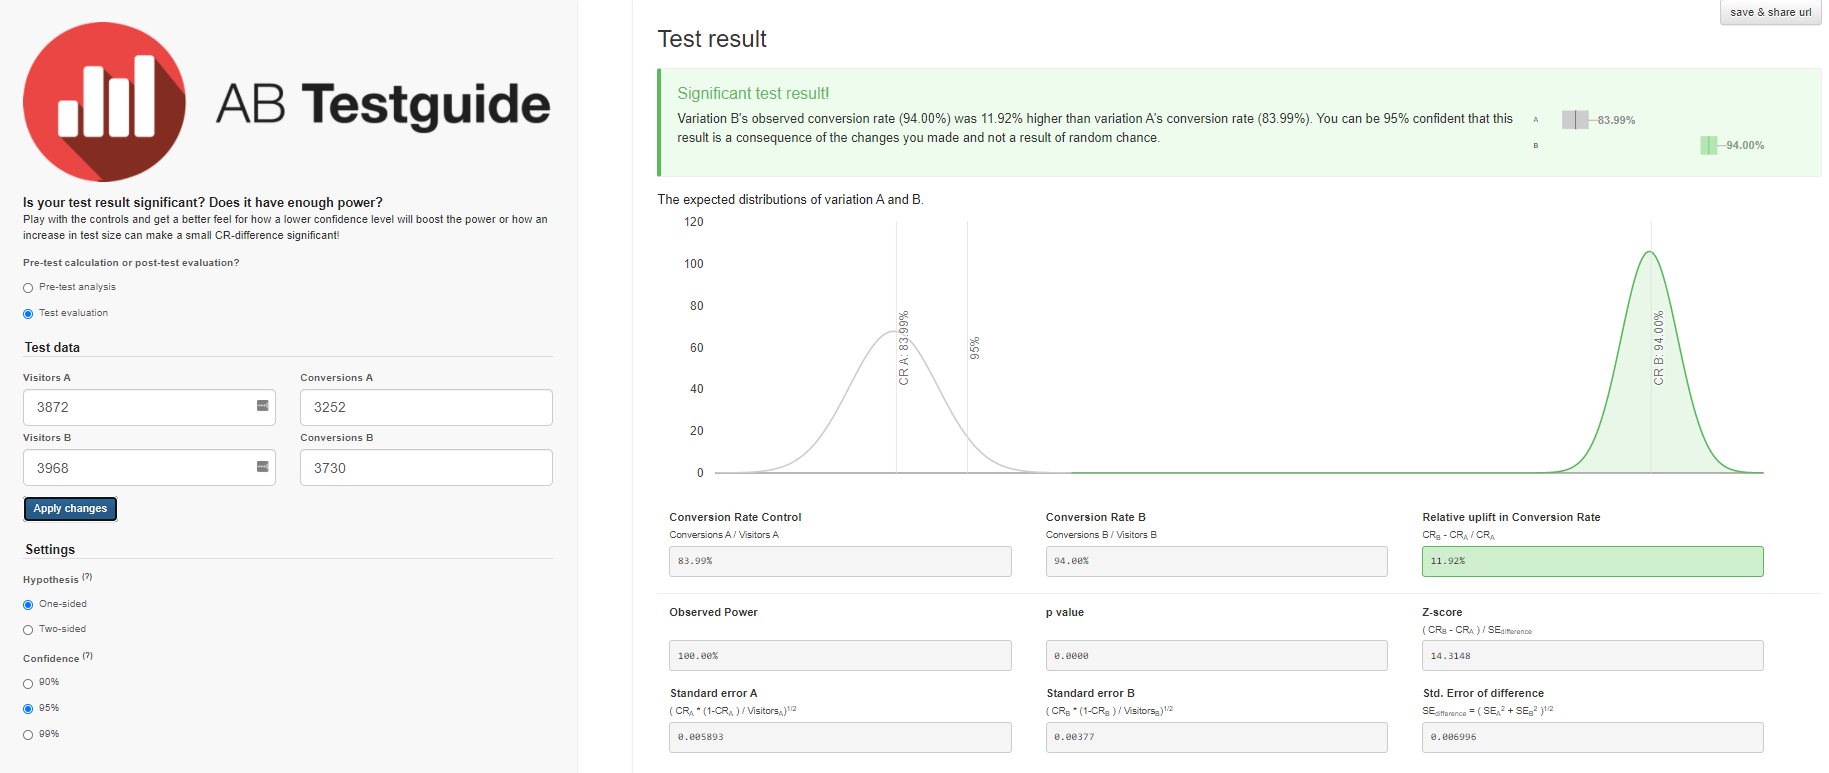
- , A/B Testguide. , . — , .
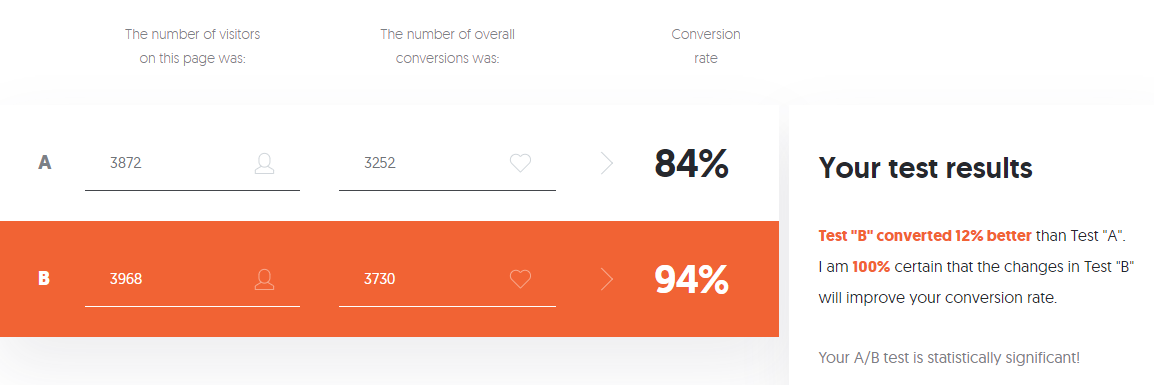
- A/B Testing Calculator Neilpatel. -, .
An example . To analyze such A / B tests, we have a dashboard that displays all the information needed to draw conclusions, and automatically highlights the result with a significant change in the target.
Let's see how to draw conclusions on this A / B test using calculators.
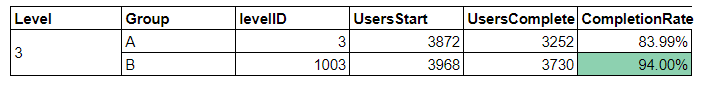
Initial data:
- In group A, out of 3870 users who started level 3, only 3252 users successfully passed it - that's 84%.
- In group B, out of 3968 users, 3730 successfully passed the level - that's 94%.
The Evan's Awesome A / B Tools calculator calculated the confidence interval for each option, taking into account the sample size and the selected significance level.
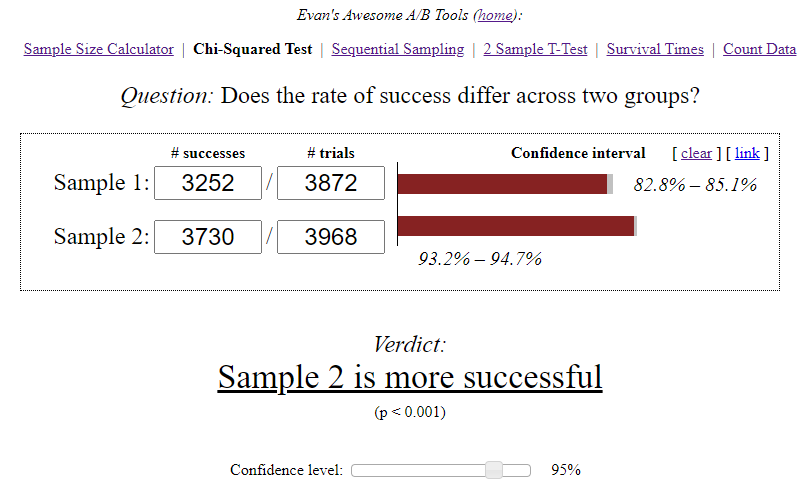
Independent conclusions:
- A — 84,00%, 82,8%—85,1%. B — 94,00%, 93,2%—94,7%. (94%-84%)/84% = 0,119 => 12%
- 12% , A. — , . 95%.
- .
We will get similar results with the A / B Testguide calculator . But here you can already play with the settings, get a graphical result and formulated conclusions.
If you are afraid of so many settings, you have no desire or need to deal with the variety of data calculated by the calculator, you can use the A / B Testing Calculator from Neilpatel .
Each online calculator has its own criteria and algorithms, which may not take into account all the features of the experiment. As a result, questions and doubts arise in the interpretation of the results. In addition, if the target metric is quantitative - average check or average length of the first session - the listed online calculators are no longer applicable and more advanced assessment methods are required.
I draw up a detailed report on each A / B test, therefore I have selected and implemented methods and criteria suitable for my tasks to assess the statistical significance of the results.
Conclusion
A / B test is a tool that does not give an unambiguous answer to the question "Which option is better?", But only allows you to reduce the uncertainty on the way to finding optimal solutions. When conducting it, the details are important at all stages of preparation, each inaccuracy costs resources and can negatively affect the reliability of the results. I hope this article was helpful to you and helps you avoid mistakes in A / B testing.