In the previous part, we stopped at the fact that it is necessary to get the color of the pixel from the original raster map by geodetic coordinates (latitude,
longitude), already translated into the SC of this map.
Geodetic coordinates are set on the surface of the ellipsoid, and pixel coordinates on the plane, i.e. you need a way to go from a convex surface to a flat one. The problem is that a convex surface (imagine that some kind of drawing or a coordinate grid is applied on it) cannot be transferred to a flat surface without any distortion. May be distorted: shape (angles), area, linear dimensions. There is, of course, the possibility, and not the only one, of transferring to a flat surface without distorting only one thing, but the rest will inevitably be distorted.

Obviously, on smaller scales (the entire planet, continent), distortions are more pronounced than on larger ones (region, city), and on the largest (plan of a small area), they are not at all discussed, because the surface of the ellipsoid on such scales is no longer distinguishable from the plane.
Here we come to the concept of map projection. I will not give examples with pictures of projecting a sphere onto a cylinder or a cone with subsequent development, for us it is now important to generalize.
A map projection is a mathematically defined way of mapping the surface of an ellipsoid onto a plane. Simply put, these are mathematical formulas for converting geodetic coordinates (latitude, longitude) into flat Cartesian ones - just what we need.
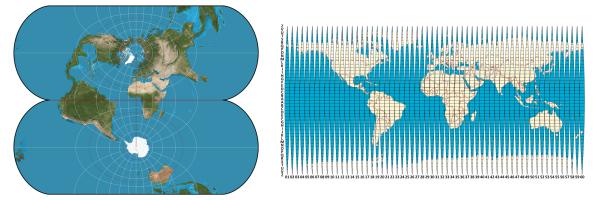
A huge variety of cartographic projections have been invented, they all find application for their own purposes: equal-sized (in which the area is preserved) for political maps, soil maps, conformal (in which the shape is preserved) - for navigation, equidistant (maintaining the scale in the chosen direction) - for computer processing and storage of geodata arrays. There are also projections that combine the above-mentioned features in certain proportions, there are completely esoteric projections. Examples of projections can be found on Wikipedia on the List of Map Projections page.
For each projection, either exact formulas are derived, or in the form of a sum of infinite converging series, and in the latter case there may even be several options. The projection formulas convert latitude and longitude to Cartesian coordinates, usually the meter is used as the unit of measurement in such coordinates. This one-meter rectangular grid can sometimes be plotted on a map (in the form of a kilometer grid), but in most cases it is not plotted. But we now know that it still exists in an implicit form. The scale of the map, which is indicated on the map, is just calculated relative to the size of this grid. It should be clearly understood that 1 meter on such a coordinate grid corresponds to 1 meter on the ground not on the whole map, but only at some points, along a certain line, or along lines in a certain direction,in the rest of the points or directions, distortions appear and 1 meter on the ground does not correspond to 1 meter of the coordinate grid.
A small digression. The function from the first part of the article WGS84_XYZ is precisely the transformation of coordinates from the WGS84 SC into rectangular coordinates, but expressed not in meters, but in pixels. As you can see, the formula there is extremely simple, if the Mercator projection was used not on a sphere, but on an ellipsoid, then the formula would be more complicated. That is why, in order to make life easier for browsers, a sphere was chosen, later the WebMercator projection took root with its sphere, for which it is often criticized.
For my needs, I used a document called "Map projections used by the US Geological Survey" in pdf format, which can be found on the Internet. The document provides detailed instructions for each projection to make it easy to write a transform function in a programming language.
Let's continue writing our algorithm. Let's implement one of the popular projections called the Transverse Mercator and one of its variants called the Gauss-Kruger projection.
struct TransverseMercatorParam {
    struct Ellipsoid *ep;
    double k;           /*                                   */
    double lat0;        /*    ( )                      */
    double lon0;        /*   ( )                      */
    double n0;          /*           */
    double e0;          /*       */
    double zw;          /*   ( )                               */
    double zs;          /*                    */
    //
    double e2__a2k2, ie2__a2k2, m0, mp, imp;
    double f0, f2, f4, f6;
    double m1, m2, m4, m6;
    double q, q1, q2, q3, q4, q6, q7, q8;
    double q11, q12, q13, q14, q15, q16, q17, q18;
    //   - 2
    double apk, n, b, c, d;
    double b1, b2, b3, b4;
};

struct TransverseMercatorParam TM_GaussKruger = {
    .ep   = &Ellipsoid_Krasovsky,
    .zw   = rad(6,0,0),
    .lon0 = -rad(3,0,0),
    .e0   = 5e5,
    .zs   = 1e6,
};
A feature of the transverse Mercator projection is that it is conformal, that is, the shape of objects on the map and angles are preserved, as well as the fact that the scale is preserved along one central meridian. The projection is suitable for the entire globe, but distortions increase with distance from the central meridian, so the entire earth's surface is cut into narrow strips along the meridians, which are called zones, for each of which its own central meridian is used. Examples of the implementation of such projections are the Gauss-Kruger projection and UTM, in which the method of distribution of coordinates over zones is also defined, i.e. defined and the same name SC.
And, in fact, the code of the functions of initialization and transformation of coordinates. In the initialization function, constants are calculated one-time, which will be reused by the conversion function.
void setupTransverseMercator(struct TransverseMercatorParam *pp) {
    double sin_lat, cos_lat, cos2_lat;
    double q, n, rk, ak;

    if (!pp->k)
        pp->k = 1.0;
    sin_lat = sin(pp->lat0);
    cos_lat = cos(pp->lat0);
    cos2_lat = cos_lat * cos_lat;
    q = pp->ep->e2 / (1 - pp->ep->e2);
    //  n = (a-b)/(a+b)
    n = (pp->ep->a - pp->ep->b) / (pp->ep->a + pp->ep->b);
    rk = (pp->ep->a + pp->ep->b) * pp->k / 2;
    ak = pp->ep->a * pp->k;
    pp->e2__a2k2  = pp->ep->e2 / (ak * ak);
    pp->ie2__a2k2 = (1 - pp->ep->e2) / (ak * ak);

    pp->f6 = 1097.0/4 * n*n*n*n;
    pp->f4 = (151.0/3 - 3291.0/8 * n) * n*n*n;
    pp->f2 = (21.0/2 + (-151.0/3 + 5045.0/32 * n) * n) * n*n;
    pp->f0 = (3.0 + (-21.0/4 + (31.0/4 - 657.0/64 * n) * n) * n) * n;

    pp->m6 = rk * 315.0/4 * n*n*n*n;
    pp->m4 = rk * (-70.0/3 - 945.0/8 * n) * n*n*n;
    pp->m2 = rk * (15.0/2 + (70.0/3 + 1515.0/32 * n) * n) * n*n;
    pp->m1 = rk * (-3.0 + (-15.0/4 + (-4.0 - 255.0/64 * n) * n) * n) * n;

    // polar distance
    pp->mp = rk * (1.0 + (1.0/4 + 1.0/64 * n*n) * n*n);
    pp->imp = 1 / pp->mp;
    pp->m0 = pp->n0 - pp->mp * pp->lat0 - sin_lat * cos_lat *
        (pp->m1 + (pp->m2 + (pp->m4 + pp->m6 * cos2_lat) * cos2_lat) * cos2_lat);

    pp->q   =                        q;
    pp->q1  =                            1.0/6    * q*q;
    pp->q2  =            3.0/8     * q;
    pp->q3  =            5.0/6     * q;
    pp->q4  =  1.0/6   - 11.0/24   * q;
    pp->q6  =            1.0/6     * q;
    pp->q7  =            3.0/5     * q;
    pp->q8  =  1.0/5   - 29.0/60   * q;
    pp->q11 =          - 5.0/12    * q;
    pp->q12 = -5.0/24  + 3.0/8     * q;
    pp->q13 =                          - 1.0/240  * q*q;
    pp->q14 =            149.0/360 * q;
    pp->q15 = 61.0/720 - 63.0/180  * q;
    pp->q16 =                          - 1.0/40   * q*q;
    pp->q17 =          - 1.0/60    * q;
    pp->q18 = 1.0/24   + 1.0/15    * q;

    //   - 2
    double e2 = pp->ep->e2;
    pp->apk = ak * (1 + n*n / 4 + n*n*n*n / 64) / (1 + n);
    pp->n = n;
    pp->b = (5 - e2) * e2 * e2 / 6;
    pp->c = (104 - 45 * e2) * e2 * e2 * e2 / 120;
    pp->d = 1237.0/1260 * e2 * e2 * e2 * e2;
    pp->b1 = (1.0/2 + (-2.0/3 + (5.0/16 + 41.0/180 * n) * n) * n) * n;
    pp->b2 = (13.0/48 + (-3.0/5 + 557.0/1440 * n) * n) * n*n;
    pp->b3 = (61.0/240 - 103.0/140 * n) * n*n*n;
    pp->b3 = 49561.0/161280 * n*n*n*n;
}

void translateTransverseMercator(struct TransverseMercatorParam *pp, int zone,
                double lat, double lon, double *ep, double *np) {
    double lon2, v, m;
    double k4, k6, h3, h5;
    double sin_lat = sin(lat);
    double cos_lat = cos(lat);
    double cos2_lat = cos_lat * cos_lat;

    lon -= zone * pp->zw + pp->lon0;
    while (unlikely(lon <= -M_PI))
        lon += 2*M_PI;
    lon2 = lon * lon;

    //
    v  = 1 / sqrt(pp->e2__a2k2 * cos2_lat + pp->ie2__a2k2);
    m  = ((pp->m6 * cos2_lat + pp->m4) * cos2_lat + pp->m2) * cos2_lat + pp->m1;
    k4 = ((pp->q1 * cos2_lat + pp->q2) * cos2_lat + 1.0/4 ) * cos2_lat - 1.0/24;
    k6 = ((pp->q3 * cos2_lat + pp->q4) * cos2_lat - 1.0/12) * cos2_lat + 1.0/720;
    h3 = ((                    pp->q6) * cos2_lat + 1.0/3 ) * cos2_lat - 1.0/6;
    h5 = ((pp->q7 * cos2_lat + pp->q8) * cos2_lat - 1.0/6 ) * cos2_lat + 1.0/120;

    //      ( )
    *np = pp->m0 + pp->mp * lat
        + (m + v * ((k6 * lon2 + k4) * lon2 + 0.5) * lon2) * cos_lat * sin_lat;
    *ep = pp->e0 + pp->zs * zone
        + (    v * ((h5 * lon2 + h3) * lon2 + 1.0) * lon ) * cos_lat;
}
At the output of the transformation function, we will have coordinates: east and north displacement (e, n) are rectangular Cartesian coordinates in meters.

We are already very close to completing our algorithm. We only need to find the coordinates of the pixel (x, y) in the map file. Because pixel coordinates are also Cartesian, then we can find them by affine transformation (e, n) to (x, y). We will return to finding the parameters of the most affine transformation a little later.
struct AffineParam {
    double c00, c01, c02;
    double c10, c11, c12;
};

void translateAffine(struct AffineParam *app, double e, double n,
                                double *xp, double *yp) {
    *xp = app->c00 + app->c01 * e + app->c02 * n;
    *yp = app->c10 + app->c11 * e + app->c12 * n;
}
And finally, the complete tile creation algorithm:
void renderTile(ImagePtr tile, int z, unsigned long x, unsigned long y) {
    int i, j;
    double wlat, wlon;
    ImagePtr srcimg;
    double lat, lon;
    double e, n;
    double x, y;

    for (i = 0; i < 256; ++i) {
        for (j = 0; j < 256; ++j) {
            XYZ_WGS84(x * 256 + j, y * 256 + i, z, &wlat, &wlon);
            translateHelmertInv(&Helmert_SK42_WGS84, wlat, wlon, 0, &lat, &lon);
            findSrcImg(&srcimg, lat, lon);
            translateTransverseMercator(&TM_GaussKruger, srcimg->zone, lat, lon, &e, &n);
            translateAffine(&srcimg->affine, e, n, &x, &y);
            setPixelColor(tile, j, i, interpolatePixelColor(srcimg, x, y));
        }
    }
}
The result of work for z = 12, y = 1377, x = 2391:

In the algorithm, the function of finding the original image of the srcimg map from the geodetic coordinates lat, lon specified in the SC of the map was not described. I think there will be no problems with it and the number of the srcimg-> zone zone, but we will dwell on finding the parameters of the affine transformation srcimg-> affine in more detail.
Somewhere on the Internet, a very long time ago, such a function was found to find the parameters of an affine transformation, I quote it even with original comments:
struct TiePoint {
    struct TiePoint       *next;
    double                lon, lat;
    double                e, n;
    double                x, y;
};

void setupAffine(struct AffineParam *app, struct TiePoint *plist) {
    /*
     *   :
     *   x = c00 + c01 * e + c02 * n
     *   y = c10 + c11 * e + c12 * n
     */
    struct TiePoint *pp;     /*   */
    double a11, a12, a13;    /*             */
    double a21, a22, a23;    /*  3*3 */
    double a31, a32, a33;    /*             */
    double b1, b2, b3;       /*   */
    int    m;                /*    z: m=0 -> z=x, m=1 -> z=y */
    double z;                /*  x,  y */
    double t;                /*      */

    /*     2-   3 ,
         . */
    /*     */
    a11 = a12 = a13 = a22 = a23 = a33 = 0;
    for (pp = plist; pp; pp = pp->next) {
        a11 += 1;
        a12 += pp->e;
        a13 += pp->n;
        a22 += pp->e * pp->e;
        a23 += pp->e * pp->n;
        a33 += pp->n * pp->n;
    }
    /*   (  ) */
    a21 = a12;
    a31 = a13;
    a12 /= a11;
    a13 /= a11;
    a22 -= a21 * a12;
    a32 = a23 - a31 * a12;
    a23 = a32 / a22;
    a33 -= a31 * a13 + a32 * a23;
    /*  ,    X  Y */
    for (m = 0; m < 2; m++) { /* m=0 -> X, m=1 -> Y */
        /*     */
        b1 = b2 = b3 = 0;
        for (pp = plist; pp; pp = pp->next) {
            z = !m ? pp->x : pp->y;
            b1 += z;
            b2 += pp->e * z;
            b3 += pp->n * z;
        }
        /*    */
        b1 /= a11;
        b2 = (b2 - a21 * b1) / a22;
        b3 = (b3 - a31 * b1 - a32 * b2) / a33;
        /*   */
        t = b2 - a23 * b3;
        *(!m ? &app->c00 : &app->c10) = b1 - a12 * t - a13 * b3;
        *(!m ? &app->c01 : &app->c11) = t;
        *(!m ? &app->c02 : &app->c12) = b3;
    }
}
At the input, at least three anchor points must be submitted, at the output we get ready-made parameters. Anchor points are points for which both the pixel coordinates (x, y) and the east and north offset coordinates (e, n) are known. The intersection points of the kilometer grid on the original map can be used as such points. What if there is no kilometer grid on the map? Then you can set pairs (x, y) and (lon, lat), as such points take the intersection points of the parallels and meridians, they are always on the map. It remains only to convert (lon, lat) to (e, n), this is done by the transformation function for the projection, in our case it is translateTransverseMercator ().
As you can see, the anchor points are needed to tell the algorithm which part of the earth's surface the file with the map image describes. Since both coordinate systems were Cartesian, no matter how many anchor points we set and no matter how far they are from each other, the discrepancy over the entire map plane will be within the error in determining the anchor points. Most of the errors are that the wrong (with not exactly specified parameters) projection, datum or ellipsoid is used, as a result, the coordinates (e, n) at the output are not obtained in the Cartesian coordinate system, but in a slightly curved relative to the Cartesian one. Visually, this can be visualized as a “crumpled sheet”. Naturally, increasing the number of anchor points does not solve this problem. The problem can be solved by tuning the parameters of the projection, datum and ellipsoid,in this case, a large number of anchor points will allow you to smoothen the “sheet” more accurately and not to miss the unsmoothed areas.
And at the end of the article I will tell you how to use ready-made tiles in OpenLayers and in what form to prepare them for the OsmAnd program.
For OpenLayers, you just need to put the tiles on the web and name them so that you can highlight (z, y, x) in the file or directory name, for example:
/tiles/topo/12_1377_2391.jpg
or, even better:
/ tiles / topo /12/1377/2391.jpg
Then they can be used like this:
map = new OpenLayers.Map (...);
map.addLayer(new OpenLayers.Layer.XYZ("Topo Maps", "/tiles/topo/${z}_${y}_${x}.jpg", {
      isBaseLayer: false, visibility: false,
  }));
For the OsmAnd program, it is easy to determine the format from any existing files with a set of tiles. I'll tell you right away about the results. The tiles are packed into a sqlite database file, which is created like this:
CREATE TABLE info AS SELECT 99 AS minzoom, 0 AS maxzoom;
CREATE TABLE tiles (x int, y int, z int, s int, image blob, PRIMARY KEY (x,y,z,s));
CREATE INDEX IND on tiles (x,y,z,s);
UPDATE info SET minzoom=$minzoom, maxzoom=$maxzoom
Column s is always filled with zero, for which it, I did not understand, the image is entered in the original binary form, the format (jpg, png, gif) is lost, but OsmAnd determines it by its content. Tiles in different formats can be packed in one database. Instead of $ minzoom and $ maxzoom, it is necessary to substitute the scale limits of the tiles entered in the base. The completed database file, for example, Topo.sqlitedb, is transferred to a smartphone or tablet in the osmand / tiles directory. Restart OsmAnd, in Menu -> "Configure Map" -> "Top Layer" a new option "Topo" will appear - this is a map with our new tiles.