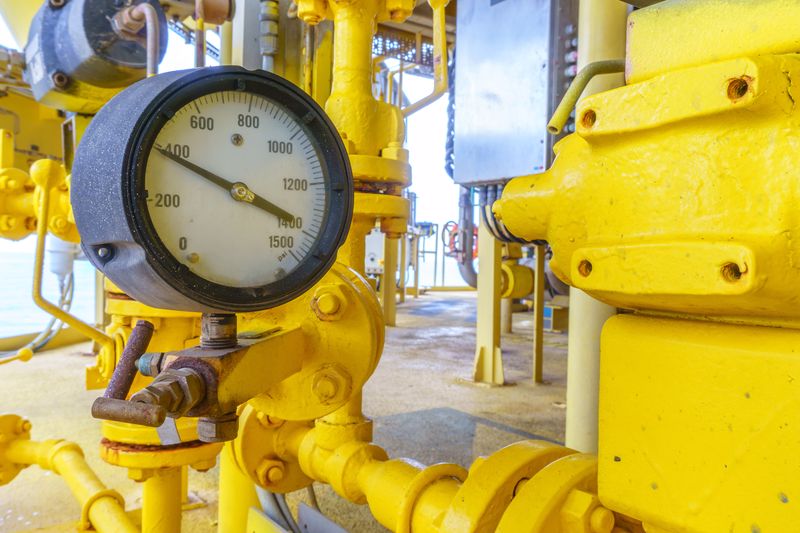
URALCHEM makes fertilizers. No. 1 in Russia - for the production of ammonium nitrate, for example, is in the top 3 domestic producers of ammonia, urea, nitrogen fertilizers. Sulfuric acids, two-three-component fertilizers, phosphates and much more are produced. All this creates aggressive environments in which sensors fail.
We built Data Lake and at the same time hunted for those sensors that freeze, fail, begin to give false data and generally behave differently from how information sources should behave. And the "trick" is that it is impossible to build mathematical models and digital twins on the basis of "bad" data: they simply will not solve the problem correctly and give a business effect.
But modern factories need Data Lakes for data scientists. In 95% of cases, "raw" data is not collected in any way, but only aggregates in the process control system are taken into account, which are stored for two months and the points of "change in dynamics" of the indicator are stored, which are calculated by a specially laid down algorithm, which for data scientists reduces the quality of the data, because ., perhaps, can miss the "bursts" of the indicator ... Actually, something like that was at URALCHEM. It was necessary to create a warehouse of production data, pick up sources in the shops and in MES / ERP systems. First of all, this is necessary in order to start collecting history for data science. Secondly, so that data scientists have a platform for their calculations and a sandbox for testing hypotheses, and not load the same one where the process control system is spinning.Data Scientists tried to analyze the available data, but this was not enough. The data was stored decimated, with losses, often inconsistent with the sensor. It was not possible to take a dataset quickly, and there was nowhere to work with it either.
Now let's get back to what to do if the sensor "drives".
When you build a lake
It's not enough just to build something like that:
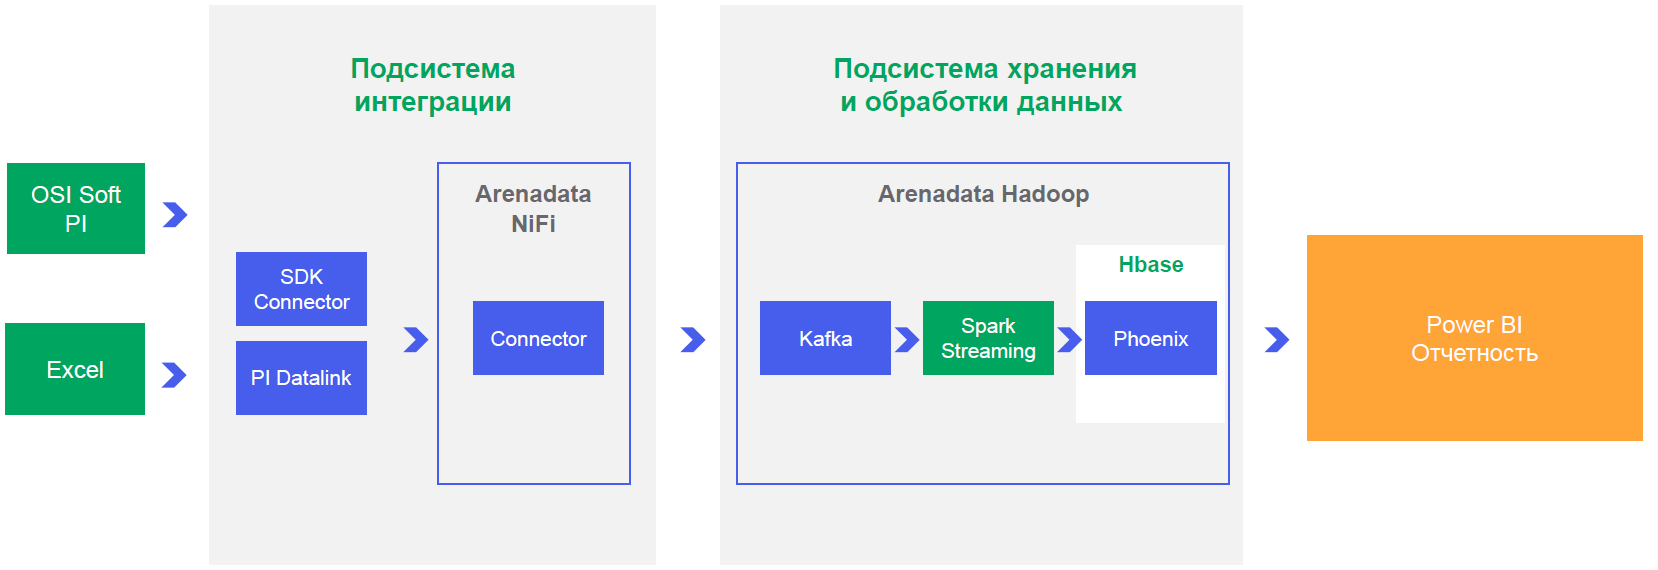
You also need to prove to the business that it all works, and show an example of one completed project. It is clear that doing one project on such a combine is about how to build communism in a single country, but the conditions are exactly that. We take a microscope and prove that they can drive a nail.
Globally, URALCHEM is tasked with digitalizing production. As part of all this action, first of all, make a sandbox for testing hypotheses, improve the efficiency of the production process, as well as develop predictive models of equipment failures, decision support systems and thereby reduce the number of downtime and improve the quality of production processes. This is when you know in advance that something is about to fail, and you can repair it a week before the machine starts to smash everything around. Benefit - in reducing the cost of production and improving product quality.
This is how the criteria for the platform and the basic requirements for the pilot appeared: storing a large amount of information, prompt access to data from business intelligence systems, calculations close to real time in order to issue recommendations or notifications as soon as possible.
We worked out the integration options and realized that for performance and operation in NRT mode, you only need to work through your connector, which will add data to Kafka (a horizontally scalable message broker that allows you to "subscribe to the event" of changing the sensor reading, and based on of this event on the fly to make calculations and generate notifications). By the way, Artur Khismatullin, the head of the production systems development department, the OTSO branch of URALCHEM JSC, helped us a lot.
What is needed, for example, to make a predictive model of equipment failure?
This requires telemetry from each node in real time or in slices close to it. That is, not once an hour a general status, but directly specific readings of all sensors for every second.
Nobody collects or stores this data. Moreover, we need historical data for at least six months, and in the process control system, as I said, they are stored for a maximum of the last three months. That is, you need to start with the fact that data will be collected from somewhere, written somewhere and stored somewhere. Data of about 10 GB per node per year.
Further, you will need to work with this data somehow. This requires an installation that allows you to normally make selections from the database. And it is desirable that on complex join'ah everything does not get up for a day. Especially later, when production begins to add more problems of predicting marriage. Well, for predictive repairs, too, an evening report that the machine may break down when it broke down half an hour ago - so-so case.
As a result, the lake is needed for data scientists.
Unlike other similar solutions, we still had the task of real-time on Hadoop. Because the next big tasks are data on the material composition, analysis of the quality of substances, material consumption of production.
Actually, when we built the platform itself, the next thing the business wanted from us was that we collect data on the failure of sensors and build a system that allows us to send workers to change them or service them. And at the same time marks the testimony from them as erroneous in history.
Sensors
In production - an aggressive environment, the sensors work in a complicated manner and often fail. Ideally, a predictive monitoring system is also needed for sensors, but first, at least assessments of which lie and which do not.
It turned out that even a simple model of determining what is there with the sensor is critical for one more task - building a mathematical balance. Correct planning of the process - how much and what needs to be put in, how to heat it, how to process it: if the planning is wrong, then it is not clear how much raw material is needed. Not enough products will be produced - the enterprise will not make a profit. If there is more than necessary - again a loss, because you need to store. The correct material balance can only be obtained from the correct information from the sensors.
So, in our pilot project, production data quality monitoring was chosen.
We sat down with the technologists for the "raw" data, looked at the confirmed equipment failures. The first two reasons are very simple.
Here the sensor suddenly starts showing data that, in principle, should not be:
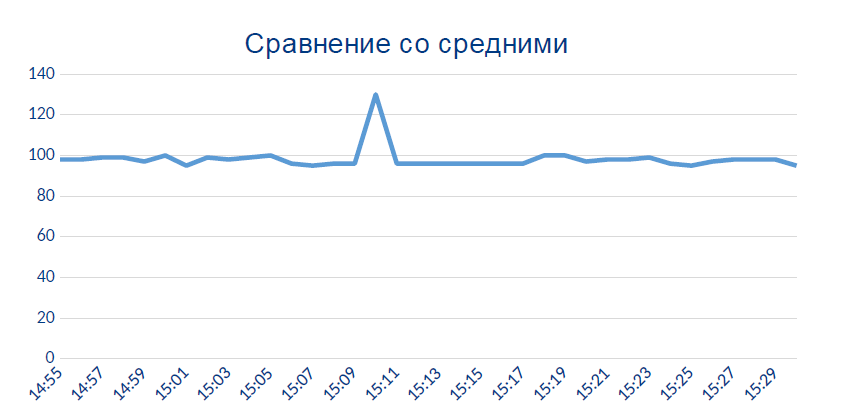
Most likely, this local peak is the moment when the sensor became thermally or chemically bad.
There is also going beyond the permissible measurement limits (when there is a physical quantity like the temperature of the water from 0 to 100). At zero, water does not move through the system, and at 200 it is steam, and we would have noticed this fact from the absence of a roof over the workshop.
The second case is also almost trivial: The
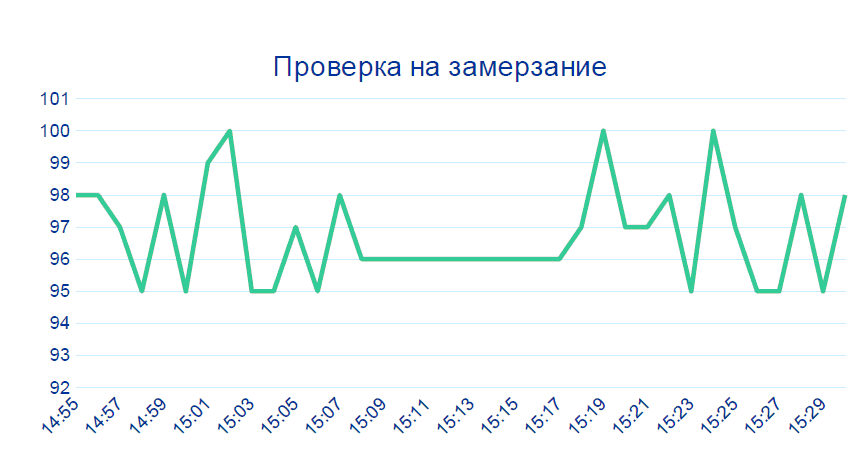
data from the sensor does not change for several minutes in a row - this does not happen in a live production. Most likely something with the device.
80% of problems are closed by tracking these patterns without any Big Data, correlations and data history. But for accuracy above 99%, we need to add another comparison with other sensors at neighboring nodes, in particular, before and after the section from which the dubious telemetry comes:
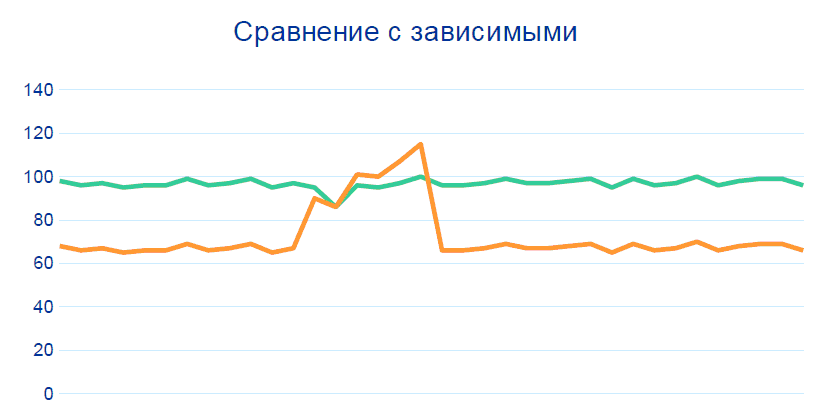
Production is a balanced system: if one indicator changes, the other must also change. Within the framework of the project, rules were formed on the relationship of indicators, and these relationships were "normalized" by technologists. Based on these guidelines, a Hadoop-based system can identify potentially inoperative sensors.
The plant operators were pleased that the sensors were being detected correctly, as this meant they could quickly dispatch a repairer or simply clean the desired sensor.
Actually, the pilot ended up listing potentially inoperative sensors in the shop that show incorrect information.
You may ask how the response to emergency and pre-emergency conditions was implemented before, and how it became after the project. I will answer that the reaction to an accident does not slow down, because in such a situation several sensors show the problem at once.
Either the technologist or the head of the department is responsible for the efficiency of the installation (and actions in case of accidents). They perfectly understand what and how is happening with their equipment, and know how to ignore some of the sensors. The process control systems that accompany the operation of the installation are responsible for the quality of the data. Normally, when the sensor is damaged, it is not put into non-working mode. For the technologist, he remains a worker; the technologist must react. The technologist checks the event and finds out that nothing happened. It looks like this: "We analyze only the dynamics, we do not look at the absolute, we know that they are incorrect, we need to adjust the sensor." We "highlight" to the specialists of the automated process control system that the sensor is wrong and where it is wrong. Now, instead of a planned formal round, he first repairs specific devices in a targeted manner, and then he makes rounds, not trusting the technology.
To make it clearer how long a planned walk takes, I will simply say that there are from three to five thousand sensors at each of the sites. We have given a comprehensive analytics tool that provides processed data, on the basis of which a specialist needs to make a decision on verification. Based on his experience, we “highlight” exactly what is needed. You no longer need to manually check each sensor, and the likelihood that something will be missed is reduced.
What is the result
Received business confirmation that the stack can be used to solve production problems. We store and process site data. The business must now choose the following processes for data scientists to operate. While they appoint a person responsible for data quality control, write regulations for him and implement this into their production process.
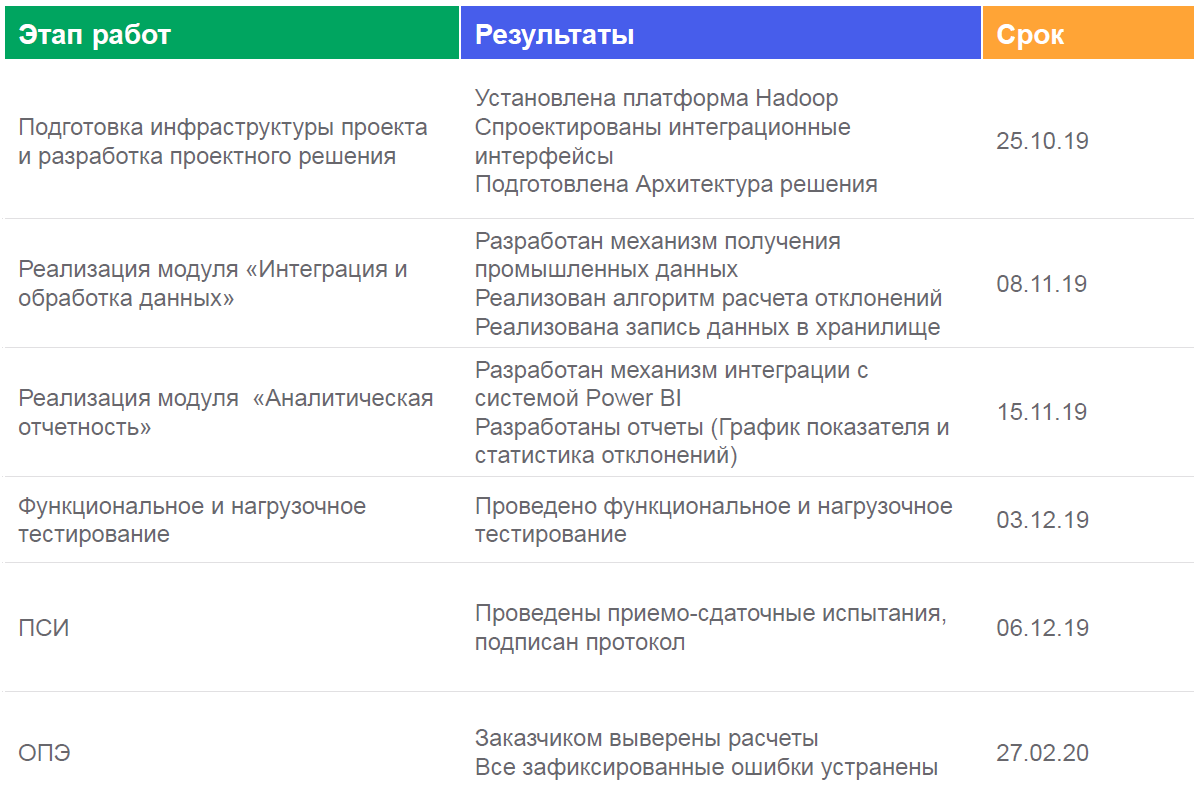
This is how we implemented this case:
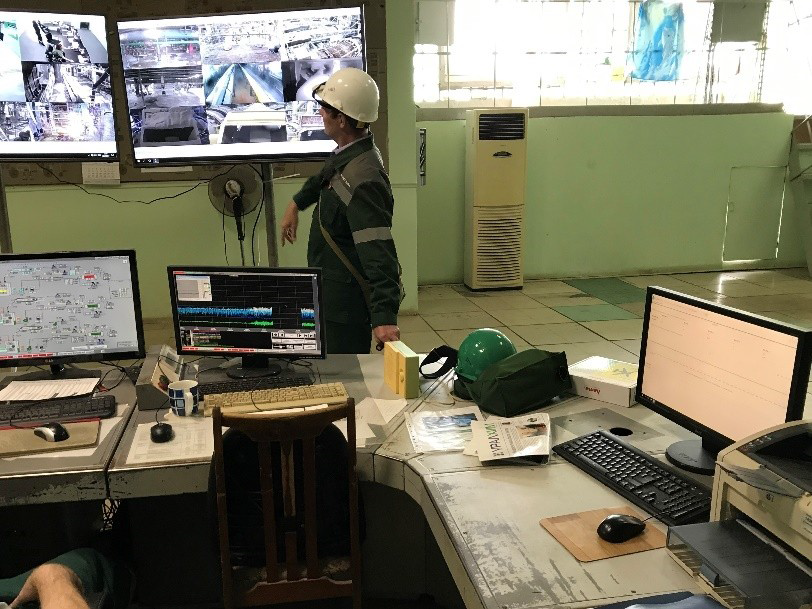
Dashboards look something like this: They are displayed
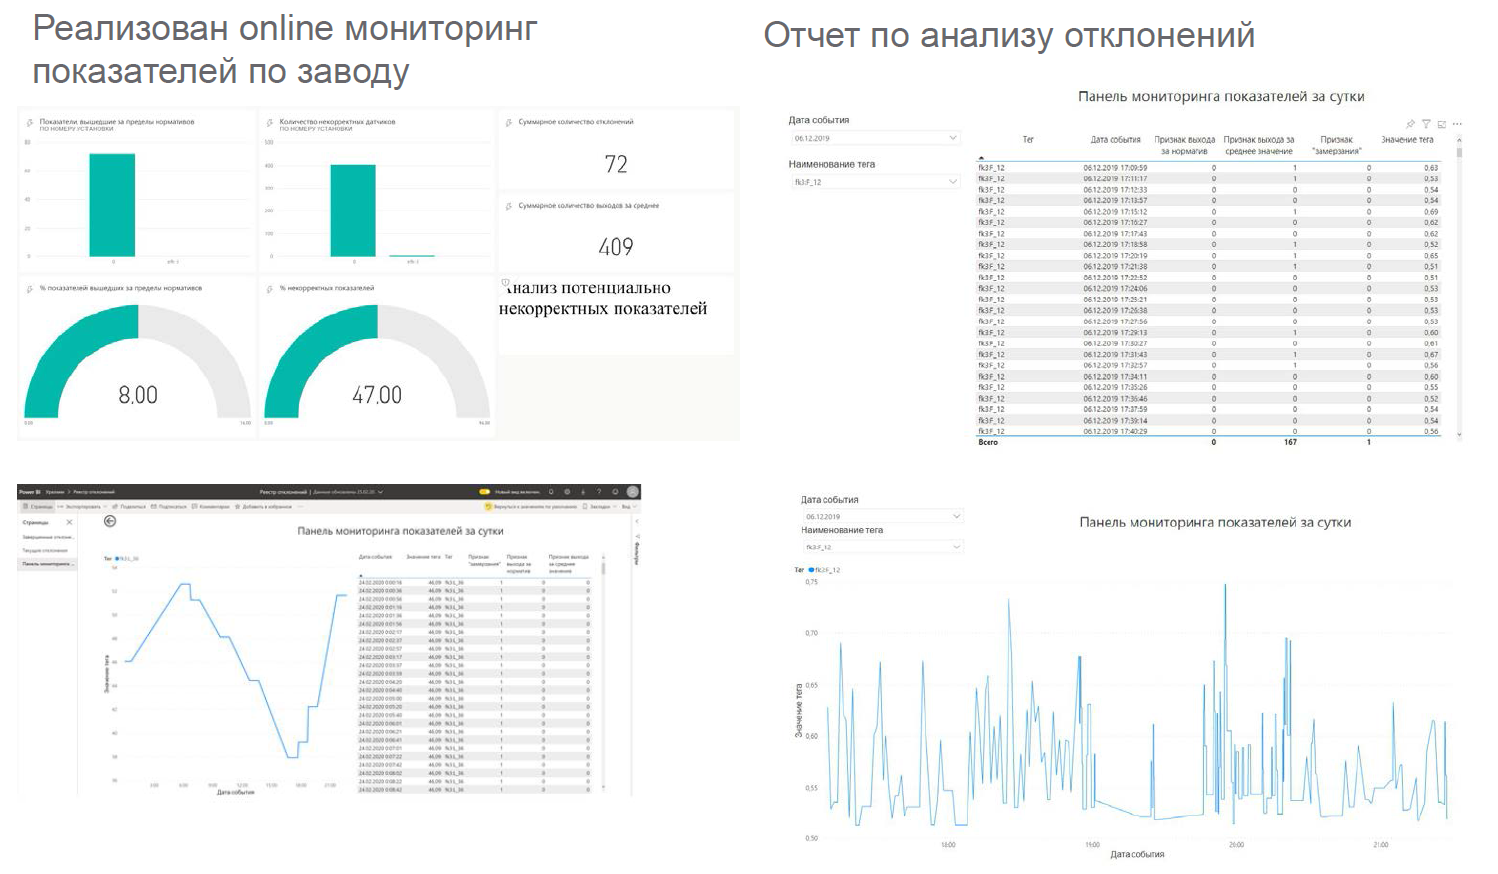
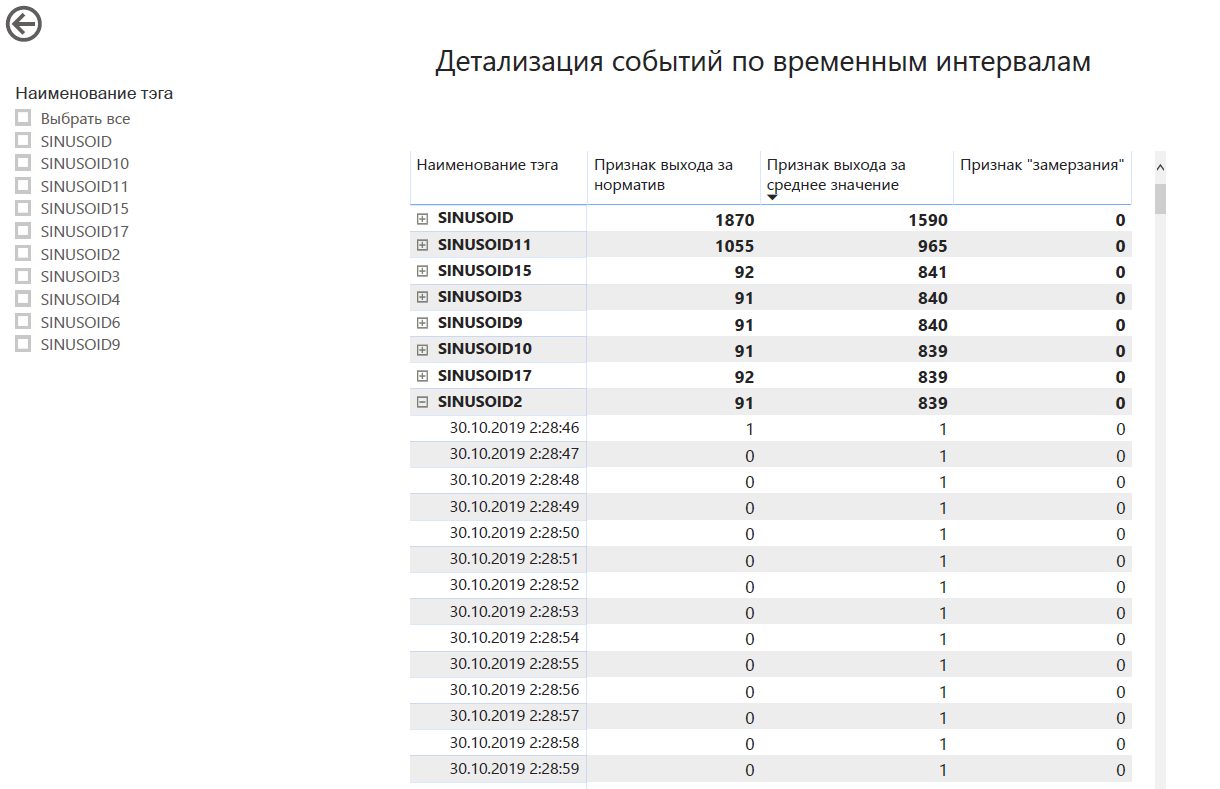
in such places:
What we have:
- an information space was created at the technological level to work with readings from equipment sensors;
- verified the ability to store and process data based on Big Data technology;
- tested the ability of business intelligence systems (for example, Power BI) to work with a data lake built on the Arenadata Hadoop platform;
- a unified analytical storage was introduced to collect production information from equipment sensors with the possibility of long-term storage of information (the planned volume of accumulated data for the year is about two terabytes);
- mechanisms and methods for obtaining data in a near-real-time mode have been developed;
- an algorithm for determining deviations and incorrect operation of sensors in the Near real time mode was developed (calculation - once a minute);
- tests of the system operation and the ability to generate reports in the BI-tool were carried out.
The bottom line is that we have solved a completely production problem - we have automated a routine process. We gave out a forecasting tool and freed up time for technologists to solve more intelligent problems.
And if you still have questions not for comments, then here is the mail - chemistry@croc.ru